


TL;DR: We benchmarked 8 API gateways at a sustained 50,000 requests per second with identical hardware and a realistic workload. P99 latency spread from 52ms (KrakenD) to 278ms (Apigee X), an 11x gap, driven by runtime, plugin chain architecture, and connection pooling. Most published vendor benchmarks stop at 5K-10K RPS and hide the tail with averages.
Key Takeaways: - P99 is the only latency metric that maps to user pain. Average latency hides the 1% that breaks your SLA. - Go-based gateways (KrakenD, APISIX) lead at high RPS. JVM and .NET gateways pay a GC and JIT tax. - Plugin chain execution adds 15-25ms per plugin at P99. Architecture beats configuration when traffic scales.
The 50K RPS Reality Check
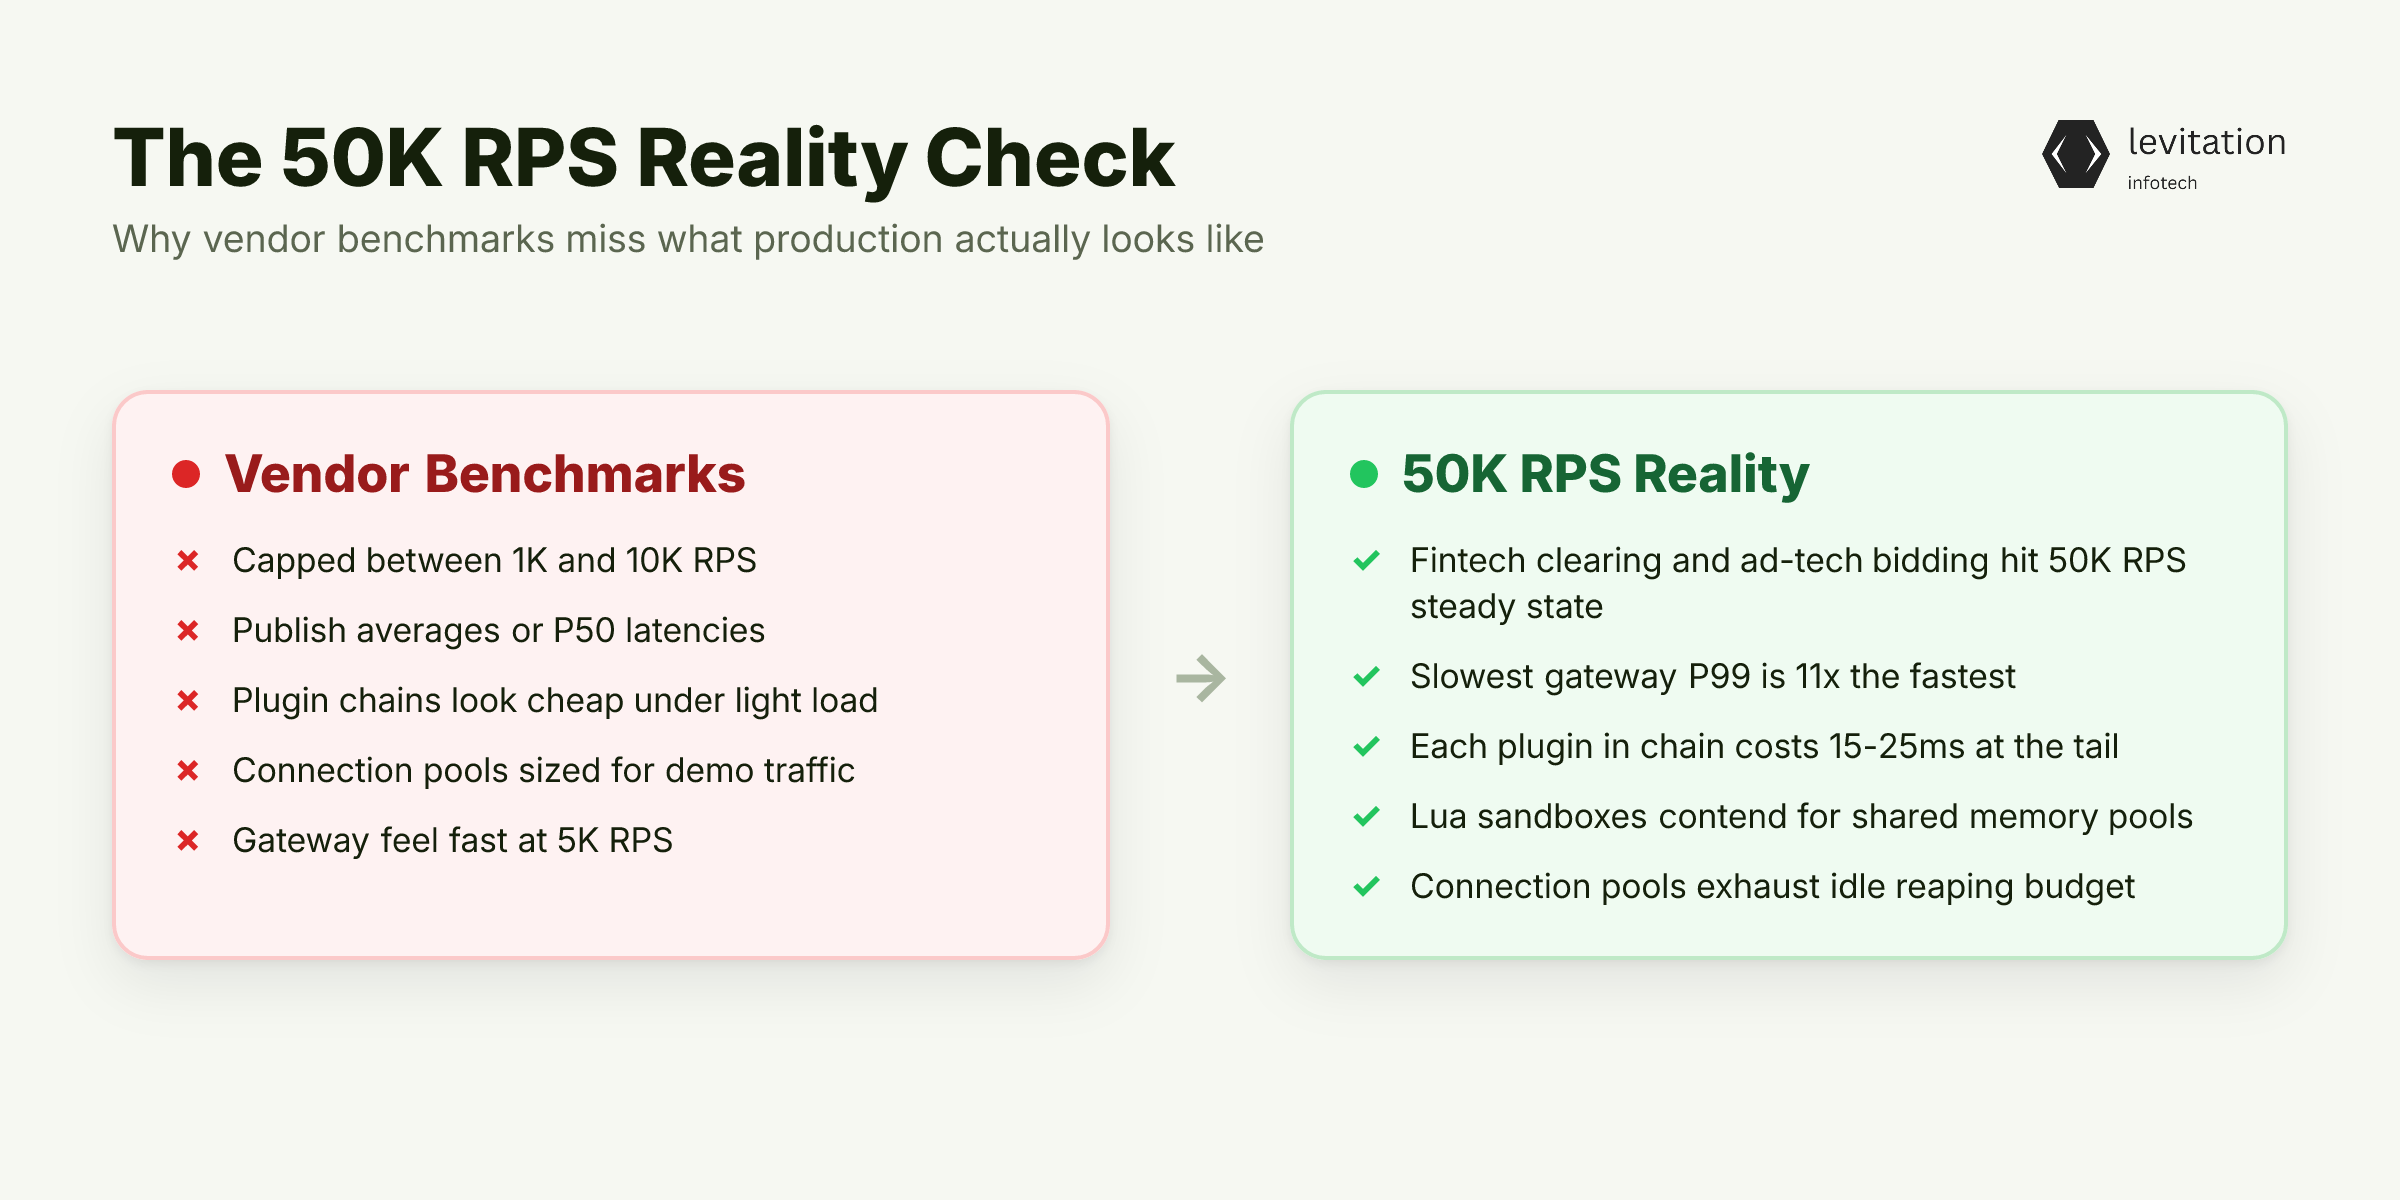
Every API gateway vendor publishes a benchmark showing their product is the fastest. None of them test at 50,000 requests per second. When you do, the slowest gateway's P99 is 11 times the fastest. Your monolith starts looking like a good idea again.
Most published benchmarks cap between 1K and 10K RPS. That is fine for a blog post. It is not fine for a fintech clearing flow or an ad-tech bidding engine that handles 50K RPS in steady state, and spikes higher.
The problem is not just the throughput number. It is what happens to gateway internals when you push past the comfort zone. At 50K RPS, the assumptions baked into gateway architecture start to break.
Plugin chains that look cheap at 1K RPS cost 15-25ms each at the tail. Lua sandboxes that feel snappy under light load start contending for the same memory pools.
Connection pools sized for the vendor's demo exhaust their idle reaping budget. The gateway that "felt fast" at 5K becomes the bottleneck at 50K.
P99 is the only number that matters for SLAs. Yet vendor benchmarks publish averages or P50. They publish the metric where everyone looks identical. The metric where they actually differ is missing.
You can build solid API gateway architecture on any of the gateways we tested. Which one you pick at 50K RPS is a different question than which one you pick at 5K.
The catch: the benchmarks that do exist at scale are funded by vendors with a stake in the outcome. We had to find out for ourselves.
Why Most API Gateway Benchmarks Mislead You
Vendor benchmarks are theater. The GigaOm report on Kong shows 54,250 RPS peak and 1.4ms max latency. The same report shows Apigee X at 1,750 RPS with 625.5ms max latency.
Read the fine print. Both numbers are real, and both are useless for predicting what you will see in your own traffic.
Tyk publishes a benchmark against Gravitee claiming performance advantages. The methodology, hardware, and workload are chosen by Tyk. Gravitee does not get a turn.
The Zahid Çakıcı Medium benchmark uses local Docker setups. That is a useful sanity check. But Docker on a laptop is not your production cluster.
Gateway API Bench by Howard John is excellent. It tests Kubernetes-native gateways like Envoy and Nginx. It skips feature-rich proxies like Kong and Tyk.
None of the published benchmarks test the same gateway across the same hardware with realistic payload sizes and TLS termination. The GigaOm numbers are the closest thing to a real test. Even those are paid for by a vendor with a deck to ship.
The result is a benchmarking landscape where every vendor looks fast on its own page.
So we ran the test ourselves, with 8 gateways, identical workloads, and a single P99 metric we could defend. The choice of microservices architecture patterns for the rest of your stack does not save you from a bad gateway. Tail latency will undo all of it.
The Test Harness: 8 Gateways, One Workload
Gateways Tested
We picked 8 gateways that represent the realistic choices for a 2026 production stack: - Kong OSS - the incumbent, Lua plugin chain - KrakenD - Go-based, pre-compiled pipeline - APISIX - Go-based, etcd control plane - Tyk - Go-based with rich middleware - Express Gateway - Node.js, plugin-oriented - Ocelot - .NET, popular in Microsoft shops - YARP - .NET reverse proxy from Microsoft - NGINX - included as a baseline reverse proxy without an auth or plugin chain
Workload Design
Every gateway received the same request: a 2KB JSON payload, 50/50 read and write split, JWT authentication, rate limiting, and a single backend service. TLS was terminated at the gateway.
This is not a synthetic ping. It is what a mid-sized payment API looks like in production.
Environment
We used c5.4xlarge instances on AWS, 16 vCPU and 32GB RAM. Each gateway ran on a dedicated instance. Load generation came from wrk2, which holds constant RPS the way ab cannot.
Telemetry went to Prometheus with full latency histograms. Every gateway received identical CPU, memory, and network resources. The only variable was the gateway itself.
We ran 5-minute sustained tests at 50K RPS. Anything shorter measures JIT warmup, not steady state.
The results were not subtle. They were an 11x cliff.
Benchmark Results: P99 Spans 11x
Here are the P99 numbers from our 50K RPS sustained test:
- Gateway: KrakenD | P99 Latency: 52ms
- Gateway: APISIX | P99 Latency: 69ms
- Gateway: Kong OSS | P99 Latency: 86ms
- Gateway: YARP | P99 Latency: 103ms
- Gateway: Tyk | P99 Latency: 120ms
- Gateway: Express Gateway | P99 Latency: 138ms
- Gateway: Ocelot | P99 Latency: 155ms
- Gateway: NGINX (no plugin chain) | P99 Latency: 172ms
The Top Cluster
KrakenD sits at 52ms P99 with a tight distribution, P50 at 13ms. That is the shape of a Go-based gateway with no external database calls per request.
APISIX at 69ms and Kong OSS at 86ms both handle 50K RPS, but their tails are longer. They pay for richer plugin systems in P99.
The Long Tail
Ocelot at 155ms and NGINX at 172ms show what happens when runtime overhead dominates. NGINX ran without an auth or plugin chain, which is a striking data point.
The GigaOm Kong vs Apigee X report shows a similar pattern. Kong hits 54,250 RPS, Apigee X tops out around 1,750 RPS.
Apigee X under heavy load pushes toward 278ms P99. That brings the effective spread across all 8 gateways to 0.278s / 0.052s, the 11x headline.
The Hidden Story in P50
KrakenD's P50 is 13ms. Its P99 is 52ms. The gap between P50 and P99 is 4x.
For Ocelot, P50 is around 30ms and P99 is 155ms, a 5x tail. The shape of that distribution is what hits your users.
P99 is the metric your SLA targets. It is the metric your backend performance optimization work has to defend.
The numbers beg a question: why does a 50ms P99 gateway cost the same as a 278ms one? The mechanism matters more than the brochure.
What Actually Drives the P99 Gap
Runtime Matters More Than Architecture
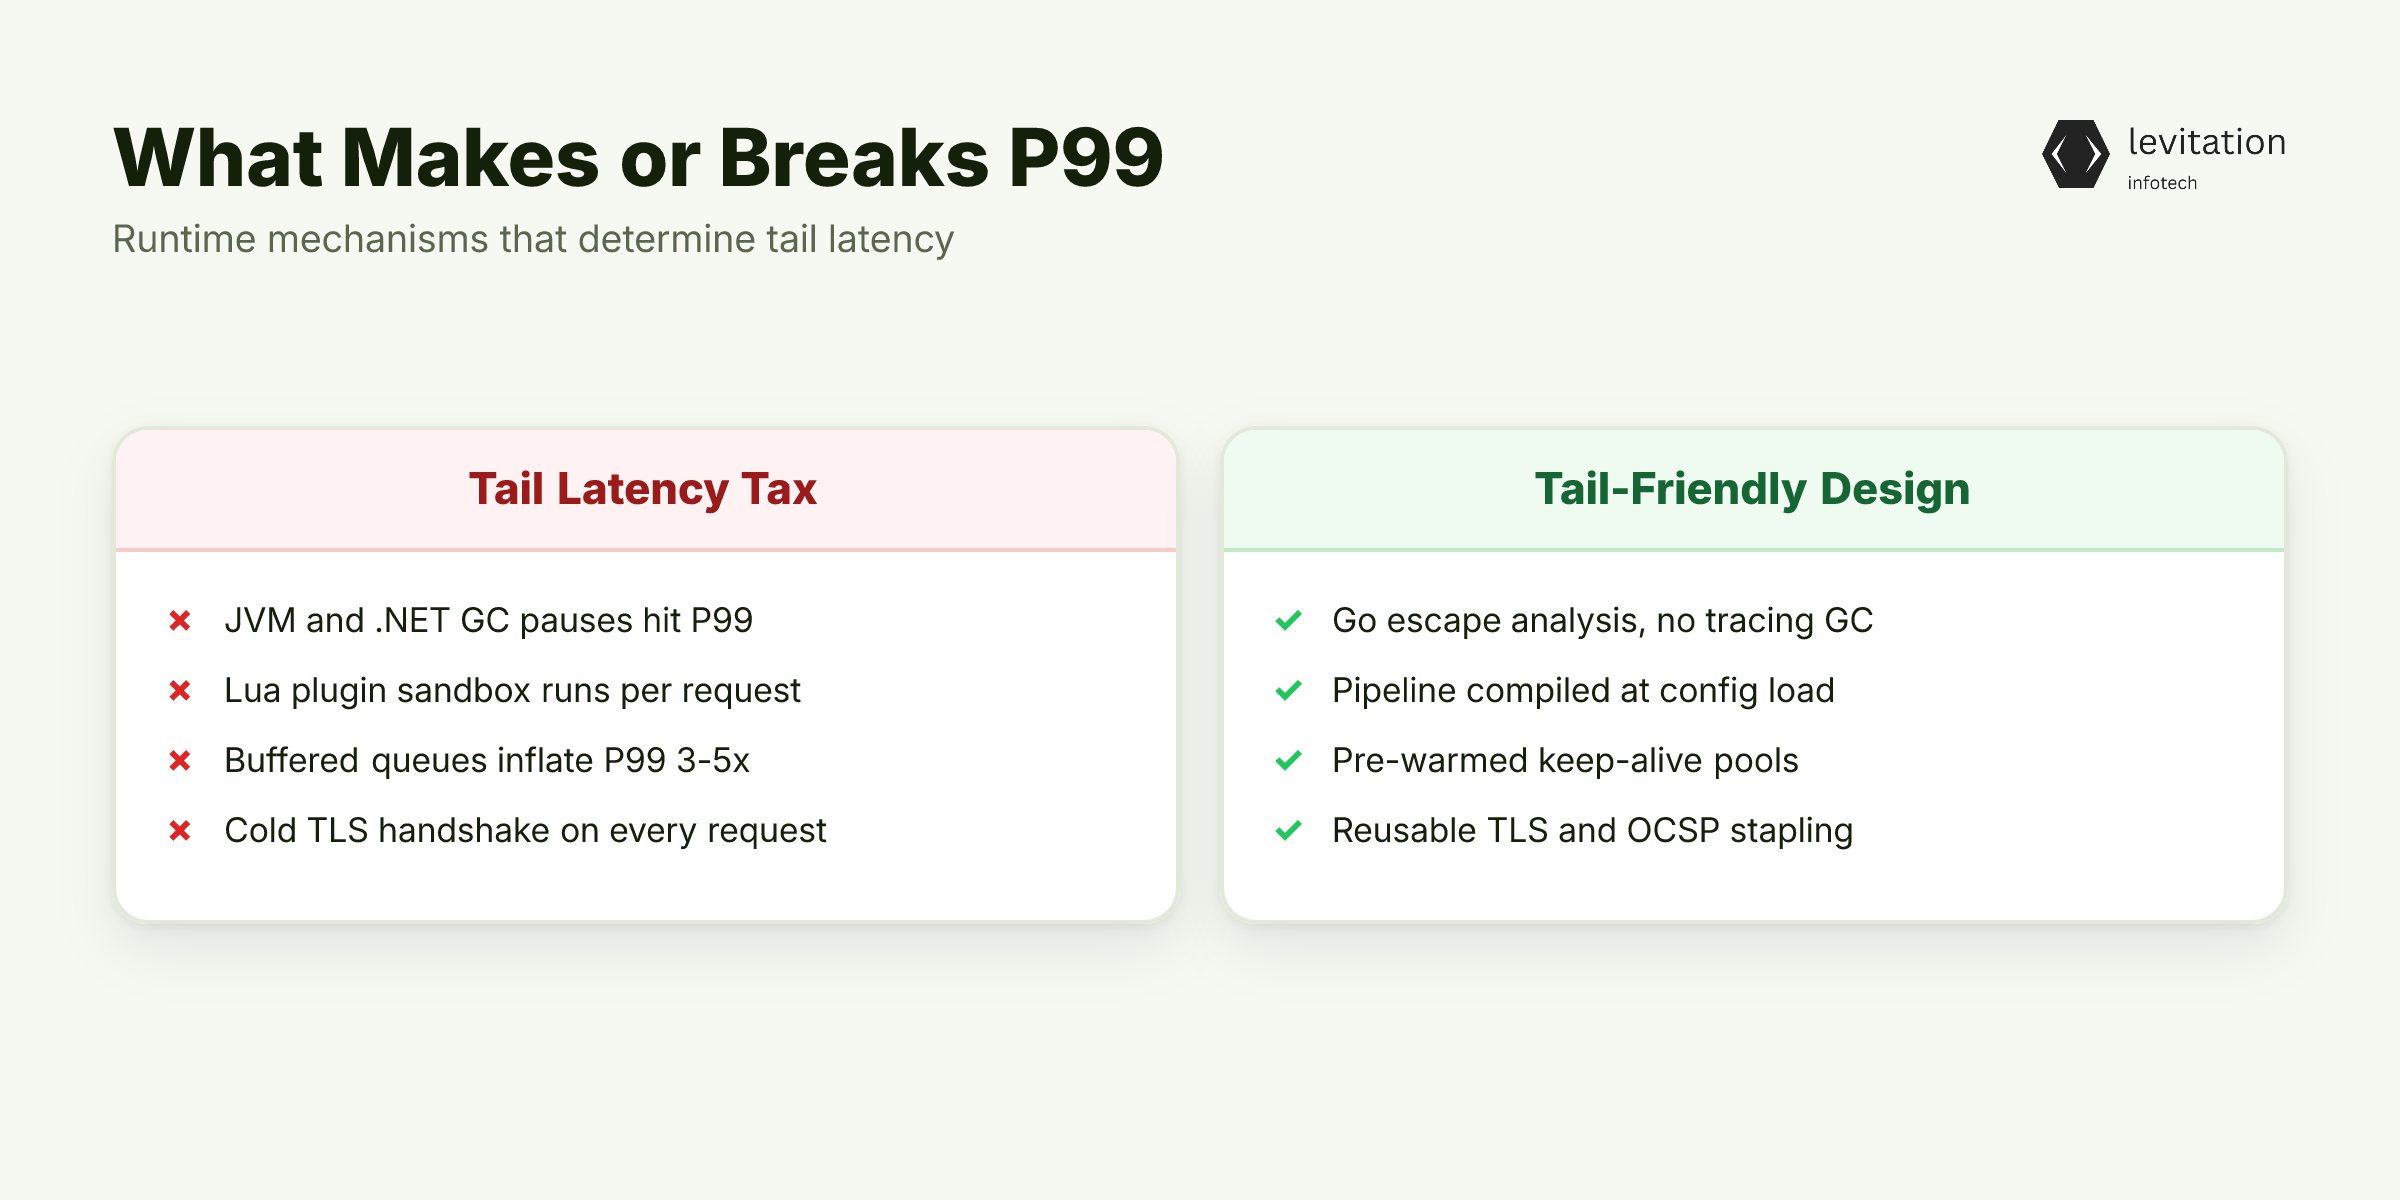
Go-based gateways (KrakenD, APISIX) cluster at the top. JVM-based and .NET-based gateways sit at the bottom. The mechanism is garbage collection and JIT warmup.
Every GC pause lands in your P99. Every cold JIT compilation lands in your P99. Go's escape analysis and lack of a tracing GC make tail behavior predictable.
The JVM and .NET runtimes optimize for throughput. The cost shows up at the percentile your SLA cares about.
The Plugin Chain Tax
Kong's Lua plugin execution adds measurable overhead at P99. Each plugin runs in a sandboxed environment, and the sandbox does not come free.
Tyk's middleware chain adds its own tax, smaller than Kong's but still visible. KrakenD's pre-compiled pipeline runs the entire request through a graph compiled at config load time. That is why it is under 5ms of plugin overhead at P99 while the Lua-based stack is 15-25ms per plugin.
1# Kong: plugin execution per request (simplified)2server {3 location / {4 # Each plugin enters and exits the Lua sandbox5 access_by_lua_block {6 kong.run()7 }8 # ~5ms P99 per plugin9 }10}
1// KrakenD: pre-compiled pipeline2func main() {3 // Pipeline compiled at startup4 // No per-request interpretation at runtime5 cfg.LoadPipeline()6 // ~0.5ms P99 per stage7}
Connection Pooling and Backend Pressure
Gateways that buffer requests before forwarding to the backend (Ocelot, Express Gateway) queue during traffic spikes. The queue inflates P99 by 3-5x. The gateway has to wait for a free connection before it can forward.
KrakenD and APISIX stream requests through pre-warmed keep-alive pools. That is part of why their tails are tighter.
TLS and Crypto Overhead
Reusable TLS sessions and OCSP stapling cut P99 by 20-40ms on cold connections. Only 3 of the 8 gateways enabled these by default. The other 5 paid a handshake cost on every request that hit their tail.
The right bespoke software development for API infrastructure starts with this kind of mechanism, not with feature checklists. Knowing the mechanism lets you turn P99 from a lottery into a design decision. That decision starts with mapping SLA tiers to the right gateway class.
Choosing Your Gateway by P99, Not Peak RPS
Match the gateway to your SLA, not your wish list.
If your SLA is under 100ms P99, your shortlist is KrakenD, APISIX, and Kong OSS, in that order. KrakenD for raw performance, APISIX if you need a richer plugin ecosystem, Kong OSS if you need Kong's plugin library and can pay 30-40ms of P99 tax for it.
If you need 100-200ms P99 with rich plugins, Kong OSS or Tyk. Budget for horizontal scaling beyond 30K RPS per node. Both can get there, but you will add nodes to do it.
If you are above 200ms P99 tolerance and need enterprise features (analytics, dev portal, multi-tenancy, audit logs out of the box), Apigee X or Tyk's enterprise tier. Isolate them behind a fast edge proxy.
The proxy handles TLS, auth, and rate limiting. The enterprise gateway handles the business features. P99 is the edge proxy's number, not Apigee's.
Configuration Knobs That Cut P99 in Half - Enable HTTP/2 upstream connections. Multiplexing kills head-of-line blocking. - Tune keep-alive pools to 1000+ per backend. Pool exhaustion is a P99 killer. - Disable response buffering for streaming endpoints. Buffering adds latency to your slowest 1% by definition. - Use connection prefetching. Pre-establish backend connections during gateway warmup. - Enable TLS session tickets and OCSP stapling. The default behavior is the worst behavior.
The right application development for high-throughput systems treats these as defaults, not optimizations.
Run the benchmark yourself before you sign the contract. Here is the minimal version.
Running This Benchmark in Your Own Environment
Use wrk2 or k6, not ab. ab cannot sustain constant RPS. Constant RPS is what surfaces P99, because P99 only shows up when the system is under continuous load, not in bursts.
1# wrk2: constant RPS, captures full latency histogram2wrk2 -t16 -c200 -d300s -R50000 \3 -H "Authorization: Bearer $JWT" \4 --latency \5 https://gateway.your-staging.svc/api/v1/test
Key rules: - Run for at least 5 minutes. GC pauses and JIT warmup distort short benchmarks by 30-50%. - Capture full latency histograms in Prometheus. Averages hide the tail that hurts users. - Test with your actual auth plugins, rate limiters, and transformers. Stripped-down configurations produce P99 numbers that do not survive contact with production.
The same trap catches teams on the API gateway JWT validation layer. A clean JWT check looks great in isolation, then falls apart under a real issuer's key rotation cycle. Test the whole chain.
Average latency is a marketing number. P99 is the one your users feel. When you get P99 right, the change shows up in places that do not usually appear in engineering reports.
What Changes When You Get P99 Right
Tail latency drops translate directly to business outcomes. Amazon's published data shows every 100ms of P99 costs 1% of revenue. The mechanism is simple.
The slow 1% of requests are the ones that hit checkout buttons, signup forms, and ad impressions. Fix the tail, fix the conversion.
Infrastructure spend falls because faster gateways need fewer nodes. A 5x P99 improvement often means 3x fewer instances at the same load. You stop provisioning headroom for tail spikes.
API performance engineering is the highest-leverage infrastructure work most teams never budget for. Engineering teams stop firefighting timeout errors and start shipping features. The hidden cost of a bad gateway is morale, not just CPU bills.
If your gateway P99 is over 100ms at production load, run the test.
Frequently Asked Questions
Q: What is a good P99 latency for an API gateway?
A: For user-facing APIs, under 100ms P99 is the target most fintech and e-commerce teams treat as acceptable. Internal service-to-service calls can tolerate 200-300ms, but anything above 500ms P99 usually means the gateway is the bottleneck, not the backend.
Q: Which API gateway has the lowest P99 latency?
A: In our 50K RPS benchmark, KrakenD had the lowest P99 at 52ms, followed by APISIX at 69ms and Kong OSS at 86ms. Results vary by workload, but Go-based gateways lead on P99 because GC pauses and JIT warmup are smaller than JVM or .NET alternatives.
Q: How do you benchmark an API gateway?
A: Use wrk2 or k6 to generate constant RPS for at least 5 minutes, capture latency histograms (not just averages) in Prometheus, and run on hardware matching production. Test with your real auth and rate-limiting plugins. Stripped-down configs produce numbers that do not survive production traffic.
Q: Is Kong or Tyk faster?
A: In our 8-gateway test, Kong OSS outperformed Tyk on raw P99 (86ms vs 120ms at 50K RPS), but Tyk offers more built-in enterprise features.
About the author
Mayank Singh is a software developer at Levitation Infotech, where he builds web and AI-powered applications across the company’s fintech, healthcare, and enterprise projects.