


TL;DR: A 99% Redis cache hit rate tells you almost nothing about how fast your system feels. Hit rate is a ratio, not a time measurement. Four mechanisms add tens to hundreds of milliseconds to every successful GET. The fix: alert on tail latency percentiles, not hit rate. Then run a focused four-step audit on your production host.
Key Takeaways: - Hit rate and p99 latency are independent dimensions of cache health. One can be excellent while the other is broken. - Redis runs commands on a single thread. Any stall in the event loop delays every queued hit behind it. - The four latency bombs (fragmentation, eviction, fsync, client overhead) are invisible to the hit counter. They show up in `INFO memory`, `INFO commandstats`, and `LATENCY` output. - Alert on p99 latency in milliseconds, not on hit rate percentages. Percentiles map directly to user pain. - A 4-step production audit (intrinsic latency floor, commandstats profile, fragmentation check, latency-distribution pass) catches what the dashboard misses.
Your 99% Hit Rate Is a Vanity Metric
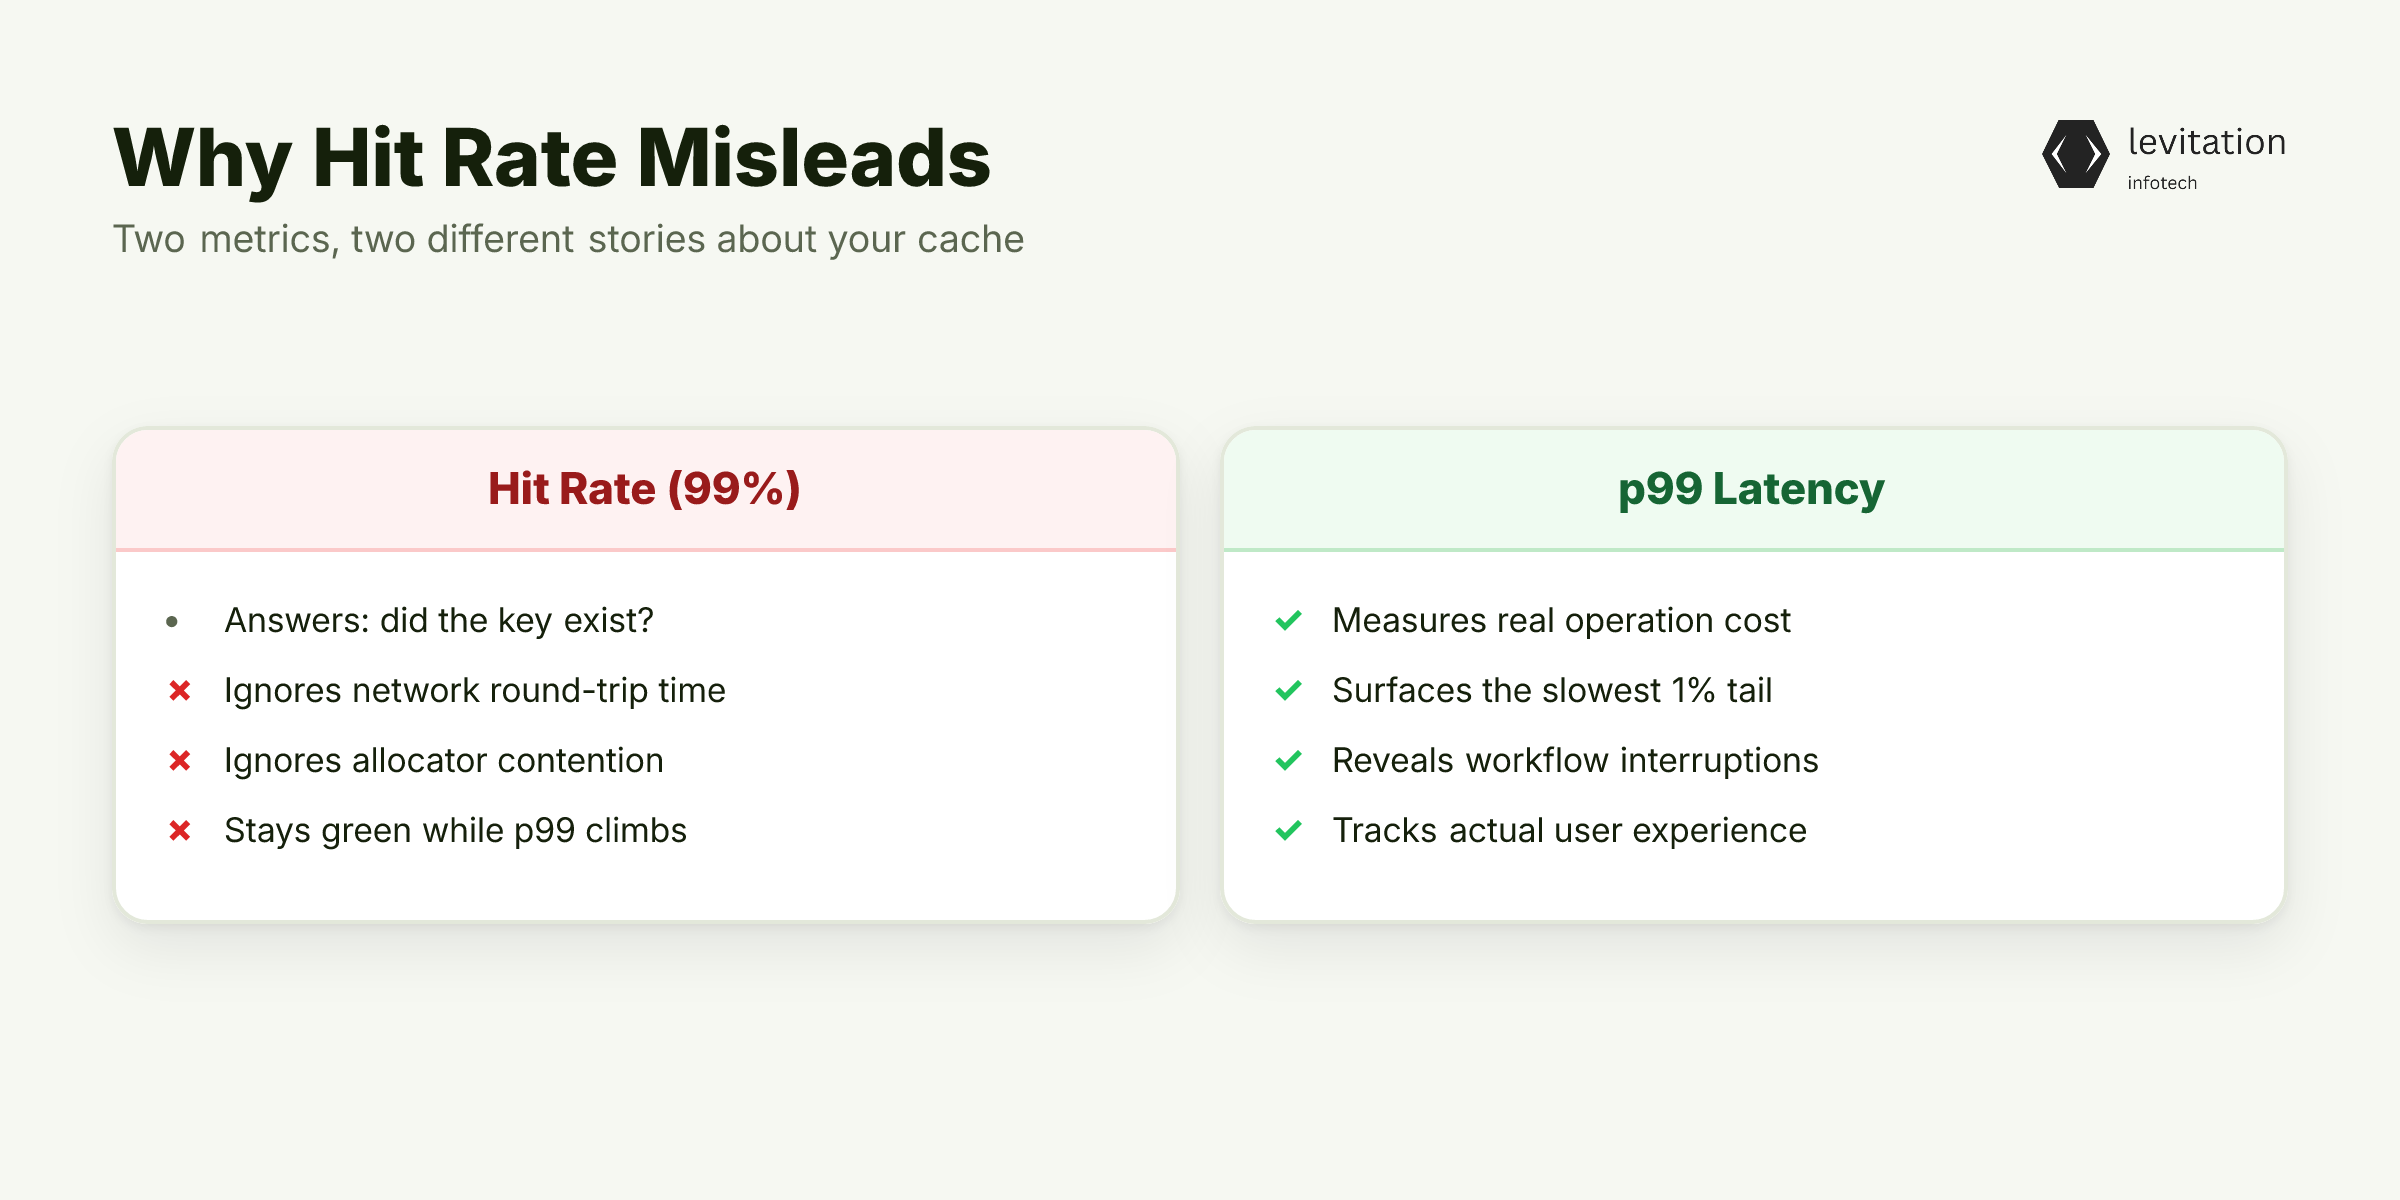
Your Redis dashboard says 99% hit rate. Your p99 latency is 800ms. The metric that's supposed to prove your cache is working is the same one letting you ship a slow system.
Hit rate is the ratio of cache hits to total requests. It answers one question: did the key exist. It does not measure how long the operation took. It does not measure what the network round-trip added. It does not measure whether the allocator was fighting itself when your request arrived.
A 99% hit rate can coexist with 200ms p99. The two metrics live in different panels and describe different failure modes. This matters much more in latency-sensitive workflows.
Clinician-facing dashboards and patient lookup systems show this clearly. Every millisecond is a workflow interruption, not a UX nicety. A doctor waiting 800ms for a patient record between two clicks is a doctor who starts to avoid the system entirely. The cache is "hitting" successfully. The clinician is still paying the cost.
The same pattern shows up across industries. Hit rate climbs as the team adds TTLs and pre-warms keys. p99 climbs with it. Dashboards still look green because the two metrics sit on different charts, and nobody connects them. The aggregate looks healthy. The slowest 1% of users are suffering. Tail latency is the metric that user experience actually lives in, and it is the metric hit rate cannot see.
If you want a baseline for what healthy looks like, start with a proper Redis performance baseline so you can compare today's numbers against something defensible.
But the problem runs deeper than aggregate metrics. Even when a "hit" is correctly classified, the operation can still be the slowest part of your request path.
Why Cache Hits Aren't Created Equal
A "hit" only tells you the key existed. It does not record serialization cost, network RTT, connection-pool wait time, or whether Redis had to evict another key to serve this one. The hit counter is a yes-or-no flag. Yes-or-no flags cannot represent a continuous distribution of response times.
Redis processes each command sequentially on a single-threaded event loop. The moment one operation stalls, every queued command behind it stalls too. The blocked time shows up as latency for every concurrent request, even the clean ones with no overhead of their own.
This is why two systems with identical 99% hit rates can have wildly different p99 distributions. The single-thread model means stalls are contagious. Hit rate cannot see this link.
Teams that chase hit rate optimize for the wrong ceiling. They add caching layers, raise TTLs, or pre-warm keys. The actual user-facing tail gets worse. The work that improves tail latency (smaller values, better serialization, sharded keys, defragmentation) rarely shows up as a hit rate change. You can fix a 500ms p99 down to 5ms and your hit rate might move from 99.2% to 99.2%.
The fix starts with cache key design that keeps values small and bounded. Small values serialize fast, evict fast, and survive fragmentation without dragging the event loop.
Four mechanisms cause the problem. They hide behind every successful GET you serve.
The Four Latency Bombs Hiding Behind Every Hit
Every cache hit you serve is the output of four systems. These are the allocator, the eviction engine, the persistence layer, and the client stack. Each one can add latency to a successful GET without changing the hit count.
Memory fragmentation. When `used_memory_rss` exceeds 1.5x `used_memory`, the Redis process has more resident memory than its logical data set. This happens because the allocator cannot return freed pages to the OS. Every `malloc` and `free` now walks a fragmented heap. Each operation adds microseconds. Those microseconds compound into p99 spikes. The classic memory fragmentation ratio signal is `used_memory_rss / used_memory > 1.5`.
Eviction storms. A `maxmemory-policy` eviction can block the event loop while it scans and removes keys. The blocked time shows up as latency for every concurrent request, even clean hits. This is one of the known failure modes in eviction policies compared. When working set exceeds memory, eviction becomes a synchronous operation on the single thread.
AOF and RDB fsync. Every background save triggers an `fdatasync`. This can take milliseconds to seconds if another process is doing disk I/O on the same host. That pause is invisible to the hit counter. Under disk pressure, `fdatasync` can range from a few milliseconds to a few seconds. The single-threaded event loop pauses, stalling every queued command. Your hit count is unaffected. Your p99 is not.
Client-side overhead. TLS handshakes, AUTH round trips, connection pool exhaustion, and serialization (JSON, MessagePack, custom encoders) all add latency to the hit path. A hit becomes slow when a large serialized value round-trips through multiple middleware layers. Each layer adds serialization, parsing, or network cost. None of this changes the hit count. All of it changes the user experience.
These are the mechanisms. The default `INFO` output won't surface them without deliberate setup.
Command-Level Diagnostics: What to Run Before You Tune Anything
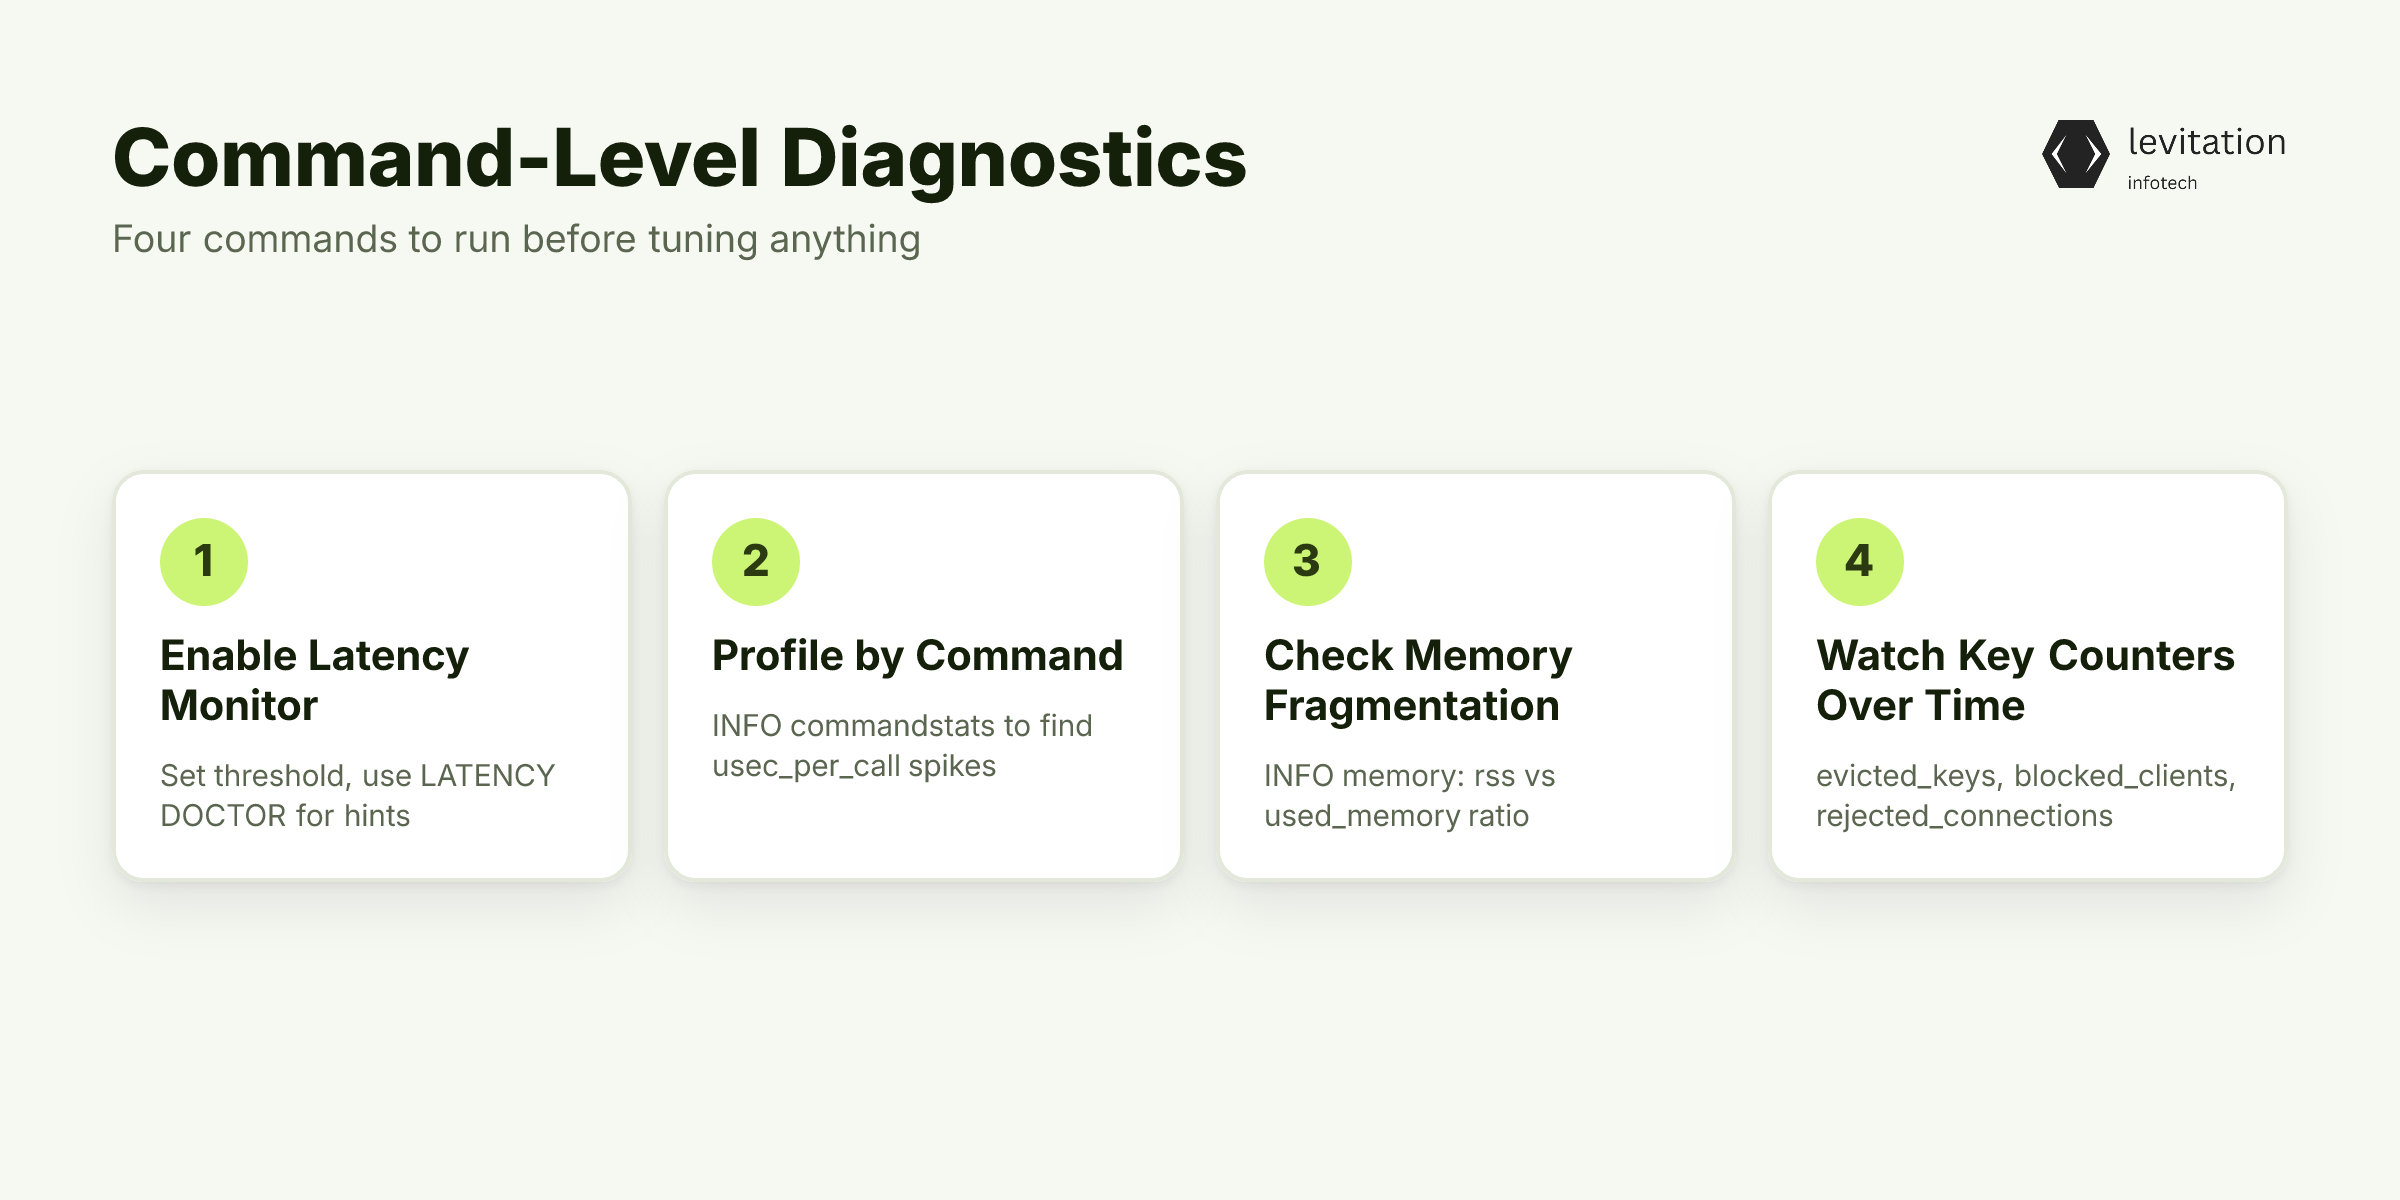
Before you change a single config flag, capture the signals that tell you where time is going. Four commands cover most of the surface.
First, enable latency monitoring. The subsystem is off by default.
1CONFIG SET latency-monitor-threshold 100
This threshold is in milliseconds. Any event the server considers "slow" (above 100ms by default) gets recorded. The full Redis LATENCY command reference covers `LATENCY HISTORY`, `LATENCY LATEST`, and `LATENCY DOCTOR`. Doctor is underrated: it suggests which subsystem to investigate based on the spike pattern.
Second, profile by command. `INFO commandstats` returns `calls`, `usec`, and `usec_per_call` broken down by command type. A sudden jump in `GET usec_per_call` is the smoking gun for serialization or network overhead. The full breakdown lives in the INFO commandstats interpretation walkthrough.
Third, check fragmentation directly. `INFO memory` gives you `used_memory` and `used_memory_rss` side by side. The math is the same one Azure documents. If `rss` is more than 1.5x `used_memory`, your allocator is under pressure. Every allocation is paying a tax.
Fourth, watch the right fields over time: - `evicted_keys` rising means your working set is too big for memory - `blocked_clients` rising means stuck `BLPOP` calls are queueing - `rejected_connections` rising means your client pool is exhausted - `instantaneous_ops_per_sec` near your saturation ceiling means Redis is the bottleneck
For real-time distribution, `redis-cli --latency-dist` shows the actual spread of command RTTs, not the average. Most teams never run it. The ones who do find their p99 hiding in the long tail of the histogram. The numbers those teams pull rarely match the story their dashboards have been telling.
Diagnostics tell you where the time is going. The harder question is which numbers actually matter when you set alerts and SLOs.
Measuring Tail Latency: The p50-to-p999 Story
p50 is the worst metric to alert on for a cache. A cache doing its job should have p50 under 1ms. Half your alerts will never fire even when users are suffering. The signal lives in p95, p99, and p99.9.
The gap between p50 and p99.9 is your "latency budget collapse." It grows nonlinearly under load. A system with 0.5ms p50 and 50ms p99.9 has a 100x tail. A system with 0.5ms p50 and 5ms p99.9 has a 10x tail. Same hit rate. Completely different user experience.
The mechanics are simple: p50 is dominated by the network. p99.9 is dominated by everything that can go wrong once in ten thousand requests.
Baseline intrinsic latency first. `redis-cli --intrinsic-latency 100` tells you the floor your system can theoretically achieve. It is measured by spinning a no-op syscall loop for 100 seconds. Anything above that floor is your code, your network, or your configuration. The official Redis docs show this command producing microsecond-level readings on healthy hosts and millisecond-level readings on virtualized or contended ones.
Set SLOs in latency percentiles, not hit rate. A cache should be measured by "99% of GETs return in under 5ms," not by "99% of requests are hits." The first is a contract you can alert on. The second is a number that trends up no matter what you break. The reasoning is straightforward: SLO design for caches only works when the SLO describes time, not count.
Wire p99 alerting patterns into your observability stack. Regressions should page on the same hour they happen, not the next morning when someone notices the dashboard.
Measurement sets the stage. The audit sequence turns these diagnostics into a repeatable practice your team can run every sprint.
A 4-Step Production Latency Audit You Can Run This Week
A focused audit takes under an hour and surfaces the failures that hit rate hides.
Step 1: Baseline the host. Run `redis-cli --intrinsic-latency 100` on the production host. If the floor is already 1ms, the host is the problem before Redis is. Common culprits: noisy neighbors on shared virtualization, NUMA misplacement, kernel scheduler pressure. Fix the host first.
Step 2: Profile by command. Capture `INFO commandstats` under realistic load for 10 minutes. Sort by `usec_per_call` descending. The top three commands are your optimization targets. A `GET` measured in microseconds is healthy. A `GET` in the millisecond range signals serialization, network, or pool exhaustion. A `GET` in tens of milliseconds is allocator pain.
Step 3: Fragmentation check. Compare `used_memory` to `used_memory_rss`. If `rss > 1.5x used_memory`, schedule a controlled restart or enable `activedefrag`. The right activedefrag configuration uses a narrow time window so defragmentation doesn't compete with live traffic. Document the recovery time so you know the cost before you schedule it.
Step 4: Tail latency pass. Run `redis-cli --latency-history` over a 15-minute window, then `--latency-dist`. Export to your observability stack and set p99 alerts at 2x your baseline. Hit rate stays in the dashboard as a sanity check. Latency gets paged on. The full production Redis audit checklist has the command-by-command sequence and the thresholds worth alerting on.
This is the discipline that earns long-term trust. Teams that explain incidents after the fact lose credibility. Teams that prevent 3am pages earn it.
The teams that make this shift stop treating hit rate as a success metric and start treating it as a sanity check. In practice, the change shows up in how teams plan, alert, and respond.
What Changes When You Replace Hit Rate with Tail Latency
Capacity planning gets honest. A 99% hit rate at 2ms p99 is very different from a 99% hit rate at 200ms p99, even though the dashboard treats them identically. The first can absorb load. The second will collapse the moment traffic doubles.
User-facing SLOs become enforceable. "p99 cache read under 10ms" is a contract you can alert on. "99% hit rate" is a number that hides the damage you just shipped. The conversation shifts from "is the cache warm?" to "why is the slow path slow?". That second question is the one that improves systems.
In enterprise AI systems where low-latency inference is critical, this discipline is non-negotiable. Every cache miss in a retrieval-augmented generation pipeline is a user-visible stall. RAG pipeline performance is gated by tail latency, not by document count.
The low-latency AI infrastructure that backs these workloads treats percentile targets like a database treats durability. Both are non-negotiable, measured continuously, and alerted on immediately.
Hit rate is not useless. It is a useful slow-moving diagnostic that tells you whether your working set fits in memory. It is not a performance metric. Stop alerting on it. Start alerting on the time your users actually wait.
Frequently Asked Questions
Does a high Redis cache hit rate guarantee low latency?
No. Hit rate only measures whether the key was found, not how long the operation took. A 99% hit rate can coexist with 800ms p99 latency. Serialization, network RTT, or memory fragmentation can all add overhead to every request.
What is a healthy p99 latency for Redis?
For a simple GET/SET on a local network with no persistence, p99 should sit well below 10ms. With AOF persistence or cross-AZ networking, the floor rises. Anything well above the baseline on a simple command indicates a configuration or host-level problem worth investigating.
How do I measure Redis tail latency directly from the CLI?
Use `redis-cli --latency` for a rolling average. Use `--latency-history` for a time series you can graph. Use `--latency-dist` to see the distribution of RTTs. For event-level spikes, enable latency monitoring with `CONFIG SET latency-monitor-threshold 100`. Then query `LATENCY HISTORY` and `LATENCY DOCTOR`.
What causes Redis latency spikes even when the hit rate is stable?
The four causes are memory fragmentation, eviction storms, fsync pauses, and client-side overhead. Memory fragmentation happens when `used_memory_rss` exceeds `used_memory`. Eviction storms block the single-threaded event loop, and AOF or RDB fsync pauses come from background saves. Client-side overhead comes from TLS, serialization, or pool exhaustion. Each cause is invisible to the hit rate metric.
Should I alert on cache hit rate or cache latency?
Alert on latency, specifically p95 and p99. Hit rate is a slow-moving diagnostic that trends up with time. It almost never pages in time. Latency percentiles catch regressions the same hour they happen and map directly to user experience.
About the author
Mayank Singh is a software developer at Levitation Infotech, where he builds web and AI-powered applications across the company’s fintech, healthcare, and enterprise projects.