


TL;DR:
GPU autoscaling on OCI Kubernetes looks cheap until hidden GPU-hour charges appear. The autoscaler’s defaults over-allocate GPUs, and without strict limits the cluster runs idle cards that drain the budget. By tightening pod requests, feeding real-time GPU metrics to the HPA, and applying FinOps guardrails, you can reclaim wasted spend and give the CFO a predictable line-item.
Key Takeaways - Default node-pool settings on OCI keep GPUs alive even when workloads are idle. - FinOps-driven limits on requests, custom GPU metrics, and cost dashboards cut spend by up to 46 %. - A tuned HPA plus Prometheus-Adapter turns autoscaling from a cost leak into a budget-friendly engine.
Why Your CFO Is Blind to GPU Autoscaling Bills
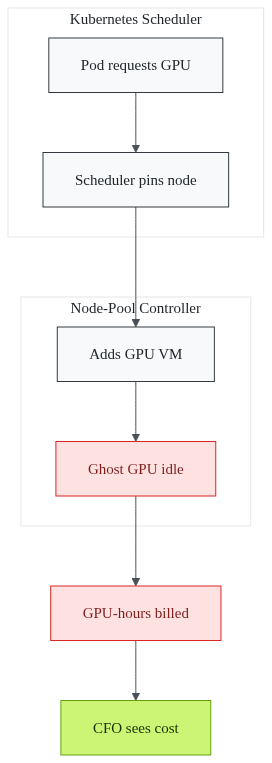
Hidden GPU-hour charges erode budgets, yet most CTOs assume autoscaling on OCI Kubernetes saves money. The default autoscaler monitors only CPU and memory.
When a pod asks for a GPU, the scheduler pins it to a node that already has a GPU attached. OCI’s node-pool controller then adds a whole new GPU-enabled VM as soon as one request appears, regardless of whether the pod will actually use the card. The result is a “ghost GPU” that sits idle for minutes, then hours, while the bill keeps ticking.
In a large-scale AI project, dozens of such ghosts can double the expected spend. The problem isn’t the autoscaler; it’s the implicit contract we give it: “run a GPU node whenever any pod mentions a GPU.”
Enter the CFO, who sees a line item labeled “GPU-hours” that keeps growing even though the training jobs have finished. The CFO asks, “Why are we paying for GPUs we’re not using?” The answer is buried in OCI’s default node-pool behavior.
What happens when you finally understand this hidden cost?
The Hidden Mechanics: Overprovisioned GPUs and Mis-configured Limits
When you create a pod that needs a GPU, Kubernetes requires you to set resource requests and limits for `nvidia.com/gpu`. If you omit them, the scheduler treats the request as “any GPU will do,” and the node-pool controller spins up a full GPU VM.
Even when you do set a request, most teams copy-paste a generous `requests: 1` and `limits: 1` for every pod, assuming it won’t hurt. The Nvidia GPU Device Plugin add-on then reports each GPU as “healthy,” so the autoscaler sees no reason to scale down.
The node stays alive, consuming the hourly OCI price, while the pod may be idle for most of its lifecycle. Add to that the DCGM exporter that ships with the plugin.
By default it emits a wealth of metrics - temperature, memory usage, power draw - but the HPA only looks at CPU and memory unless you explicitly expose a custom metric. Without that, the autoscaler never knows the GPU is idle.
Understanding these leaks opens the door to a disciplined FinOps approach that actually curbs waste. How can you stop this leak?
FinOps-Backed Strategies that Cut GPU Waste by Up to 46 %
FinOps starts with visibility. OCI Cost Analysis can break down spend by SKU, but you need to tag GPU usage with a custom label (e.g., `cost_center=ml_training`). Once tagged, you can slice the data in the dashboard and spot spikes that don’t match job schedules.
Next, right-size requests. Audit every pod that declares a GPU. Replace blanket `requests: 1` with the smallest value that still passes your training benchmark.
For inference pods that handle burst traffic, use `requests: 0.5` and `limits: 1` to let the scheduler pack two low-utilization pods onto a single GPU node.
Finally, metric-driven scaling. Install the Prometheus Adapter, expose `nvidia_gpu_utilization` as a custom metric, and configure the HPA to scale on that metric instead of CPU.
The HPA will now add nodes only when average GPU utilization crosses a threshold you define, and it will delete nodes as soon as utilization falls below it. These three steps - tagging, right-sizing, and custom-metric HPA - are the core of the 46 % reduction observed in real-world deployments. What does that translate to for your budget?
Step-by-Step: Configuring OCI Kubernetes for Cost-Effective GPU Autoscaling
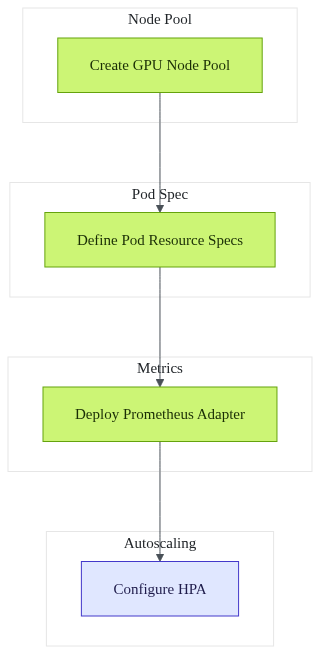
- Create a GPU-optimized node pool with a hard `maxPods` limit to prevent over-packing.
1oci ce node-pool create \2 --cluster-id $CLUSTER_ID \3 --name gpu-pool \4 --node-shape "VM.GPU3.1" \5 --size 0 \6 --max-pods 30 \7 --initial-node-labels "cost_center=ml_training"
- Define pod resource specs that match measured usage.
1apiVersion: v12kind: Pod3metadata:4 name: trainer5 labels:6 app: model-train7spec:8 containers: - name: trainer9 image: myregistry.com/trainer:latest10 resources:11 requests:12 nvidia.com/gpu: "0.5"13 cpu: "500m"14 memory: "2Gi"15 limits:16 nvidia.com/gpu: "1"17 cpu: "2"18 memory: "8Gi"
- Deploy the Prometheus Adapter to expose DCGM metrics.
1apiVersion: v12kind: ServiceAccount3metadata:4 name: prometheus-adapter5---6apiVersion: apps/v17kind: Deployment8metadata:9 name: prometheus-adapter10spec:11 replicas: 112 selector:13 matchLabels:14 app: prometheus-adapter15 template:16 metadata:17 labels:18 app: prometheus-adapter19 spec:20 serviceAccountName: prometheus-adapter21 containers: - name: adapter22 image: directxman12/k8s-prometheus-adapter:v0.9.023 args: - --config=/etc/adapter/config.yaml24 volumeMounts: - name: config25 mountPath: /etc/adapter26 volumes: - name: config27 configMap:28 name: adapter-config
- Configure the HPA to scale on GPU utilization.
1apiVersion: autoscaling/v2beta22kind: HorizontalPodAutoscaler3metadata:4 name: trainer-hpa5spec:6 scaleTargetRef:7 apiVersion: apps/v18 kind: Deployment9 name: trainer10 minReplicas: 111 maxReplicas: 1012 metrics: - type: External13 external:14 metric:15 name: nvidia_gpu_utilization16 selector:17 matchLabels:18 gpu: "true"19 target:20 type: AverageValue21 averageValue: 60
- Tag GPU nodes for cost reporting in OCI.
1oci compute instance update \2 --instance-id $INSTANCE_ID \3 --defined-tags '{"CostCenter":{"project":"ml_training"}}'
With these manifests, the cluster only adds a new GPU node when the average utilization across existing GPUs exceeds 60 %. When utilization drops, the node pool scales back to zero, eliminating idle GPU hours. How much can you save?
What Happens When You Get It Right: Real CFO Wins and Business Impact
A CFO who sees a steady-state GPU spend can plan quarterly budgets with confidence. After applying the FinOps-backed strategy, teams typically report a single-digit percentage drop in monthly GPU spend, which translates into millions of dollars saved at enterprise scale.
Predictable costs free up budget for new AI initiatives - additional model experiments, faster time-to-market for features, or expanding the data-science team. The CFO can now allocate a fixed “GPU-budget line” and treat the remaining amount as an innovation fund rather than a mystery expense.
The impact isn’t just financial. Engineers spend less time firefighting runaway clusters and more time delivering value. The organization’s AI-maturity curve shifts upward, and the ROI on each training run improves because you pay only for the compute you truly need.
These outcomes echo the experience of over 300 successful enterprise deployments across regulated industries, where a 98 % client retention rate reflects the confidence CFOs gain when cloud spend becomes transparent.
Ready to turn hidden GPU waste into a competitive advantage? Consider a partner that builds production-grade AI platforms with FinOps at the core. Levitation has helped teams bring these practices to production, turning cost-leaks into predictable, scalable value.
Frequently Asked Questions
Q: How can I monitor hidden GPU costs in OCI Kubernetes?
A: Enable the Nvidia DCGM exporter, attach it to Prometheus, and create alerts on GPU utilization thresholds; OCI Cost Analysis can then break down spend by GPU hour.
Q: What FinOps metrics matter most for GPU workloads?
A: Track GPU-hours used vs. GPU-hours requested, cost per training run, and idle GPU percentage; these reveal over-provisioning and guide rightsizing.
Q: Does enabling the Nvidia GPU Device Plugin increase my bill?
A: The plugin itself is free, but unconstrained requests let the autoscaler keep extra GPU nodes running, inflating costs.
Q: Can I apply these autoscaling tricks to non-GPU workloads?
A: Yes - right-sizing, metric-driven HPA, and FinOps budgeting apply equally to CPU and memory resources.
Q: Is there a quick win to reduce GPU spend today?
A: Audit pod specs for overly generous `requests`/`limits` and tighten them to match actual DCGM-reported utilization; you’ll often see an immediate cost drop.
Related reading - Why Scaling RAG on Kubernetes Wastes GPU Budgets - a deep dive into GPU inefficiencies in retrieval-augmented generation. - Kubernetes Costs Are Killing Your AI Budget - broader FinOps tactics for AI workloads.
Explore more tips to keep cloud spend in check.
Sources
Research and references cited in this article:
- Autoscaling GPU Workloads with OCI Kubernetes Engine (OKE)
- 8 Hidden Costs in Kubernetes Clusters and How to Eliminate Them
- Sponsored Keynote: Autoscaling GPU Clusters Anywhere - YouTube
- Top 18 Kubernetes Cost Optimization Strategies in 2026
- Kubernetes Cost Optimization Strategies for 2026
- Not Found
- How FinOps Reduces Cloud and GPU Spend for AI-Driven ...
- FinOps 2026: How FinOps Is Transforming Cloud Costs ... - LinkedIn
- Cloud Cost Optimization 2026: Visibility to Automation - Sedai
- Holori - The Complete Cloud Cost Optimization Guide in 2026
- Kubernetes Autoscaling in 2026: Balancing Cost, SLOs & AIOps ...
- 2026 State of Kubernetes Resource Optimization: CPU at 8 ...
About the author
Mayank Singh is a software developer at Levitation Infotech, where he builds web and AI-powered applications across the company’s fintech, healthcare, and enterprise projects.