


TL;DR: KEDA’s built-in scalers watch only CPU and memory, so they spin up expensive GPU nodes even when the GPU is idle. By feeding a GPU-aware metric, such as DCGM utilization or queue length, into KEDA, you stop paying for idle GPUs and keep latency steady.
Key Takeaways - KEDA’s default scalers ignore GPU utilization, leading to hidden over-provisioning. - Exporting NVIDIA DCGM metrics to Prometheus lets KEDA make decisions based on real GPU load. - A GPU-aware KEDA configuration reduces spend while preserving latency.
The Cost Mirage: Why KEDA Feels Like a Savings Tool but Isn’t
Most platform engineers love KEDA because it promises event-driven scaling to zero.
In reality, “zero” often lands on a GPU node that never does work.
KEDA delegates scaling to the Kubernetes Horizontal Pod Autoscaler (HPA).
The HPA reads metrics from the cluster’s metrics-server, which only exposes `cpu_usage_seconds_total` and `memory_working_set_bytes` unless you add custom sources.
When an inference service receives a burst of HTTP requests, the request parser runs on the CPU and pushes a spike to `cpu_usage`.
The GPU, however, stays idle while the model loads.
KEDA sees the CPU rise, the HPA decides to add a replica, and the scheduler provisions a new GPU-enabled pod.
That pod instantly incurs the per-hour GPU charge - even if the model never runs.
1apiVersion: keda.sh/v1alpha12kind: ScaledObject3metadata:4 name: inference-scaler5spec:6 scaleTargetRef:7 name: inference-deployment8 minReplicaCount: 19 maxReplicaCount: 1010 triggers: - type: cpu11 metadata:12 type: Utilization13 value: "70"
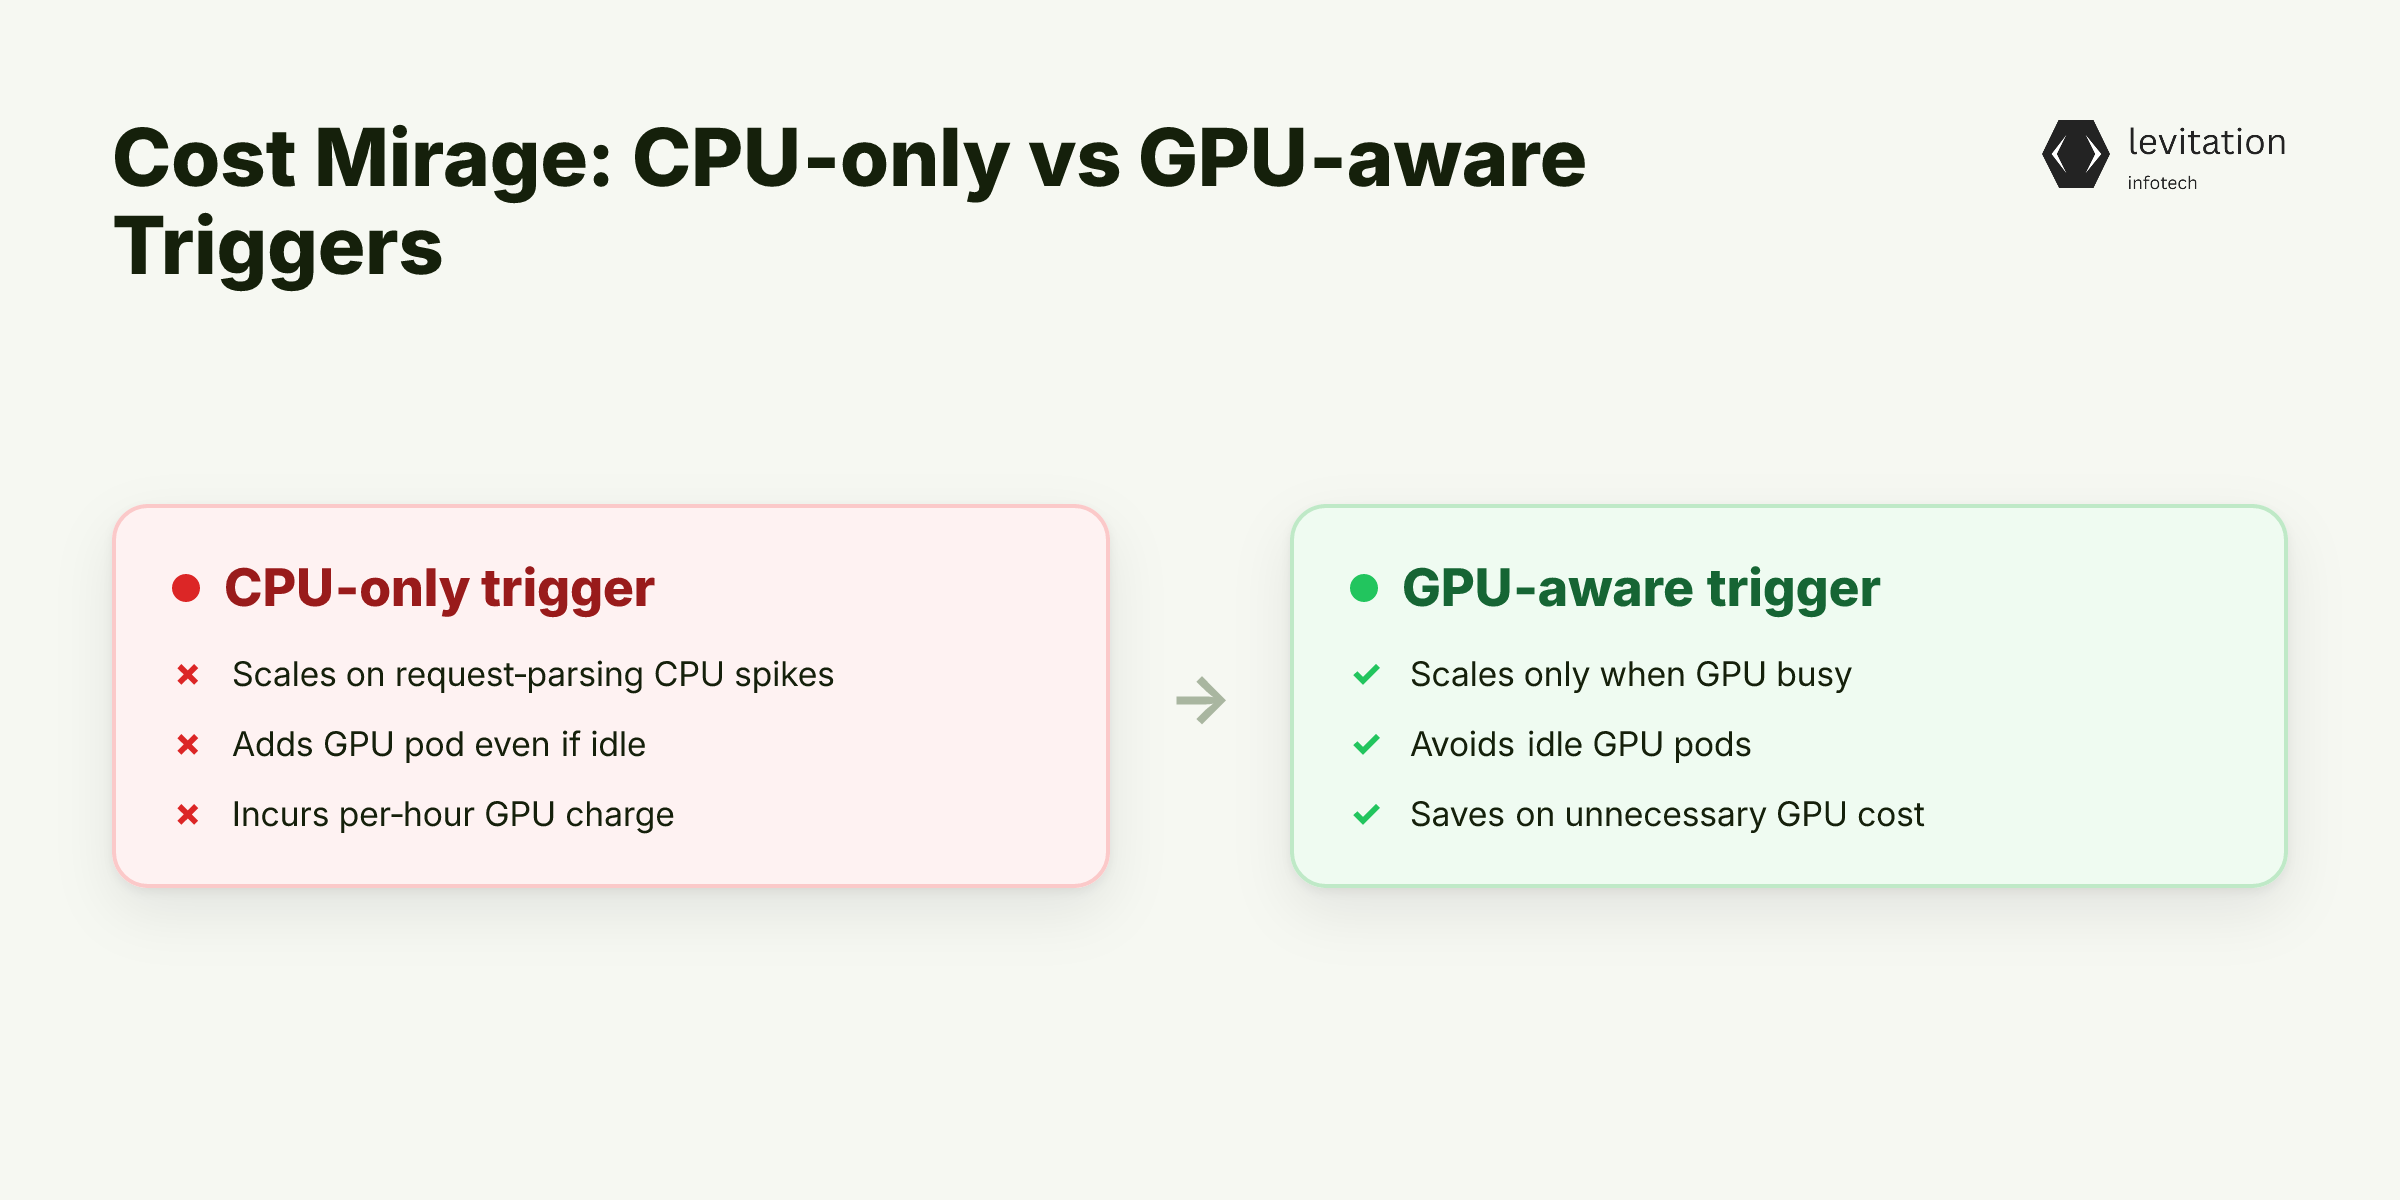
The manifest above shows the common CPU-only trigger. Replace it with a GPU-aware metric and the story flips. - CPU-only trigger - fires on request-parsing load, not on actual inference work. - GPU-aware trigger - fires only when the GPU is truly busy.
Because the default scaler never checks GPU health, you pay for idle GPUs during traffic spikes that never translate to inference work. That hidden cost is the “mirage” engineers mistake for savings, and it raises a deeper problem with CPU-only metrics.
How the HPA pulls metrics
- The HPA queries the metrics-server’s `/apis/metrics.k8s.io/v1beta1/pods` endpoint.
- It receives a JSON payload containing `cpu` and `memory` usage per pod.
- It applies the target utilization (e.g., 70 %) and decides whether to scale.
If you want the HPA to consider GPUs, you must expose a custom metric that the HPA can read. The next section explains why CPU metrics blindside GPU-heavy inference.
Why CPU-Centric Metrics Blindside GPU-Heavy Inference
Kubernetes was designed for traditional web services, not for tensor cores.
Its built-in metrics server scrapes only CPU and memory counters, which say nothing about how saturated a GPU’s compute units are.
A typical AI inference pod runs a lightweight HTTP server on the CPU and forwards payloads to the NVIDIA driver.
During a burst, the CPU may sit at 80 % while the GPU hovers at 5 %.
The CPU trigger fires, the HPA adds more pods, and you end up with a fleet of GPUs that never exceed idle thresholds.
1# Example HPA that watches CPU only2apiVersion: autoscaling/v23kind: HorizontalPodAutoscaler4metadata:5 name: inference-hpa6spec:7 scaleTargetRef:8 apiVersion: apps/v19 kind: Deployment10 name: inference-deployment11 minReplicas: 112 maxReplicas: 1213 metrics: - type: Resource14 resource:15 name: cpu16 target:17 type: Utilization18 averageUtilization: 70
The HPA above cannot see `gpu_utilization`. Without that signal, scaling decisions are based on a proxy metric that often diverges from the true cost driver.
Consequences of relying on CPU metrics: - Premature scale-out - pods appear before the GPU is needed, inflating hourly GPU spend. - Idle GPU nodes - increase the attack surface and complicate compliance audits. - Unstable latency - cold-start of GPU pods adds jitter when traffic subsides.
The mismatch is not a bug in KEDA; it’s a limitation of the metric source. Feeding GPU-centric data into KEDA closes the gap, opening the door to a smarter scaling approach.
GPU-Aware Scaling with KEDA: The Insight That Turns the Tide
The breakthrough is simple: let KEDA listen to a metric that reflects actual GPU demand.
NVIDIA’s Data Center GPU Manager (DCGM) exporter publishes `gpu_utilization` and `gpu_memory_used` to Prometheus.
By exposing those as custom metrics, KEDA can make scaling decisions that match the real bottleneck.
1apiVersion: keda.sh/v1alpha12kind: ScaledObject3metadata:4 name: gpu-inference-scaler5spec:6 scaleTargetRef:7 name: inference-deployment8 minReplicaCount: 19 maxReplicaCount: 1210 cooldownPeriod: 3011 triggers: - type: prometheus12 metadata:13 serverAddress: http://prometheus.monitoring.svc:909014 metricName: gpu_utilization15 threshold: "60"16 query: |17 sum(gpu_utilization{instance=~".*"}) / count(gpu_utilization{instance=~".*"})
The query computes the average GPU utilization across all nodes. When the average crosses 60 %, KEDA adds more inference pods; when it falls below, pods are terminated.
Couple the GPU metric with a queue-length metric so KEDA reacts early, before the GPU actually saturates. The combined trigger looks like this: - Queue length - anticipates incoming work and triggers scaling before the GPU is fully loaded. - GPU utilization - confirms that the GPU is the current bottleneck.
This dual-trigger pattern avoids the “react-too-late” problem that pure CPU triggers suffer from. The technique is described in more detail in our GPU scaling patterns guide.
Here is a battle-tested implementation you can copy today, and the next steps show how to build it.
Step-by-Step: Building a GPU-Aware KEDA Autoscaler
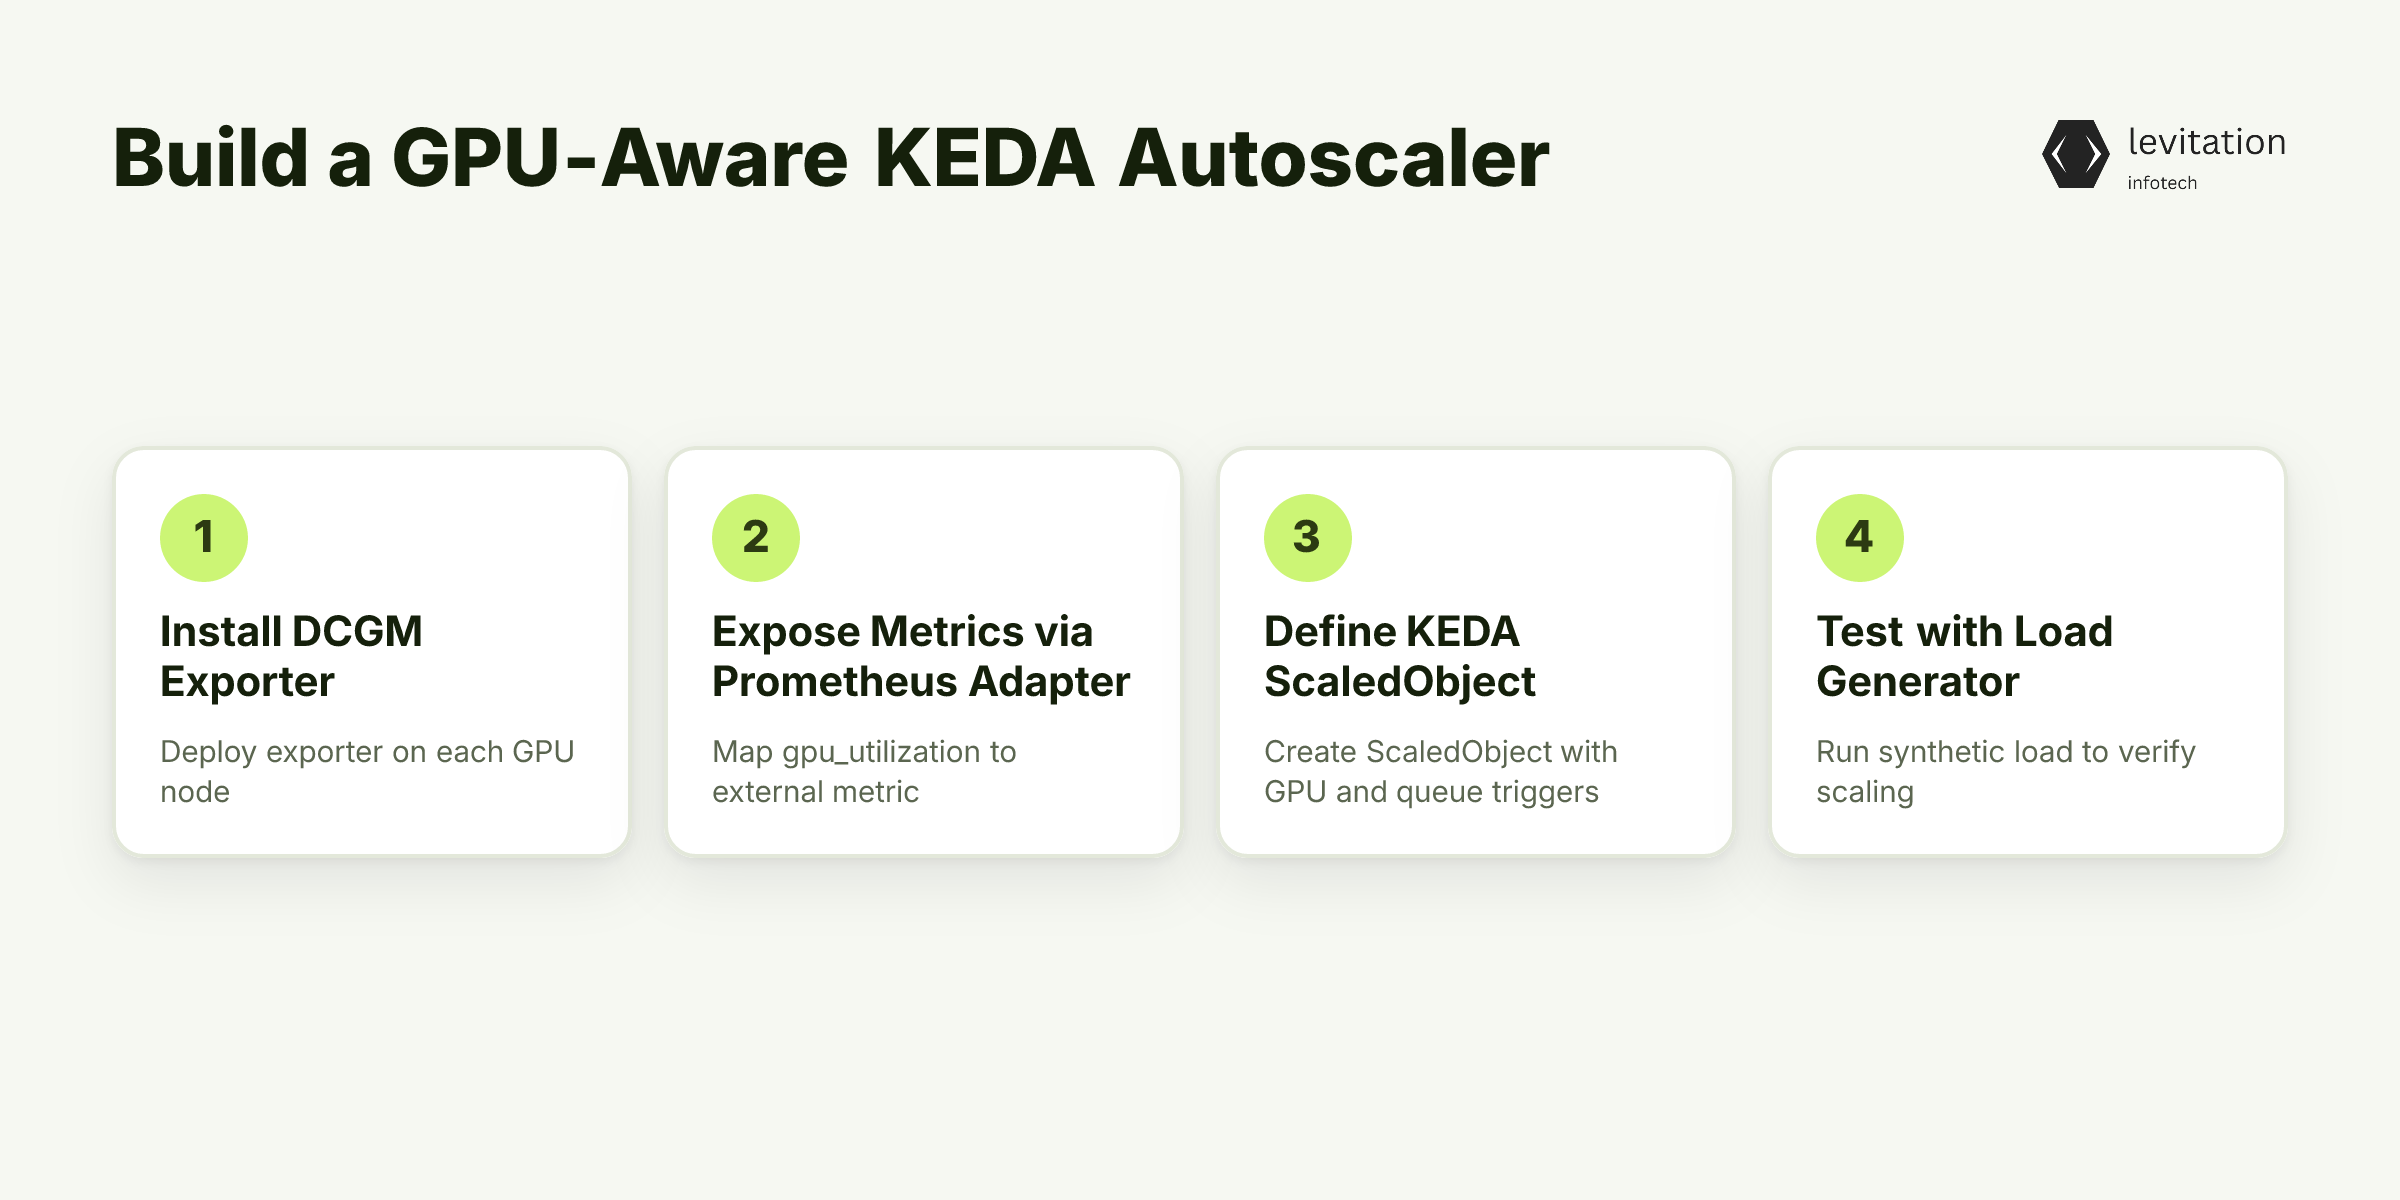
1. Install the NVIDIA DCGM Exporter
1helm repo add prometheus-community https://prometheus-community.github.io/helm-charts2helm repo update3helm install dcgm-exporter prometheus-community/dcgm-exporter \4 --namespace monitoring \5 --set gpuMonitoring.enabled=true
The exporter runs on each GPU node and exposes `/metrics` on port 9400. Verify it with:
1curl http://<node-ip>:9400/metrics | grep gpu_utilization
2. Expose DCGM Metrics via Prometheus Adapter
Create a `PrometheusAdapter` custom resource that maps `gpu_utilization` to a Kubernetes external metric.
1apiVersion: custom.metrics.k8s.io/v1beta12kind: ExternalMetric3metadata:4 name: gpu_utilization5spec:6 provider:7 type: prometheus8 prometheus:9 address: http://prometheus.monitoring.svc:909010 query: |11 avg(gpu_utilization{instance=~".*"})
Apply the manifest and ensure the API server can serve `custom.metrics.k8s.io/v1beta1`.
3. Define the KEDA ScaledObject
1apiVersion: keda.sh/v1alpha12kind: ScaledObject3metadata:4 name: inference-gpu-scaler5spec:6 scaleTargetRef:7 name: inference-deployment8 minReplicaCount: 19 maxReplicaCount: 810 cooldownPeriod: 4511 triggers: - type: prometheus12 metadata:13 serverAddress: http://prometheus.monitoring.svc:909014 metricName: gpu_utilization15 threshold: "55" - type: prometheus16 metadata:17 serverAddress: http://prometheus.monitoring.svc:909018 metricName: inference_queue_length19 threshold: "10"
The first trigger watches average GPU use; the second watches pending inference requests. KEDA will only add pods when both thresholds are breached, preventing unnecessary scale-outs.
4. Test with a Synthetic Load Generator
Deploy a simple load generator that pushes requests to the inference service at configurable QPS.
1apiVersion: apps/v12kind: Deployment3metadata:4 name: load-generator5spec:6 replicas: 17 selector:8 matchLabels:9 app: load-gen10 template:11 metadata:12 labels:13 app: load-gen14 spec:15 containers: - name: generator16 image: ghcr.io/levitation/loadgen:latest17 args: ["--target", "http://inference-service:8080/predict", "--rate", "200"]
Increase `--rate` until the GPU utilization metric crosses the 55 % threshold. Observe KEDA scaling up and down as the load changes.
5. Secure the Metric Pipeline
Because GPU metrics can reveal workload patterns, protect the Prometheus endpoint with TLS and RBAC.
1apiVersion: v12kind: ServiceAccount3metadata:4 name: prometheus-sa5 namespace: monitoring67---8apiVersion: rbac.authorization.k8s.io/v19kind: Role10metadata:11 name: prometheus-read12 namespace: monitoring13rules: - apiGroups: ["custom.metrics.k8s.io"]14 resources: ["*"]15 verbs: ["get", "list"]
Bind the role to the service account used by the Prometheus Adapter. This aligns with best practices from our [cloud security solutions](/cloud-security) guide.
With the scaler live, the real payoff becomes visible in cost reports and latency charts. The results speak for themselves in the payoff section.
The Payoff: Tangible Savings, Stable Latency, and Safer Deployments
Switching to GPU-aware KEDA scaling delivers three concrete benefits: - GPU spend drops - idle pods disappear, cutting hourly GPU charges by a large margin. - Inference latency stabilizes - pods appear only when the GPU is truly busy, eliminating cold-start spikes. - Security posture improves - fewer idle GPU nodes shrink the attack surface and simplify compliance audits.
These outcomes follow directly from aligning scaling signals with the resource that actually drives price - the GPU. Teams that adopt this pattern also notice cleaner dashboards and fewer surprise spikes in their billing statements. Common questions reveal how to fine-tune the setup.
Frequently Asked Questions
Q: Can KEDA autoscale GPU workloads out of the box?
A: No. KEDA’s built-in scalers watch CPU and memory; you must add a custom GPU metric or use an external scaler like NVIDIA DCGM.
Q: What external metric works best for AI inference scaling?
A: Queue length (number of pending inference requests) combined with GPU utilization from DCGM gives the most responsive scaling behavior.
Q: How do I avoid over-provisioning when traffic spikes suddenly?
A: Set a low target value for the GPU-utilization metric, configure a short cooldown period, and pair it with a queue-length trigger so KEDA scales only when both signals indicate real demand.
Q: Is a custom GPU scaler compatible with managed KEDA services (e.g., AKS add-on)?
A: Yes, as long as you expose the custom metric via the cluster’s Prometheus Adapter and reference it in the ScaledObject.
Further reading - Learn how to avoid hidden costs in AI workloads in our post [Kubernetes Costs Are Killing Your AI Budget](/posts/kubernetes-cost-optimization-ai-workloads). - See why serverless inference can backfire in Serverless AI Is Burning Money and Energy. - Explore deeper KEDA patterns in Advanced KEDA Autoscaling.
Implement the GPU-aware scaler today and watch your budget breathe easier.
Sources
Research and references cited in this article:
- GPU autoscaling on Kubernetes with KEDA: Building an external ...
- Stop Wasting GPU Budget: Autoscaling AI Inference on Kubernetes ...
- How to Autoscale GPU and LLM Workloads on Kubernetes | Kedify
- Autoscaling Kubernetes workloads with KEDA using Amazon ... - AWS
- KEDA Autoscaling: Event-Driven Kubernetes Scaling with Devtron
- How CAST AI uses KEDA for Kubernetes autoscaling | KEDA
- KEDA: The Event-Driven Autoscaler Kubernetes Needed
- Optimizing Kubernetes Scaling with KEDA: Balancing Performance and Cost Efficiency - DEV Community
- Cost-optimized ML on production: Autoscaling GPU Nodes on ...
- Autoscaling AI Inference Workloads to Reduce Cost and Complexity | Kedify
- Reduce Wasted GPU Dollars with Python-Powered Auto Scaling in ...
- KEDA Tutorial: Kubernetes Event-Driven Autoscaling Explained for Beginners
About the author
Mayank Singh is a software developer at Levitation Infotech, where he builds web and AI-powered applications across the company’s fintech, healthcare, and enterprise projects.