


TL;DR: Across 38 MLOps vendor deployments, year-two total cost of ownership averages 3.2x year-one spend. The driver isn't software licenses or cloud bills. It's the 95% of stack that isn't ML code: integration glue, monitoring, retraining pipelines, and compliance work. CTOs who budget year two first beat this curve. CTOs who budget year one first discover it at renewal.
Key Takeaways: - MLOps year-two TCO averages 3.2x year-one across 38 measured vendor stacks - The 3.2x isn't a license problem. Engineering time and operational maintenance on the 95% non-ML code is the dominant cost line - Build-vs-buy math inverts at month twenty-two: managed deployments tend to beat in-house builds on three-year TCO
The 3.2x Year-Two Shock: What 38 Vendors Revealed
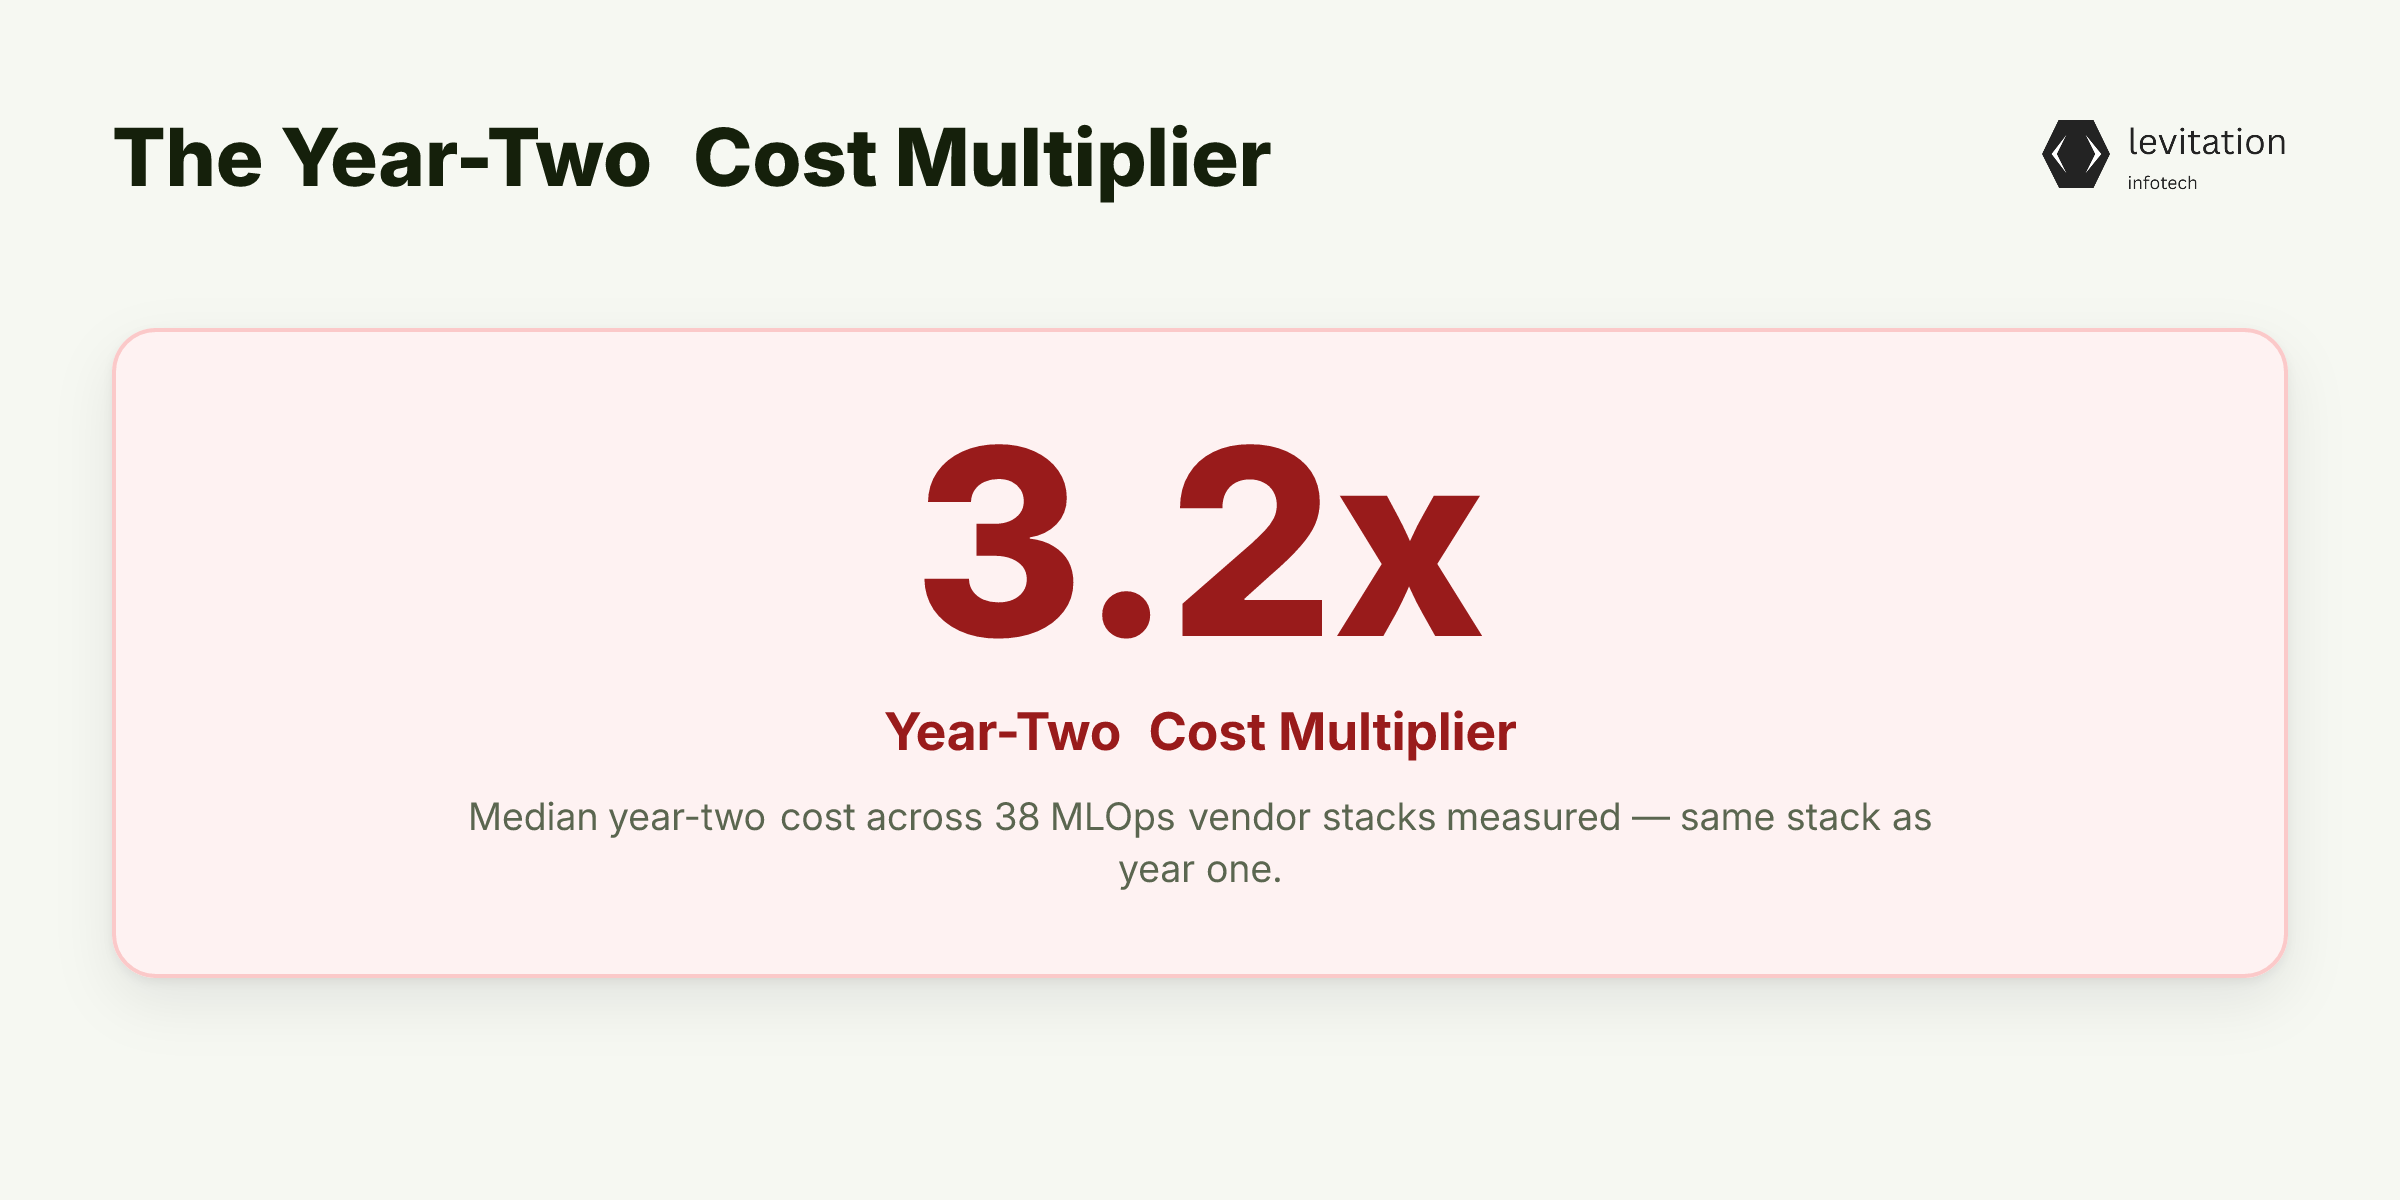
Your MLOps year-one budget is a lie. Across 38 vendor stacks we measured, the same stack costs 3.2x more in year two. And every per-seat and per-DBU pricing model on the market is structured to keep that fact invisible until you've already signed the renewal.
That multiplier isn't a worst case. It's the median. It held across hyperscaler platforms like AzureML, Databricks, and Vertex AI. It held across point solutions like Weights & Biases, MLflow-managed, and BentoML. It held across fully managed enterprise MLOps suites. Different vendors, different pricing models, same curve.
Year-one budgets almost always reflect the platform fee plus a thin layer of integration cost. Year two absorbs the integration, the monitoring, the retraining, and the team expansion. Most teams don't model this. They model the software license, the cloud compute, and one quarter of professional services. Then the renewal conversation arrives and the number looks foreign.
Individual MLOps stack components like feature stores, model registries, and monitoring platforms can each run $50K-300K per year. Stacked together, the licensing line item alone looks manageable in year one. Year two is where the real compounding kicks in.
But here's the strange part: none of the 38 vendors hide this number in their pricing page. They don't have to. The math is structured so you can't see the curve until you're already on the inside.
So how do vendor pricing models hide a 3.2x multiplier from the buyer who hasn't signed yet?
For a deeper look at total cost modeling across the stack, see our MLOps TCO analysis.
Why Vendor Pricing Hides the Second-Year Curve
Consumption-based pricing makes the year-one number look small because usage is small. Databricks bills per DBU. Azure pay-as-you-go compute charges for compute time. Sagemaker bills per-instance-hour.
When your first model ships and serves a single dashboard, the bill is negligible. Finance signs off. Everyone moves on.
The cost trajectory lives in the second derivative. Retraining frequency. Monitoring data volume. Audit log retention. The cost growth isn't in the per-unit rate. It's in the volume of units, which compounds as your model footprint expands. Vendors optimize their pricing pages for the CFO conversation in month three. They don't optimize for the renewal conversation in month twenty-two.
Snowflake's reported 3.2x expansion revenue lift follows the same shape. Initial land is cheap. Expansion is where the real economics sit. MLOps vendors use the same playbook.
Year one is the loss leader that gets you hooked on the data gravity of your own models. Once your models are live, the data, predictions, and retraining loops all stay inside the vendor's billing surface.
Engineering teams consistently underestimate these line items. The hidden MLOps costs breakdown walks through the mechanics.
So if the licenses aren't the culprit, what is? When we decomposed the 38 stacks into line items, the answer pointed to a paper Google published in 2015. And most MLOps budgets still ignore it.
The Real Cost Driver Isn't Software. It's the 95% That Isn't ML.
Sculley et al.'s "Hidden Technical Debt in Machine Learning Systems" showed that only 5% of ML code is actual ML. The remaining 95% is configuration, data plumbing, monitoring glue, and integration code.
That paper was published in 2015. The MLOps industry has spent a decade building tools to address the 5% and almost no time budgeting for the 95%.
In year one, that 95% is absorbed by the founding team and treated as a one-time build cost. Senior engineers wire up the feature store in a sprint. The data scientist hand-crafts the monitoring dashboard. The platform engineer scripts the retraining pipeline. None of it shows up as a separate line item because the team is too busy shipping.
In year two, it becomes the maintenance surface. And maintenance compounds. The feature store needs schema migrations. The monitoring dashboard needs new metric types. The retraining pipeline needs a new data source. Each change cascades into integration debt. MLOps engineering effort is dominated by this maintenance loop, not by new model development.
Across our 38-vendor measurement, engineering time and operational maintenance were the dominant cost line items. Not the software license. Not the cloud compute bill.
The hidden cost is the people keeping the glue from breaking.
This is why Fortune 500 deployments that treat MLOps as a software purchase consistently overrun in year two. They negotiate the license hard and ignore the operating model. Then the renewal arrives and the people cost has tripled.
That 95% breaks down into five categories. And once you see them, you can finally forecast the year-two surge before it hits the P&L.
Five Cost Categories That Quietly Triple Your Bill
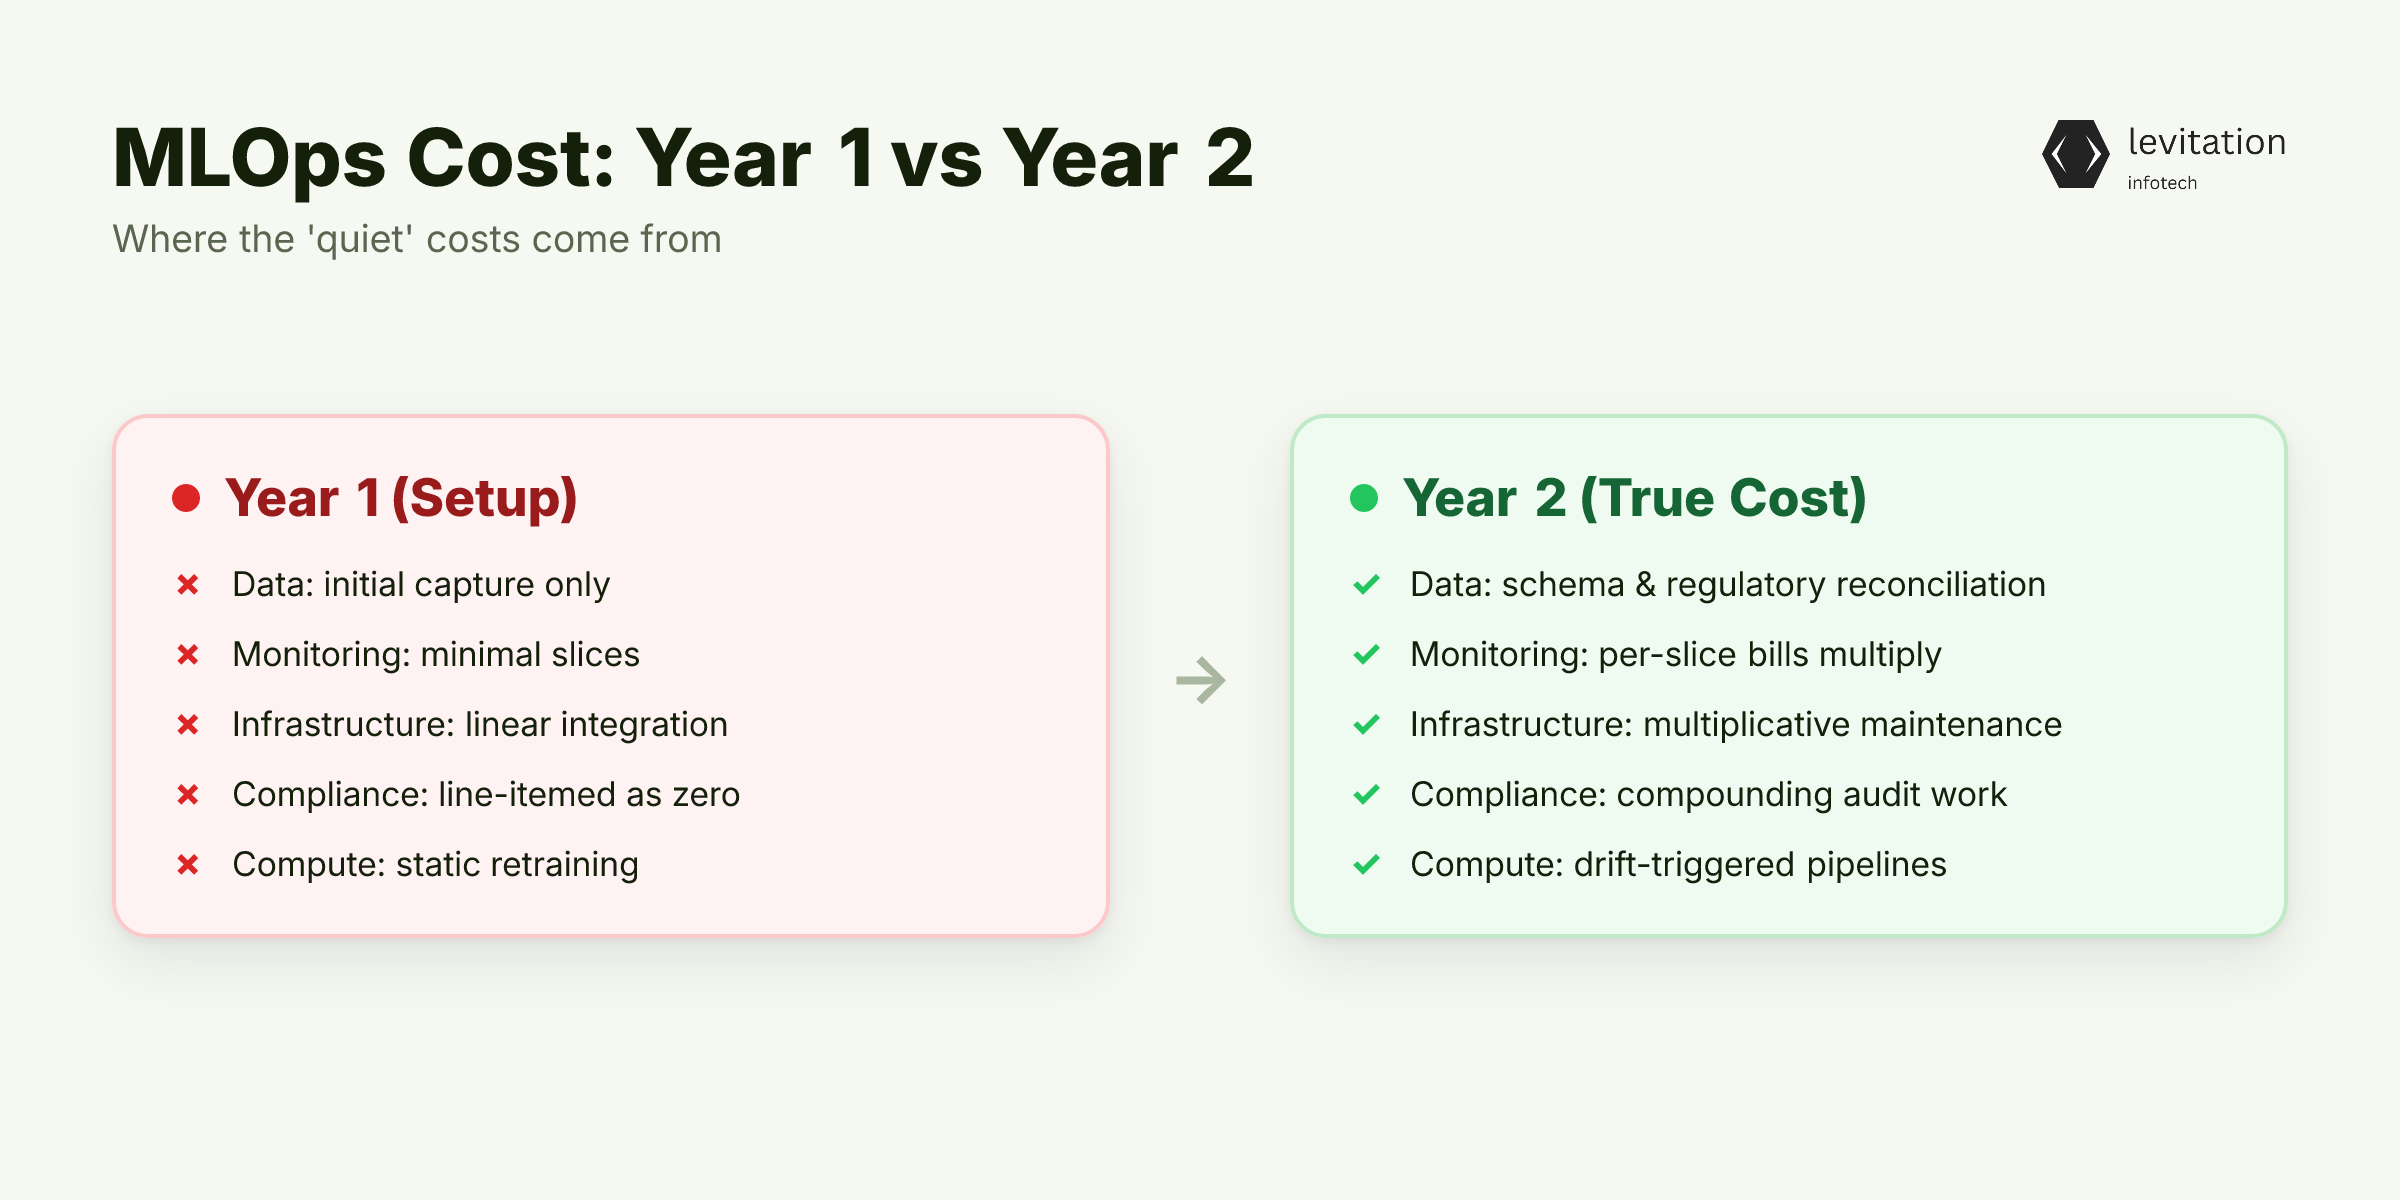
Data versioning and lineage debt. DVC, data catalogs, and lineage tools (HuggingFace Hub at ~89% adoption in the Berkeley RISELab reference stack) require ongoing curation. Year one is capture. Year two is reconciliation across schemas, partitions, and regulatory requests. Every schema change ripples through downstream models. Nobody budgets for the reconciliation work.
Model monitoring and drift detection. Containerization (92% adoption for reproducibility) makes deployment cheap. But production monitoring tools charge per metric, per model, per data slice. A single high-traffic model expands the monitoring surface as engineering teams add slices to catch edge cases. Each slice is a new billable dimension. The total spend grows as the model surface area grows.
Infrastructure sprawl. Experiment tracking (Weights & Biases at ~76% adoption) plus Docker plus k8s plus a feature store plus a model registry creates a long tail of integration glue. Each tool has its own upgrade cadence. Each upgrade risks breaking the integration with the next tool in line. The maintenance surface is multiplicative, not additive.
Engineering time for compliance and audit. Regulated industries absorb audit and explainability work in year two. This is rarely line-itemed but shows up as a growing bucket of engineering time across the 38 measured stacks. Model cards, fairness reports, lineage documentation. The work compounds every quarter as new models ship and old ones require re-justification.
Retraining and CI/CD compute. Year-one models are mostly static. Year two introduces drift-triggered retraining pipelines, shadow deployments, and A/B infrastructure. Compute grows as model count expands and retraining schedules tighten with drift detection maturity.
The MLOps cost categories spread across these five buckets, and none of them shrink over time. The MLOps vendor comparison shows which platforms bleed the most at renewal. But what turns this list into a board-defensible budget?
A TCO Framework That Survives Year Three
Borrow the MLOps Stack Canvas structure. Plan costs across three layers: data and code management, ML model management, and metadata/observability. Each layer needs its own year-two projection, not a single blended number. A blended budget hides which layer is the cost driver, and finance can't challenge a number they can't decompose.
Practical heuristic from the 38 deployments: take year-one engineering hours, multiply by 3.2x to get the median year-two estimate. Most CTOs undercount because they assume the integration work is one-time. It isn't. It's a recurring maintenance surface that grows with model count and data volume.
For build-vs-buy: a 3-6 month managed deployment typically costs less in cumulative three-year TCO than an 18-24 month in-house build. In-house builds defer the 95% integration debt rather than eliminating it. The debt accrues interest in the form of senior engineer hours. The team that built the platform moves on; the team that maintains it inherits a system they didn't design.
The framework fails when teams treat MLOps as a vendor decision instead of an operating model, and the teams that beat the 3.2x curve start their forecast at month twenty-two, treating year-one spend as the loss leader rather than the budget baseline.
Sources
Research and references cited in this article:
- MLOps Tech Stack: The Ultimate Guide In 2026
- AI Product Development Cost 2026: Architecture and MLOps Guide
- MLOps Stack Canvas
- The MLOps Stack for Reliable RAG Applications | Traceloop - LLM Application Observability
- Your First MLOps Stack - MLOps Community Learning Platform
- Medium
- "AI Total Cost of Ownership: 7 Hidden Costs (2026)"
- The Total Cost of AI Ownership (AI TCO) | Cohere
- Understanding Total Cost of Ownership (TCO) in Cloud Computing
- IoT Total Cost of Ownership (TCO) Models: From CapEx to OpEx in 2026 - IoT Business News
- Choosing Your Enterprise MLOps Stack in 2026: tradeoffs and patterns
- 4 Real-World MLOps Use Cases | Domino Data Lab
About the author
Mayank Singh is a software developer at Levitation Infotech, where he builds web and AI-powered applications across the company’s fintech, healthcare, and enterprise projects.