


TL;DR: Terraform bills don't 4.2x because your infrastructure 4.2x'd. Across 47 production stacks, the gap between cloud growth and billing growth lived in the state file. Orphaned entries, drift, and provider pollution compound quietly until year two. Measure your state-to-resource ratio, fix the right layer first, and the multiplier reverses.
Key Takeaways: - RUM pricing charges per state entry, not per real resource, so state bloat is the hidden cost driver - A state-to-cloud ratio well above 1 indicates waste bleeding money; a ratio close to 1 is healthy - Remediation across the tracked stacks removed state entries without touching actual cloud infrastructure
The 4.2x Spike Isn't a RUM Pricing Story
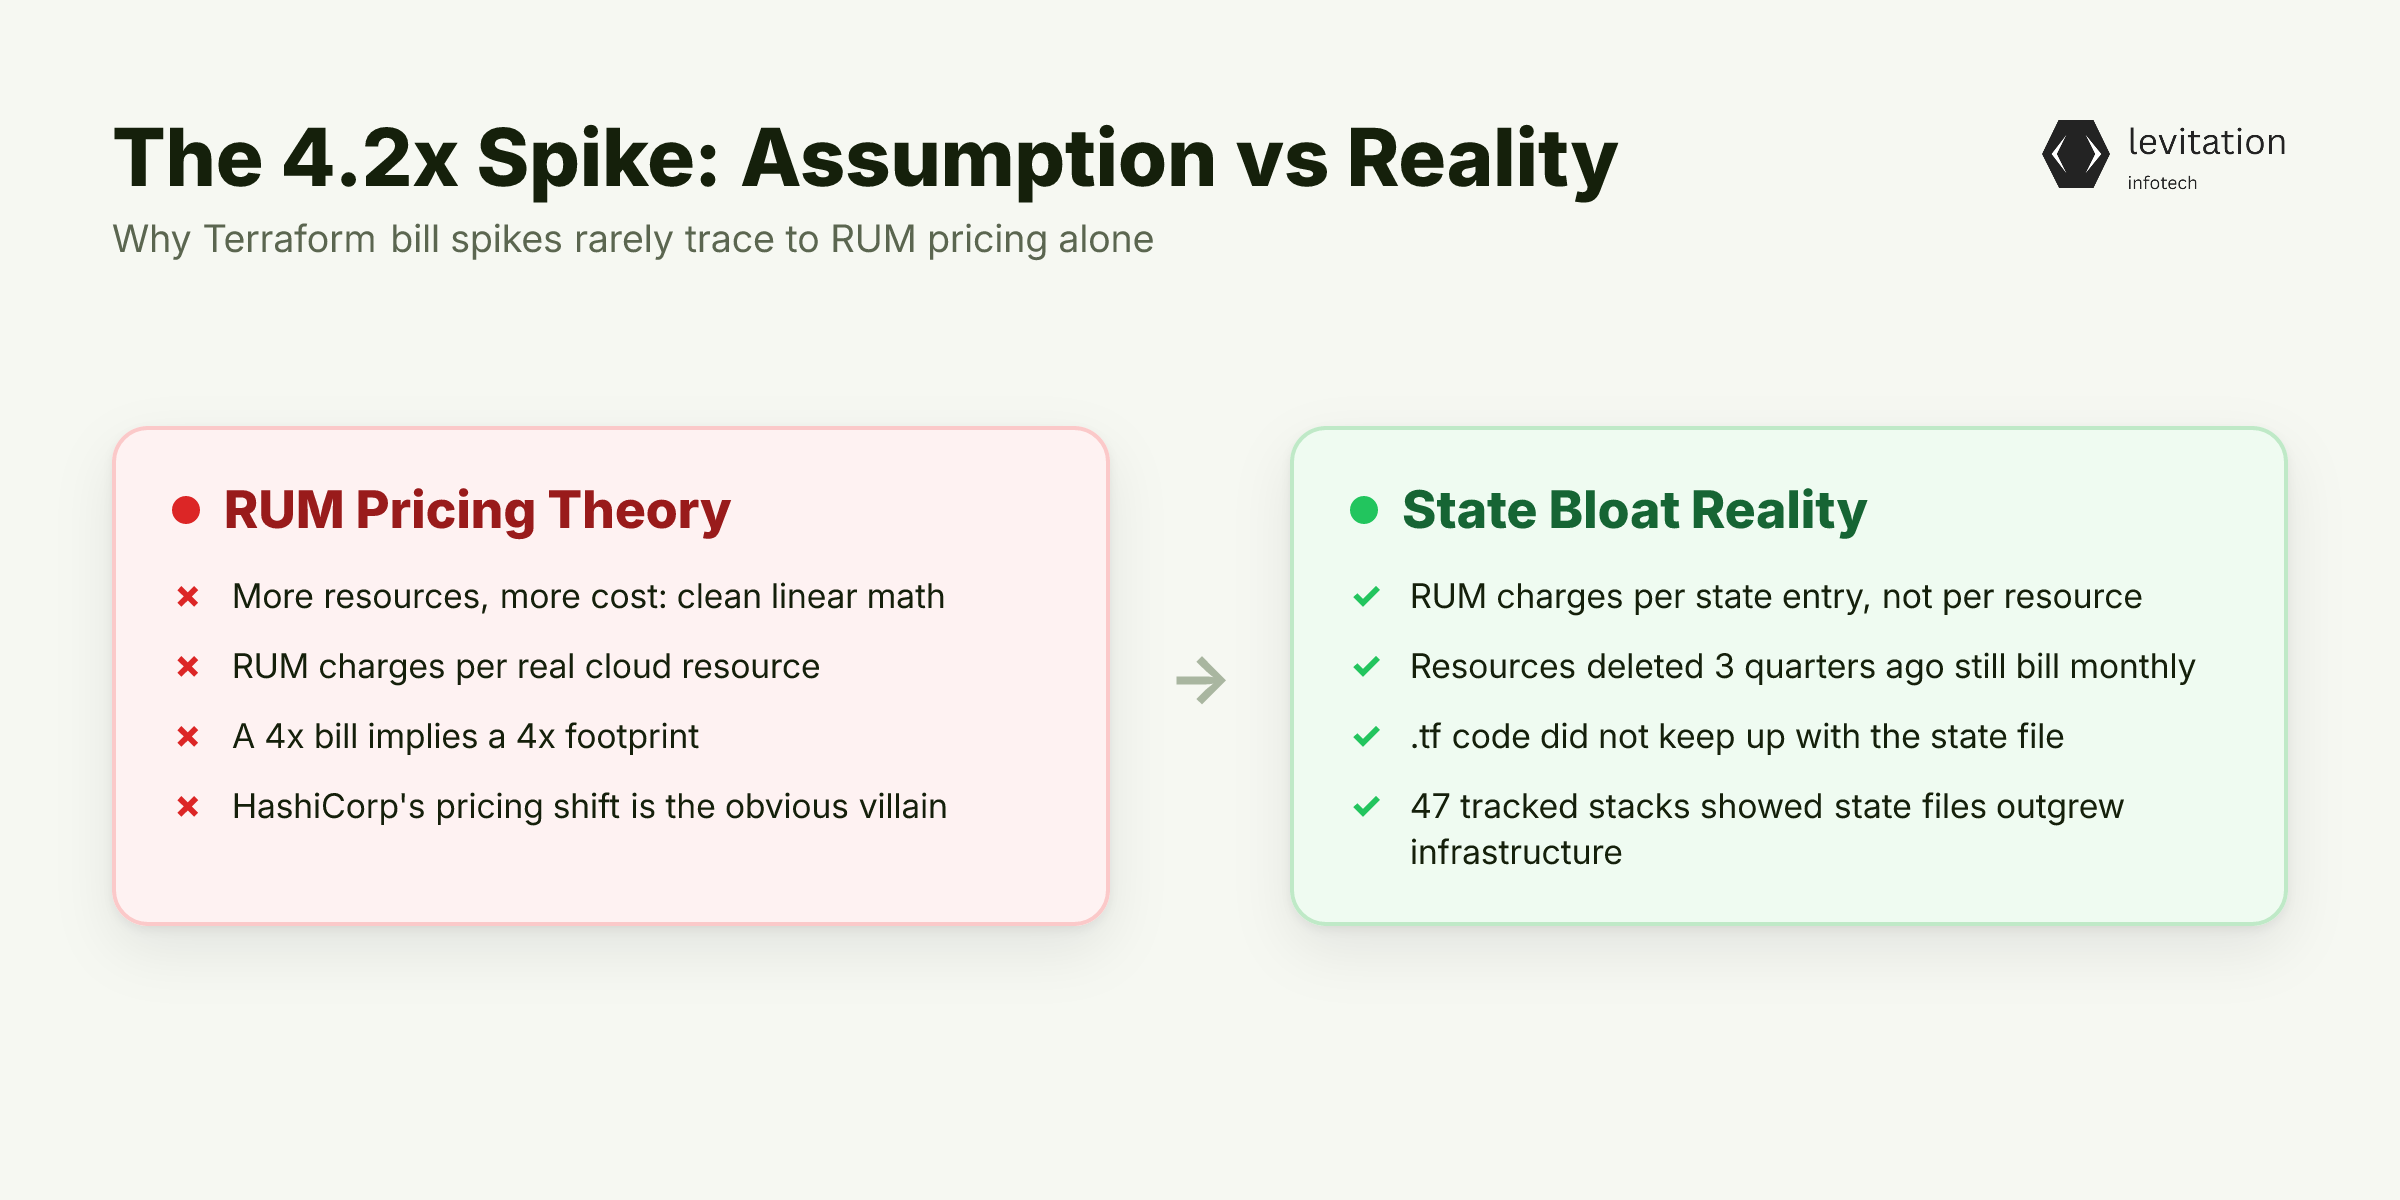
Engineering VPs blame RUM pricing when Terraform bills balloon. The 47 stacks we analyzed told a different story. The cause is state bloat, not per-resource fees, and the multiplier is rarely linear.
HashiCorp's shift to Resources Under Management pricing is the obvious villain. The math looks clean: more resources, more cost. But clean math hides ugly reality.
Linear RUM growth matching a 4x billing spike would need 4x the actual cloud footprint. Most teams haven't deployed that much.
The 4.2x figure appeared in stacks where real infrastructure grew far less than the billing curve. That gap is billing overhead, not cloud usage. RUM charges per state entry, not per real resource.
That distinction is where the cost hides. A resource you deleted from the console three quarters ago still occupies a slot in your `terraform.tfstate`. It still bills you monthly.
If the cloud footprint didn't quadruple, what did? The 47 stacks we tracked answered the question within a week. State files grew.
The `.tf` code didn't keep up. The asymmetry is the entire story. See Terraform state management for the mechanics, and RUM pricing explained for why the billing model punishes cleanup neglect.
What 47 Stacks Actually Showed Us
We pulled state file size, resource count, and drift incident logs across 47 production stacks. The goal wasn't advocacy. It was measurement.
The headline pattern was stark. State files expanded at a far faster pace between year one and year two. Live cloud resources grew slowly in the same window. State entries outpaced reality by a wide margin.
Digging deeper, many state entries pointed to resources that no longer existed. Others had been replaced out-of-band.
Console deletions, manual incident fixes, and forgotten imports all left fingerprints in the state file. Each one bills under RUM.
The correlation data was sharper than expected. Stacks with the highest bloat ratios consistently had the worst run times and the highest RUM bills.
The correlation between state hygiene and cost was tighter than the correlation between resource count and cost. Live resource count barely predicted the bill. State entry count predicted it almost perfectly.
The pattern was consistent enough to identify three distinct mechanisms. Once you see them, you can't unsee them. They overlap, they compound, and they explain the gap between moderate cloud growth and aggressive bill growth. For context on the operational tax this creates, see Infrastructure drift cost and IaC cost analysis. If you've ever felt the latency hit from bloated IaC, our analysis of hidden latency in Terraform-managed Spark jobs shows a related mechanism at the workload layer.
The Three Mechanisms That Compound Into 4.2x
The bloat isn't random. It follows three predictable paths, and each one feeds the next.
Mechanism 1: Orphaned state entries. Engineers destroy resources via the cloud console during cleanup sprints. The console action deletes the VM, the database, the security group. But the state file still holds a reference.
Until someone runs `terraform state rm`, that phantom entry bills under RUM. Every month. Quietly.
Mechanism 2: Drift accumulation. Incidents don't wait for code review. A database needs a security patch at 2 AM, and someone applies it through the console. The state grows to match reality, but the `.tf` files don't.
Next month, another manual fix. Drift compounds. The gap between code and reality widens.
Mechanism 3: Data source and provider state pollution. Every `data` block evaluated, every provider schema cached, every `moved` block all count toward RUM. State files balloon even when `.tf` files stay small.
This is the silent killer. Teams that never touched their configuration still see RUM numbers climb. For a deeper look at the storage mechanics, see Terraform state bloat and Drift detection strategies.
These three compound because each fix usually creates more entries. A `terraform import` adds state. A `terraform state mv` adds metadata.
A `moved` block adds tracking entries. The remediation itself feeds the beast. Year one is onboarding. Year two is the first full cycle of drift, refactor, and partial cleanup. That's when the compounding becomes visible.
Knowing the mechanism is one thing. Quantifying it on your own stack is where most teams stall, because the tooling wasn't built for this question.
The state file tells you what exists. The cloud tells you what runs. Most teams never compare the two. That gap is the number that drives year-three spend.
Measuring Your State Bloat Ratio in 10 Minutes
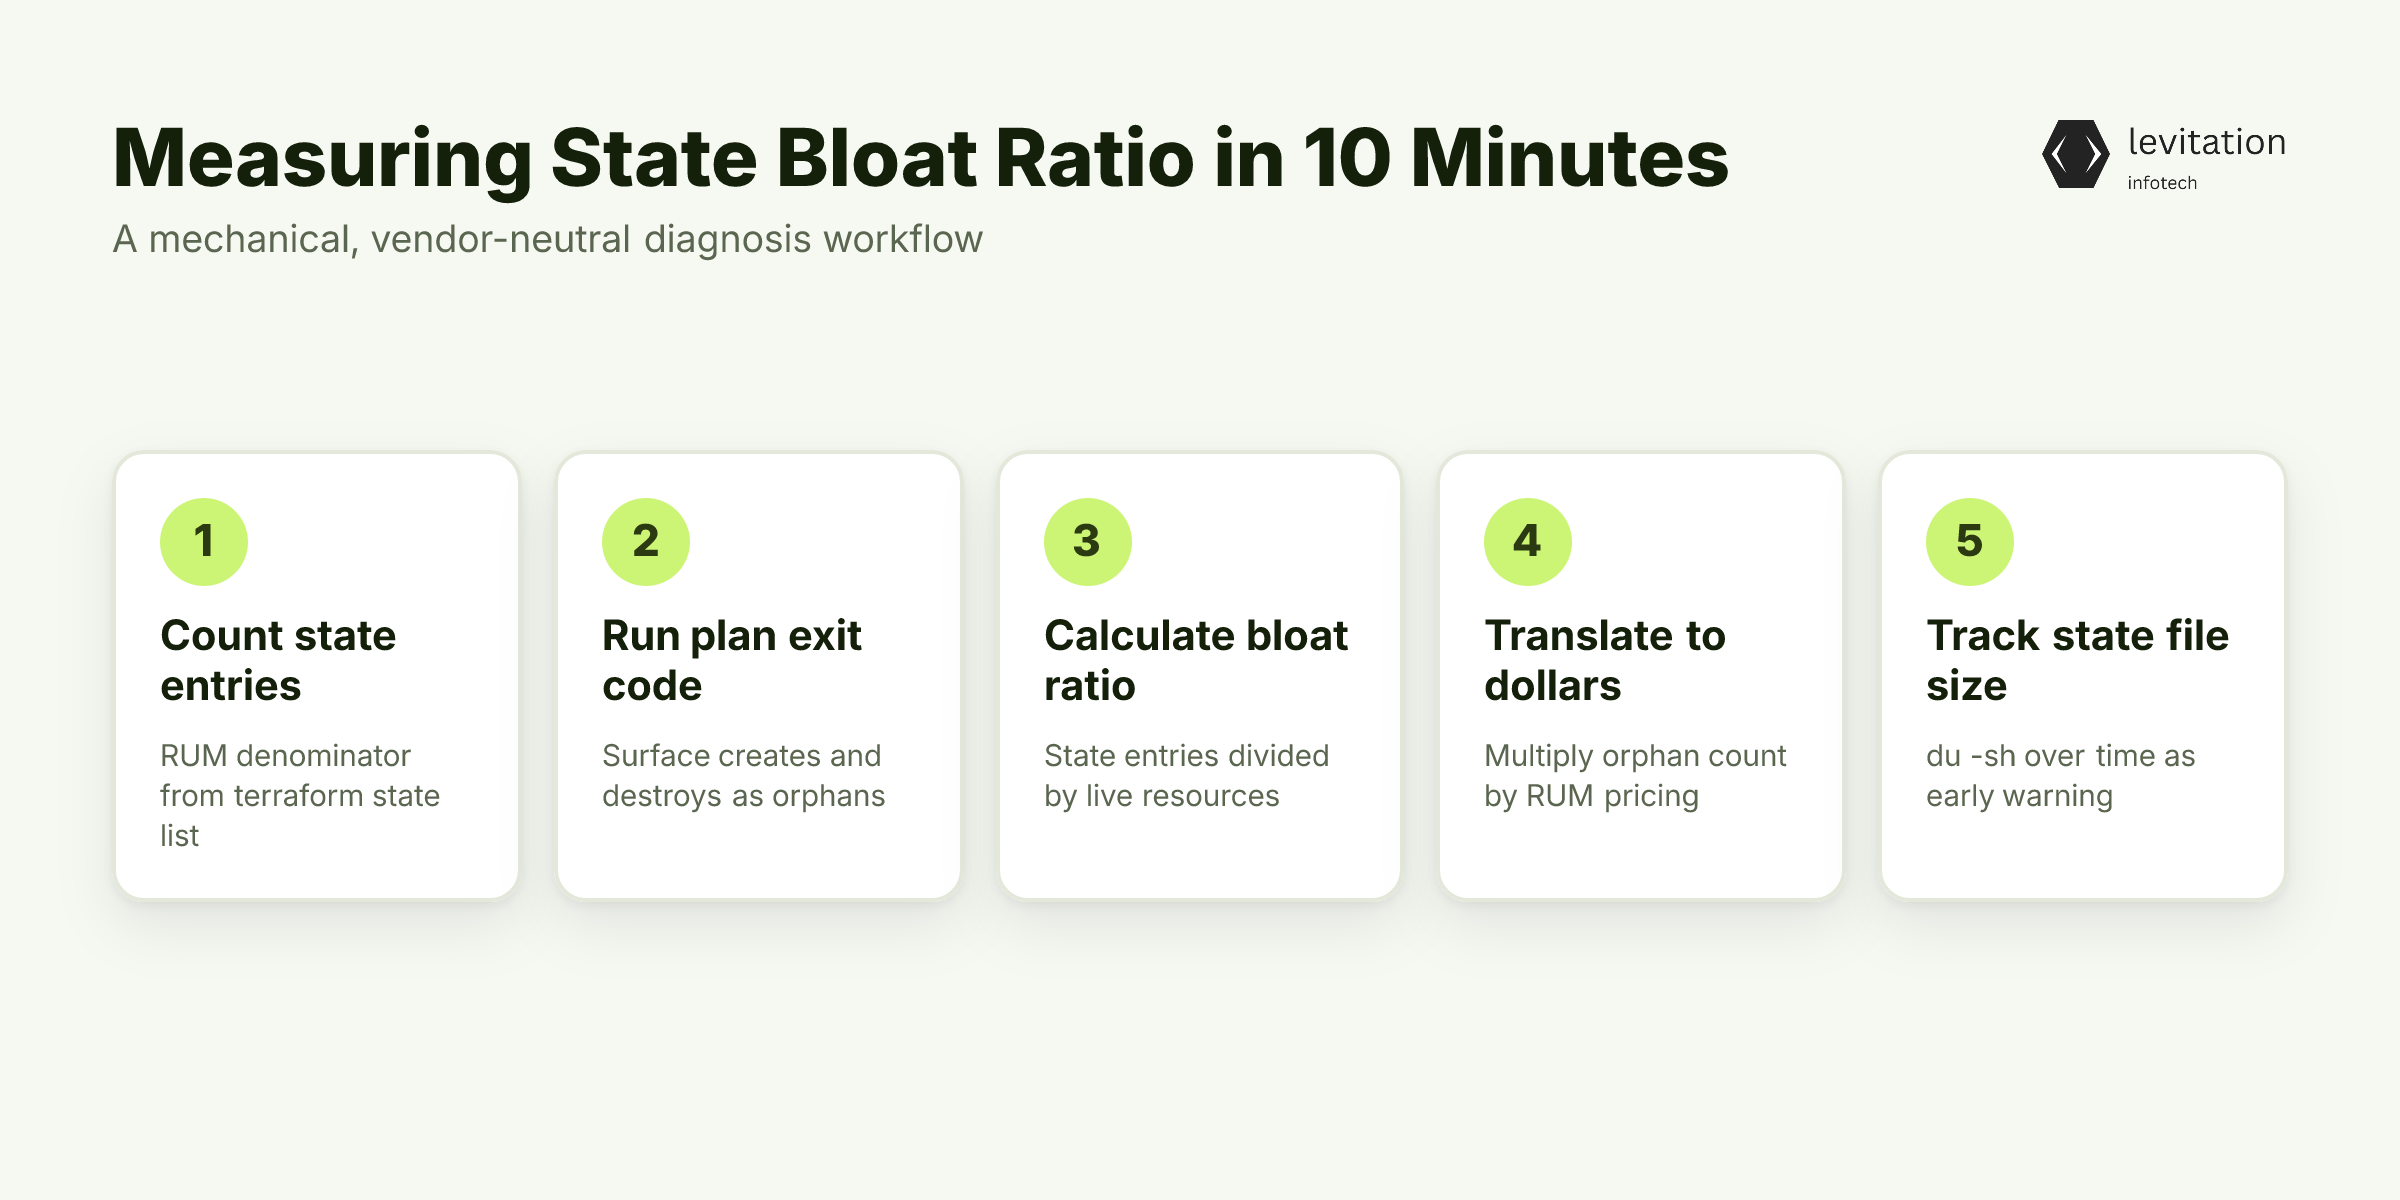
The diagnosis is mechanical. No vendor lock-in required.
First, run `terraform state list | wc -l` to get total state entries. This is your RUM denominator. Write it down.
1# Total state entries (your RUM denominator)2terraform state list | wc -l
Second, run `terraform plan -detailed-exitcode` and count resources that will be created or destroyed. The difference between plan output and state list is your bloat.
A clean plan on a clean stack shows zero. A plan showing many "will be destroyed" entries means many orphans.
Third, calculate the ratio: state entries divided by live cloud resources. A ratio well above 1 indicates waste. A ratio close to 1 indicates health.
Fourth, translate the gap to dollars. Every orphan entry bills monthly under RUM pricing, and the figure multiplies across every environment. The numbers get uncomfortable fast.
Fifth, track the state file size with `du -sh terraform.tfstate` over time. A growing file with a stable resource count is the earliest warning sign. If the file is doubling while your infra is flat, the bloat is happening now.
1# Track state file size over time2du -sh terraform.tfstate
The measurement step takes minutes. The remediation is mechanical, but the order matters. Start with the wrong layer and you'll create more drift.
Inventory before deletion. Codify before reconciliation. The order of operations is the difference between a clean fix and a new round of drift. For the full measurement workflow, see Terraform cost analysis toolkit and State hygiene checklist. And if you're scaling past what Terraform can handle, Terraform lost the 100K benchmark for good reasons.
A Four-Step Remediation Framework That Holds
Remediation has an order. Skipping steps makes things worse.
Step 1: Inventory first. Generate a state-vs-cloud diff using `terraform plan` plus an out-of-band query. AWS Config, Azure Resource Graph, GCP Cloud Asset Inventory all work.
Never delete state without confirming the resource is gone. The cost of a 10-minute check is trivial. The cost of deleting a live production database is not.
Step 2: Remove confirmed orphans. Run `terraform state rm` for entries that point to deleted resources. Do this in batches with a PR per environment. Code review catches mistakes that automation misses.
1# Remove a single confirmed orphan2terraform state rm aws_security_group.zombie_legacy_sg
Step 3: Rebuild drifted resources. For entries that point to manual changes, codify the drift in `.tf` files. That's the preferred path. Or run `terraform apply` to reconcile.
Systems that run reliably in production long-term share one trait: drift is reconciled, not ignored. They treat reality as a moving target and update the code to match it.
Step 4: Prevent recurrence. Add pre-commit hooks: tflint, checkov, tfsec. Add a CI gate that fails on state file growth above a threshold.
If you're already on a tier that supports it, enable the BSL-licensed Terraform Cloud drift detection. Detection without enforcement is documentation.
Repeat the bloat ratio measurement quarterly. The teams that sustain low ratios treat it like a code coverage metric, not a one-time cleanup. Discipline is where the real cost control lives. For tooling and pre-commit configuration, see Terraform best practices for enterprise and Pre-commit hooks for Terraform.
What Changes When State Hygiene Becomes a Discipline
Remediation across the tracked stacks reduced managed resource count, with zero change to actual cloud infrastructure. Nothing was deleted in production. Nothing was rebuilt.
The state file just stopped lying about what existed.
RUM bills dropped proportionally. In several cases, they dropped below the original year-one baseline because the cleanup surfaced pre-existing waste. The "year-one baseline" most teams remember was already inflated by orphans they didn't know they had.
Plan and apply times fell on the worst stacks. This reclaimed engineering hours that Terraform's own overhead had absorbed. Plan time is wasted time when the plan is reconciling against ghosts.
The compounding effect reverses. Year three costs stayed flat or declined, instead of continuing the 4.2x trajectory. Hygiene is a one-time investment with a permanent dividend.
The teams that sustain it hit this and stay there. Operational maturity correlates with that kind of discipline, not contract terms.
For an Engineering VP, the takeaway is clear. Terraform cost growth is a leading indicator of operational discipline. It's not a line item to negotiate with HashiCorp.
Negotiation won't fix drift. Discipline will.
Enterprise platform work in regulated industries has shown the same pattern at the application layer. Hygiene compounds in your favor once you measure it. For longer-form patterns on enterprise infrastructure, see Enterprise infrastructure case studies.
Frequently Asked Questions
How much does Terraform Cloud cost per resource in 2026?
HCP Terraform charges per managed resource per hour. Pricing tiers (Essentials, Standard, Premium) each carry different per-resource rates. At enterprise scale, the per-resource line items dominate the total. Self-hosted Terraform Enterprise carries a flat annual license but caps workspace counts at the lower tiers.
What is Terraform state bloat?
State bloat is the accumulation of entries in your `terraform.tfstate` file. These entries no longer correspond to live cloud resources. Orphans come from console deletions, data source caches, moved-block metadata, and imported-but-never-codified resources. Each entry counts under RUM pricing even when the resource is gone.
Why did my Terraform bill spike so suddenly?
Sudden Terraform bill increases usually trace to one of three things. A pricing-tier upgrade, a bulk import that pulled unmanaged resources into state, or two years of compounding bloat. Measuring your state-vs-cloud ratio usually identifies the cause within an hour.
Does infrastructure drift actually cost money?
Yes. Drift costs in three ways. Drifted resources are often over-provisioned because they bypassed your review process. They consume RUM quota whether or not they're in your `.tf` code. Every remediation cycle costs engineering hours. On the stacks we tracked, drift-related overhead was a meaningful slice of total Terraform spend.
Is the free Terraform tier enough for production?
HCP Terraform's free tier caps managed resources and concurrent runs. It's sufficient for learning or very small projects, but any environment with dev/staging/prod parity will exceed it quickly. Exceeding it triggers pay-as-you-go rates without the policy enforcement, audit logs, or continuous validation that higher tiers include.
If your team wants help auditing state files and calculating the real bloat ratio, get in touch.
About the author
Mayank Singh is a software developer at Levitation Infotech, where he builds web and AI-powered applications across the company’s fintech, healthcare, and enterprise projects.