


TL;DR: At 50M vectors, license fees for major vector databases cluster in a narrow band. Yet five-year total cost of ownership varies by 4.1x. The variance comes from five operational multipliers that pricing shootouts ignore. These include embedding generation, re-indexing, index structure choices, traffic and egress, and ongoing tuning. Model those before you pick a vendor. Your CFO will sign a number with no relation to the bill you'll pay.
Key Takeaways: - License fees are procurement noise; the real cost is operational, not contractual - Re-indexing cycles alone can dominate your five-year bill and are excluded from every competitor comparison - The five TCO multipliers compound. Fixing one without the others leaves the spread intact - S3 Vectors changes storage economics but does not eliminate any of the five multipliers - A 30-minute TCO model at 10M, 50M, and 100M vectors reveals the 4.1x spread before procurement begins
The 4.1x Spread Has Nothing to Do With License Fees
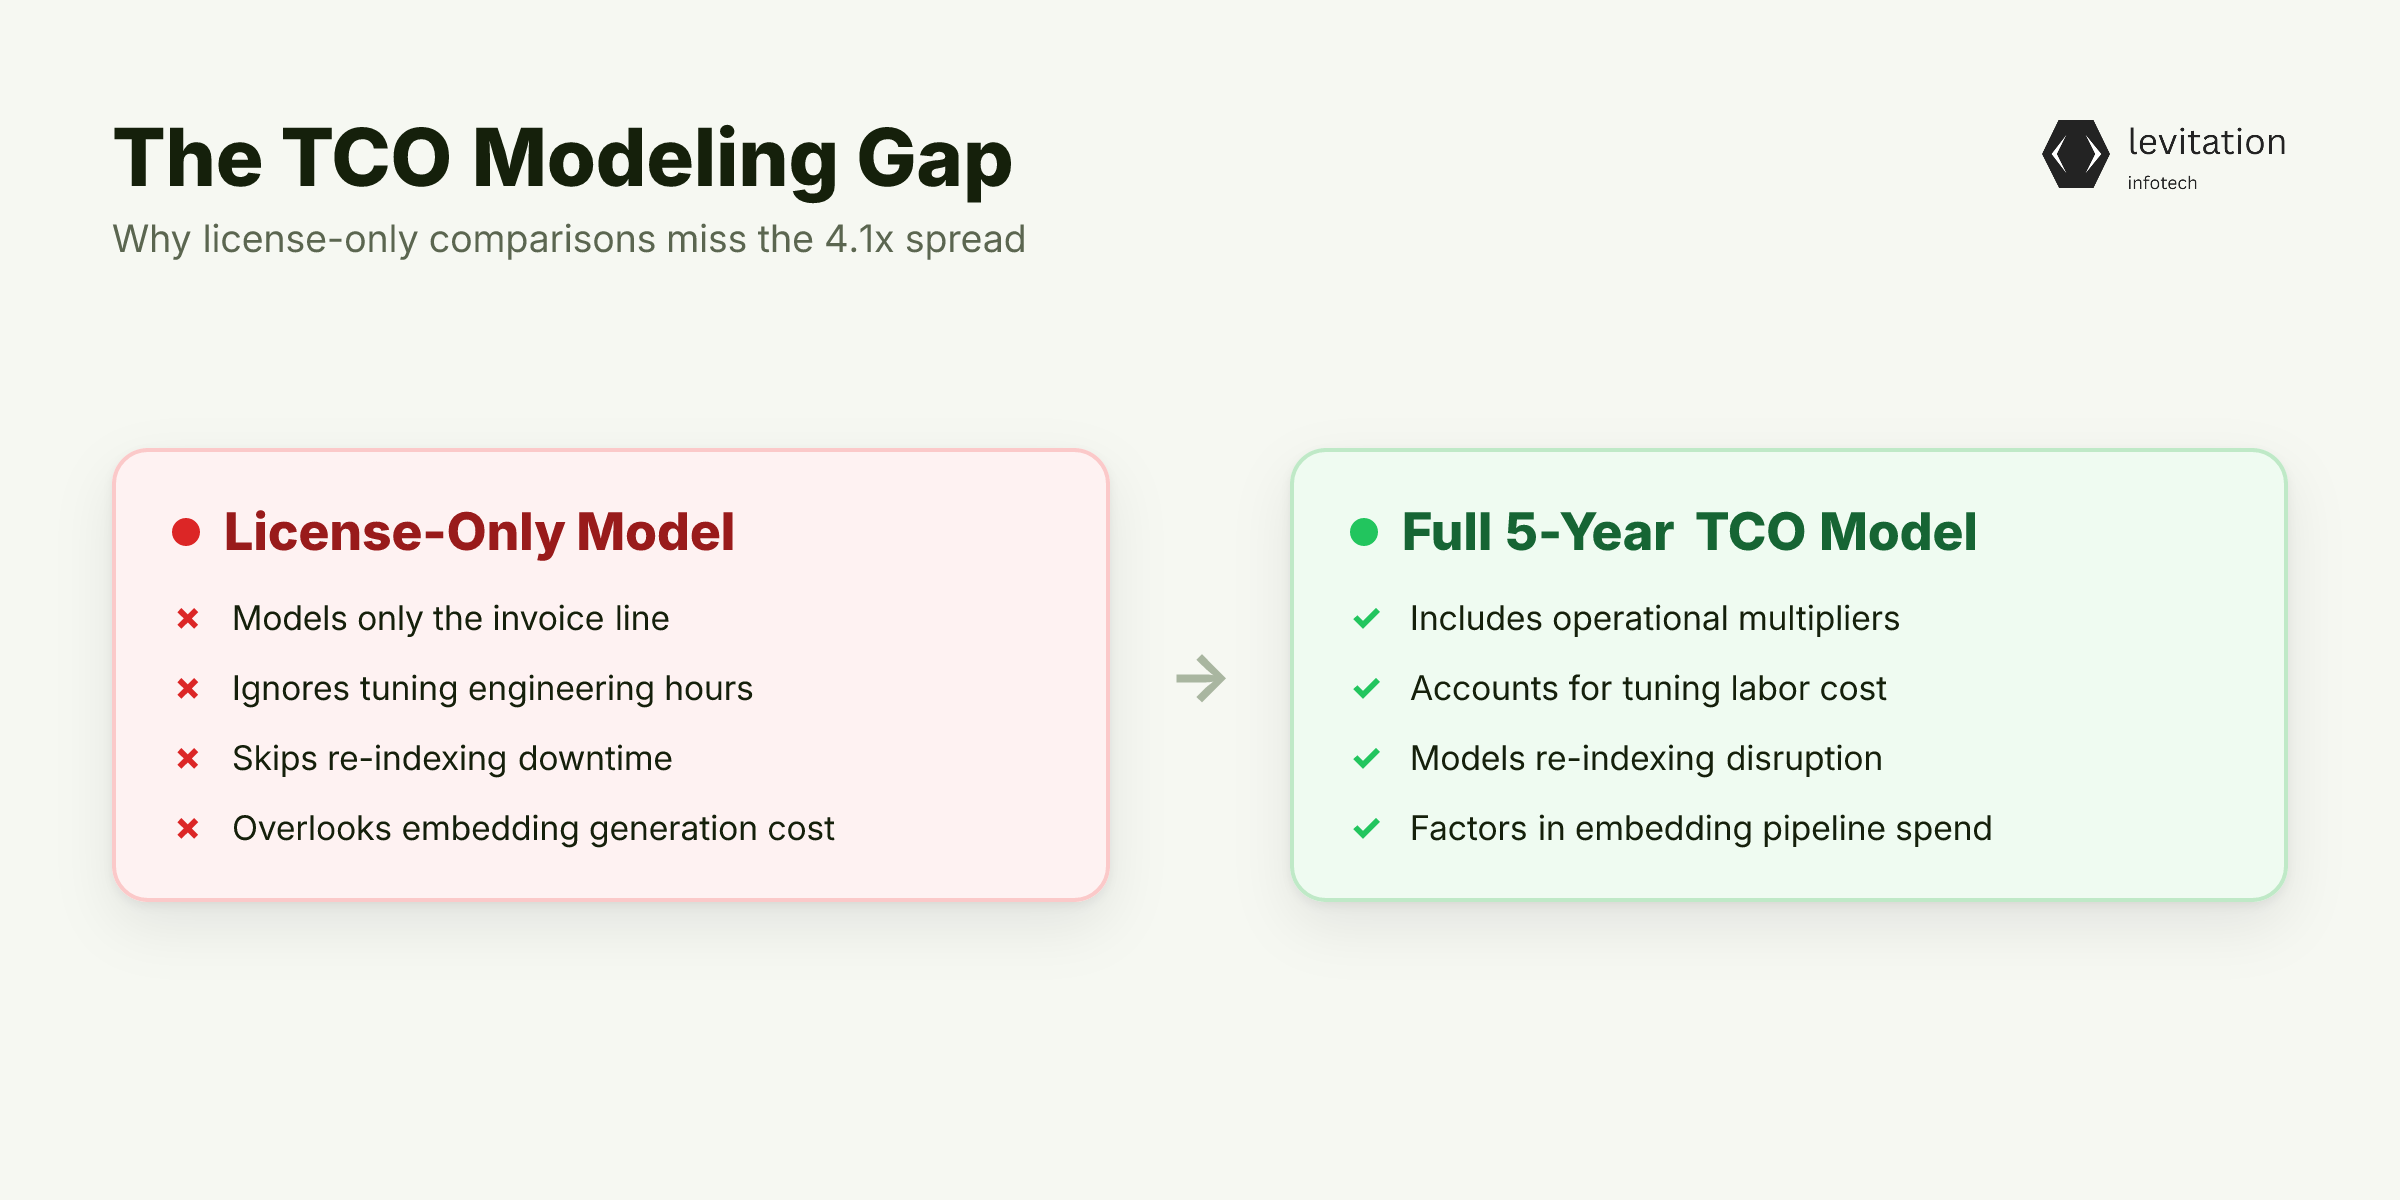
Your pricing comparison is comparing the wrong line item. License fees for vector database TCO at 50M vectors are remarkably close. This holds across Pinecone, Weaviate, Qdrant, Milvus, and S3 Vectors. They sit well inside the noise of annual price changes. The five-year TCO spread is 4.1x. Something is hiding between the invoice and the spreadsheet.
The variance lives in operational multipliers most pricing shootouts refuse to publish. Identical workloads run under different operational models. They produce five-year bills that differ by a factor of four. Same vectors. Same queries. Different teams, different tuning, different re-indexing discipline.
The operational reality: - License cost convergence at 50M vectors is tight enough that pricing shootouts treat it as background noise - The 4.1x spread only appears when you run identical workloads under different operational models - Operational multipliers include embedding generation, re-indexing, index structure, traffic, and tuning - The largest line item on the five-year invoice is rarely the database license itself
Most procurement teams model the license line and stop. They do not model the engineering hours that tuning uses. They skip the re-indexing downtime that interrupts production traffic. They ignore the embedding bill that outruns the database charge.
The result: a vendor that looks more expensive on paper becomes the cheapest option. This happens once you account for what occurs after go-live. The license line item is the least interesting number on the invoice. But it is the only one most teams model. The next number matters more, and almost no one budgets for it.
Why Re-Indexing Cycles Alone Can Dominate Your Five-Year Bill
Re-indexing is the most visible cost nobody budgets. Switching to a better embedding model forces a full re-index of your corpus. On a 50M vector dataset, that re-index uses engineering time and compute resources. Duration depends on corpus size, query concurrency, and cutover cleanliness.
Downtime stretches from hours into days. Vector database pricing comparison tables do not show this line because it varies by team. Managed vendors take on some of the operational pain but pass the compute cost through. Self-hosted stacks take the pain in engineering time, which is harder to measure and easier to ignore.
Each re-index event burns three resources at once: - Compute, during the rebuild and during the query shadowing phase - Storage, because you hold the old index until the new one is checked - Engineering hours, which most TCO calculators convert to zero
Some teams swap embedding models more than once in the first 18 months. They face a multiplier most calculators miss. The compounding effect is structural, not arithmetic. Each swap duplicates the work.
Embedding APIs charge per token at re-index time. Compute clusters run at full load for the migration window. Your recall takes a hit during the cutover. Users see a degraded experience for hours or days.
Right-sized vector infrastructure reaches production faster when the team models this upfront. The longer in-house timeline includes re-indexing surprises that block product launches and force re-architecture. The difference is planning, not engineering skill.
The next multiplier is bigger, and most architects never see it.
The Five TCO Multipliers Every Pricing Comparison Ignores
Five cost categories compound into the 4.1x spread. They interact. Fixing one without the others leaves the spread intact. The five: embedding generation, index structure, egress, tuning, and index rebuild.
S3 Vectors cost analysis treats storage differently than the rest, but the multipliers still apply.
Embedding Generation Costs
At 50M vectors, embedding fees can exceed the base database bill and grow with every re-index event. Embedding model upgrades trigger the re-indexing cycles from the previous section. That is why this line item sits at the top of the list.
Storage is the line item everyone quotes. The next multiplier hides inside index structure decisions.
Index Structure and Quantization Choices
HNSW parameter choice, quantization level, and sharding strategy shift storage and compute by a wide margin. The exact impact varies by workload.
Wrong index structure at 50M vectors can bloat storage footprint and add query cost. Right-sizing these parameters is not a one-time decision. It is a recurring tuning exercise as traffic patterns shift.
Even with the right index, managed tiers charge for traffic the open-source stack treats as free.
Egress, Read Units, and Cross-AZ Traffic
Managed tiers charge for read units and cross-AZ traffic that the open-source version treats as free. High-cardinality filtering with hybrid queries adds to read-unit use in ways shootouts never show. A workload that looks cheap on paper can far exceed the projected read budget. This happens once real traffic arrives.
Traffic costs are visible on the bill. The hidden cost is the engineering time to keep the system tuned.
Operational Tuning and Recall Engineering
Recall versus latency tradeoffs need ongoing engineering attention. Managed vendors do not fully hide this work.
Production systems measure recall against user satisfaction, not ground truth. The two differ as query distributions shift. Someone has to keep the index tuned. That work recurs every quarter, not once at launch.
Tuning is recurring. So is the last multiplier, and it forces the largest re-index events.
Index Rebuild on Schema Change
Adding filters, multi-tenancy, or hybrid search often forces a full rebuild. This multiplier interacts with the re-indexing cycle covered earlier. Schema changes usually happen together with embedding model upgrades. The two events compound. Plan for them together or you will pay for them twice.
These five categories do not just add to cost. They compound in ways most TCO calculators cannot show. The managed-vs-self-hosted debate misses this. The blind spot decides which side of the tipping point you end up on. Which side is your current architecture sitting on?
S3 Vectors and the Managed-to-Sovereign Tipping Point
S3 Vectors shifts the storage layer. It removes the separate vector compute cluster and treats vector storage as an object-store primitive. The economics change because you stop paying for an always-on vector compute node. This happens when your query volume is bursty or moderate.
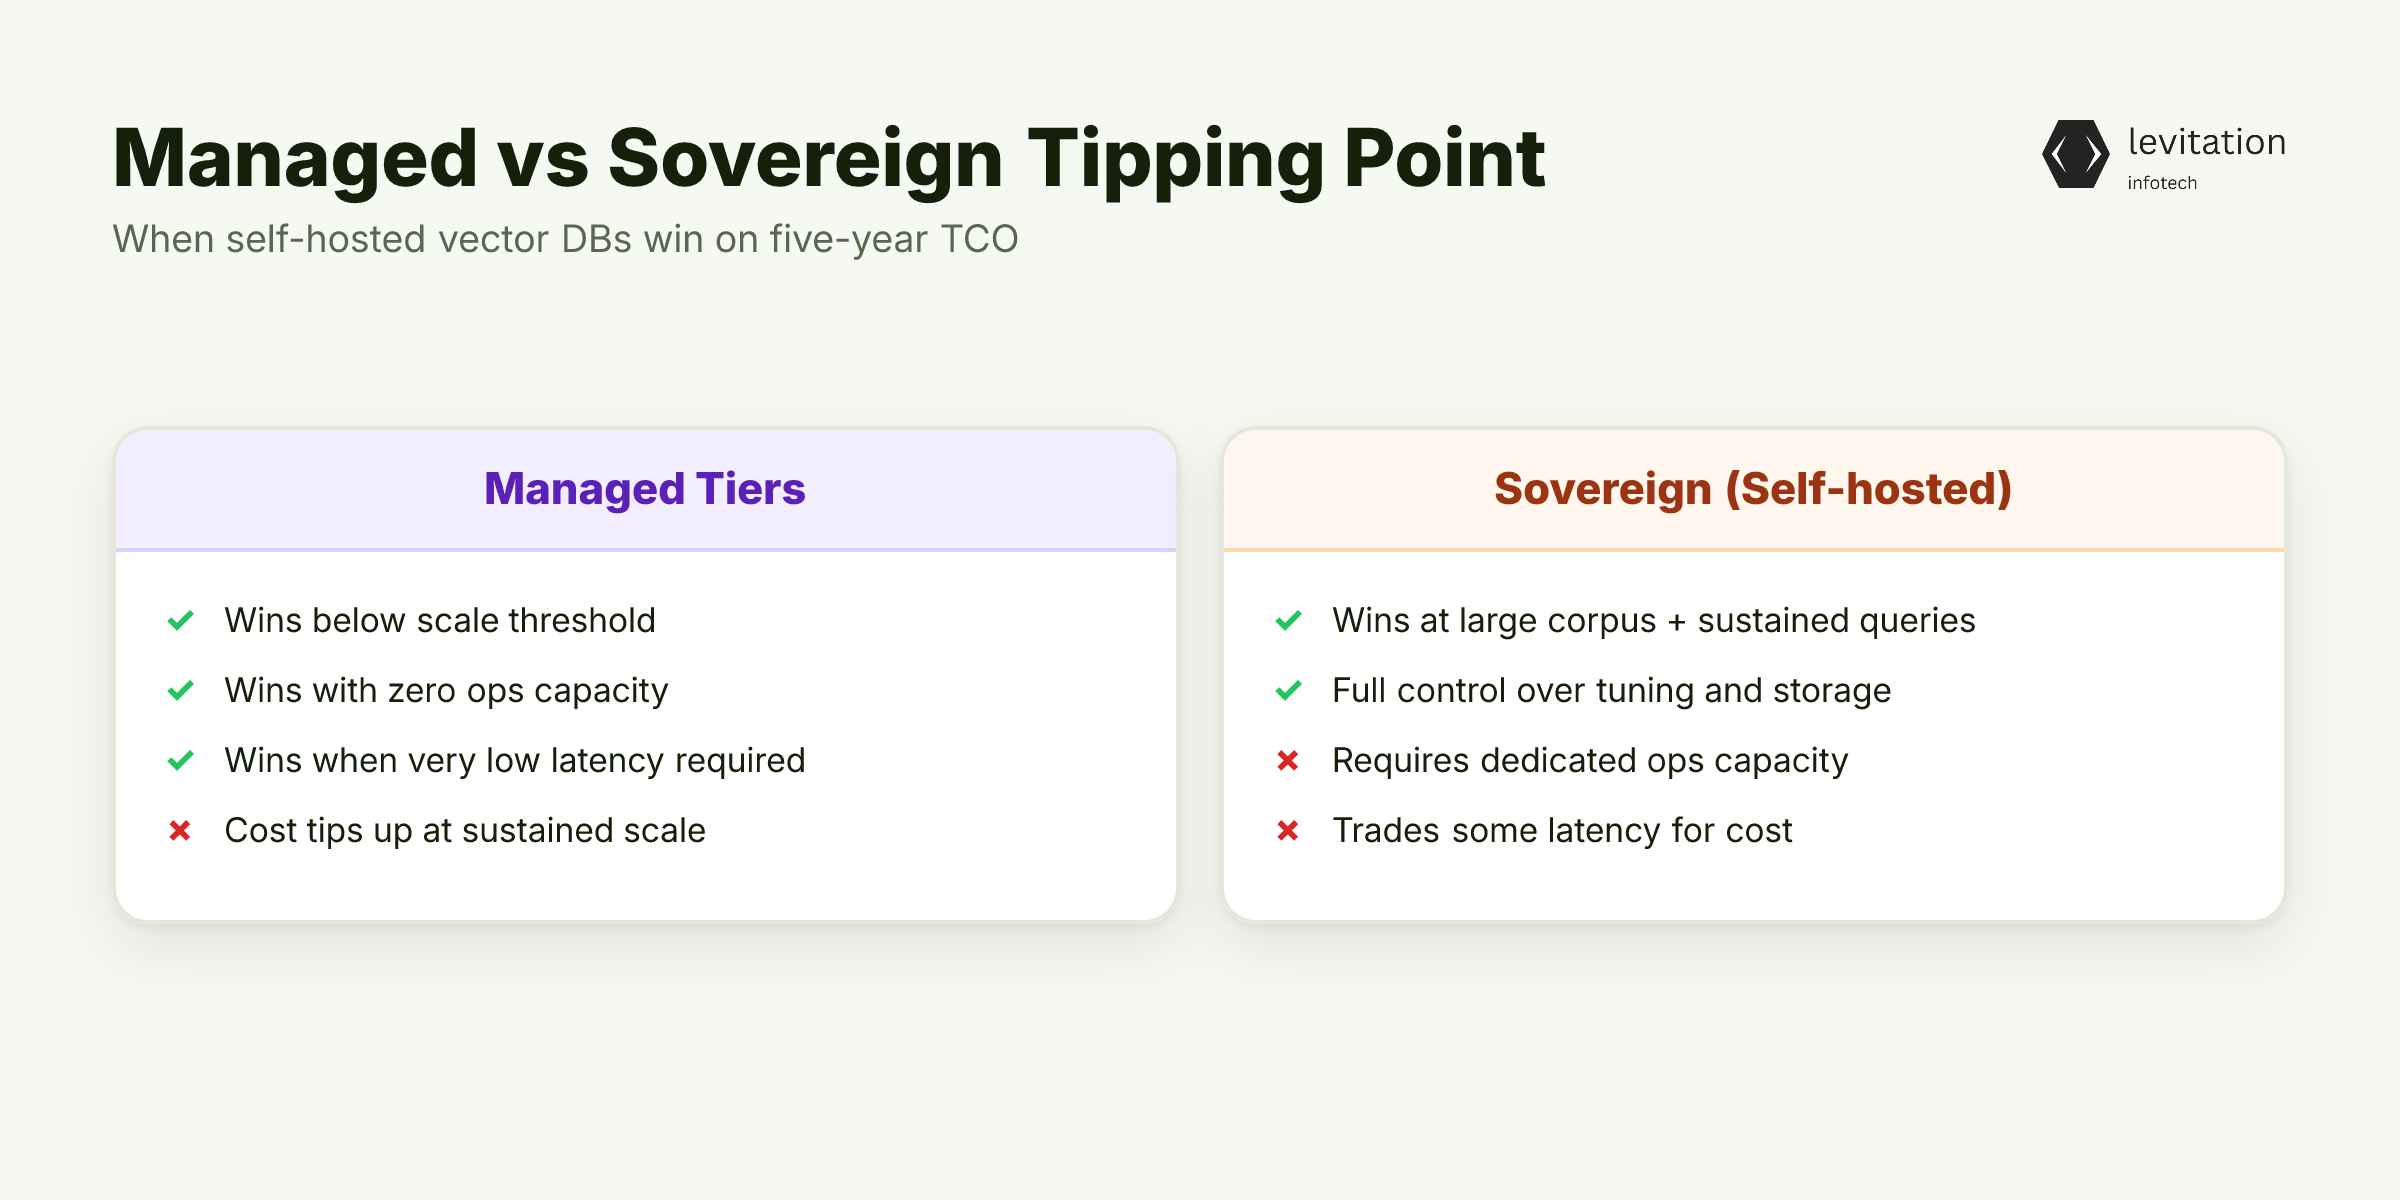
The breakeven for self-hosted Qdrant or Weaviate versus managed tiers depends on three factors. Those are query volume, corpus size, and engineering capacity. Above certain managed spend thresholds, infrastructure cost tips toward sovereign stacks. Below those thresholds, the engineering time of self-hosting tips back toward managed.
Vector database benchmark data tells only part of the story. The benchmark shows throughput. The TCO model shows what the throughput costs over five years. Teams that mix up the two end up with a fast database they cannot afford.
The tipping point depends on three variables: - Corpus size: at enough scale with sustained query volume, sovereign stacks win on infrastructure cost - Engineering capacity: if you have zero ops capacity, managed wins regardless of corpus size - Query latency tolerance: S3 Vectors trades some latency for storage cost. If you need very low latency, the math changes
S3 Vectors does not eliminate the five TCO multipliers. Embedding generation still applies. Re-indexing still applies. Egress and tuning still apply. The disruption is in storage economics, not in the operational model.
S3 Vectors is a disruptive entrant, but it does not fix the operational multipliers. The next question is how to read a benchmark without lying to yourself.
How to Read a Vector Database Benchmark Without Lying to Yourself
Most vendor benchmarks use batch sizes and query distributions that do not match production traffic. The numbers look great in a slide deck. They fall apart the first week of real load.
The right benchmark matches your actual filter cardinality, hybrid query ratio, and tail-latency SLA. Anything else is marketing.
The recall number deserves special attention. ANN-benchmarks report recall against ground truth. Production systems need recall measured against user satisfaction.
The two differ in three ways. First, query distributions shift. Second, users phrase questions unexpectedly. Third, the embedding model does not generalize to your domain. High recall against ground truth can lead to lower user satisfaction in production.
Three rules make a benchmark honest: - Match the batch size and concurrency to your peak production traffic - Include hybrid queries and filtered queries in proportion to your real workload - Measure recall against a labeled sample of your actual user queries, not a public dataset
A benchmark run against 1M vectors tells you little about 50M-vector performance. Index structure behavior changes at scale. HNSW graphs look identical at small corpus sizes. At 50M and beyond, they differ in memory pressure, shard distribution, and query routing.
The hidden latency secret slowing your vector search usually surfaces only at the size you actually need to run. The only way to know which database actually wins at 50M vectors is to model the workload. Not the marketing workload. That model takes 30 minutes.
Build a TCO Model Your CFO Will Sign in 30 Minutes
Model five line items. Not three. Not the license and storage. Five. - Storage, at your actual vector count and dimensionality - Compute and queries, at your peak daily query volume and hybrid query ratio - Embedding generation, including the re-indexing events you project over five years - Re-indexing events, counted by frequency and engineering hours used - Engineering hours, for ongoing tuning, schema changes, and recall engineering
Project each line item at 10M, 50M, and 100M vectors. The 4.1x spread appears between the mid and upper tiers. Most teams build the model at 10M and assume the curve is linear.
It is not. The 4.1x spread is what you miss when you skip the 50M projection.
RAG architecture decisions shape the embedding generation line more than any vendor choice. Retrieval depth, chunking strategy, and context window all change the embedding bill. These are RAG architecture decisions, not vector database decisions, and they belong in the TCO model.
Allocate engineering hours carefully. A fractional FTE on managed services. Closer to a full FTE on self-hosted. Convert those hours to dollars using fully loaded cost. That includes benefits, overhead, and equipment. Compare to a managed line item. Using base salary makes self-hosting look artificially cheaper.
Once the model exists, the deployment decision gets shorter, not longer. And the outcome looks different than a pricing shootout would suggest.
What Changes When You Model TCO Before You Model the Schema
The enterprise AI deployment patterns that survive five years in production all share one trait. The cost ceiling was modeled, not guessed.
Teams that model before they build reach production faster. Teams that guess spend extra quarters re-architecting after the first cost surprise.
The acceleration comes from skipping the re-architecture that follows every cost surprise. Systems still running in production five years after deployment still exist. They exist because someone ran the numbers when it was cheap to change the design.
Three shifts happen when the TCO model leads: - Deployment timelines compress because schema and architecture align with cost projections - Production systems stay live past year three because the cost ceiling is sized to actual traffic growth - Vendor conversations shift from license negotiation to operational model design
Teams that model first ship faster and stay longer. Teams that guess pay the 4.1x spread. They spend year two rebuilding what year one should have built right.
Frequently Asked Questions
How much does a vector database really cost at 50M vectors?
Across Pinecone, Weaviate, Qdrant, Milvus, and S3 Vectors, the five-year TCO spread is roughly 4.1x. This holds at 50M vectors with sustained daily query volume. The license fee is a minor share of the total bill. The variance comes from embedding generation, re-indexing events, and operational tuning.
Is S3 Vectors cheaper than Pinecone at scale?
For larger corpora with moderate query latency tolerance, S3 Vectors typically beats Pinecone Serverless. This is true for raw storage and read cost. The gap narrows once you factor in embedding generation, cross-region traffic, and re-indexing.
What is the biggest hidden cost in vector database pricing?
Embedding generation. At 50M vectors, embedding fees can exceed the base database bill. Re-indexing events and index rebuilds are the second and third largest hidden costs. Pricing comparisons typically exclude them.
How often do production teams re-index their vector database?
Most teams re-index at least once in the first 18 months, usually when upgrading embedding models. Each re-index event on a 50M vector corpus uses engineering time plus hours-to-days of degraded query performance.
When does self-hosting a vector database beat managed SaaS?
The breakeven depends on managed spend levels and engineering capacity. Below low managed spend, the engineering time of self-hosting outweighs the infrastructure savings. Above higher thresholds, self-hosting wins on infrastructure cost.
Model before procurement. The vendor decision gets shorter, not longer.
About the author
Mayank Singh is a software developer at Levitation Infotech, where he builds web and AI-powered applications across the company’s fintech, healthcare, and enterprise projects.