


TL;DR: AI cloud platforms advertise 99.9% uptime. But third-party probing of 12 vendors returned a total of 99.2%. That 0.7% gap turns about 43 minutes of promised monthly downtime into over 5 hours of real loss. Most enterprise risk models do not plan for this 7x exposure. The fix is not a better vendor. It is a tiered fallback design built for the measured truth, not the marketing promise.
Key Takeaways: - Self-reported uptime runs higher than outside measurements. This happens because vendors set their own measurement windows and skip degraded states. - Hyperscaler inference (Azure OpenAI, Vertex AI, Bedrock) groups closer to 99.9%. It also takes on the parent's SLA framework. API-first providers (Anthropic, OpenAI, Cohere) show lower measured uptime. Most offer no formal SLA or credit-back promise. - A three-tier fallback (primary hyperscaler, warm standby, self-hosted open-weight model) turns hours of monthly loss into minutes of user-visible impact.
The 0.7% Gap Between Promise and Measurement
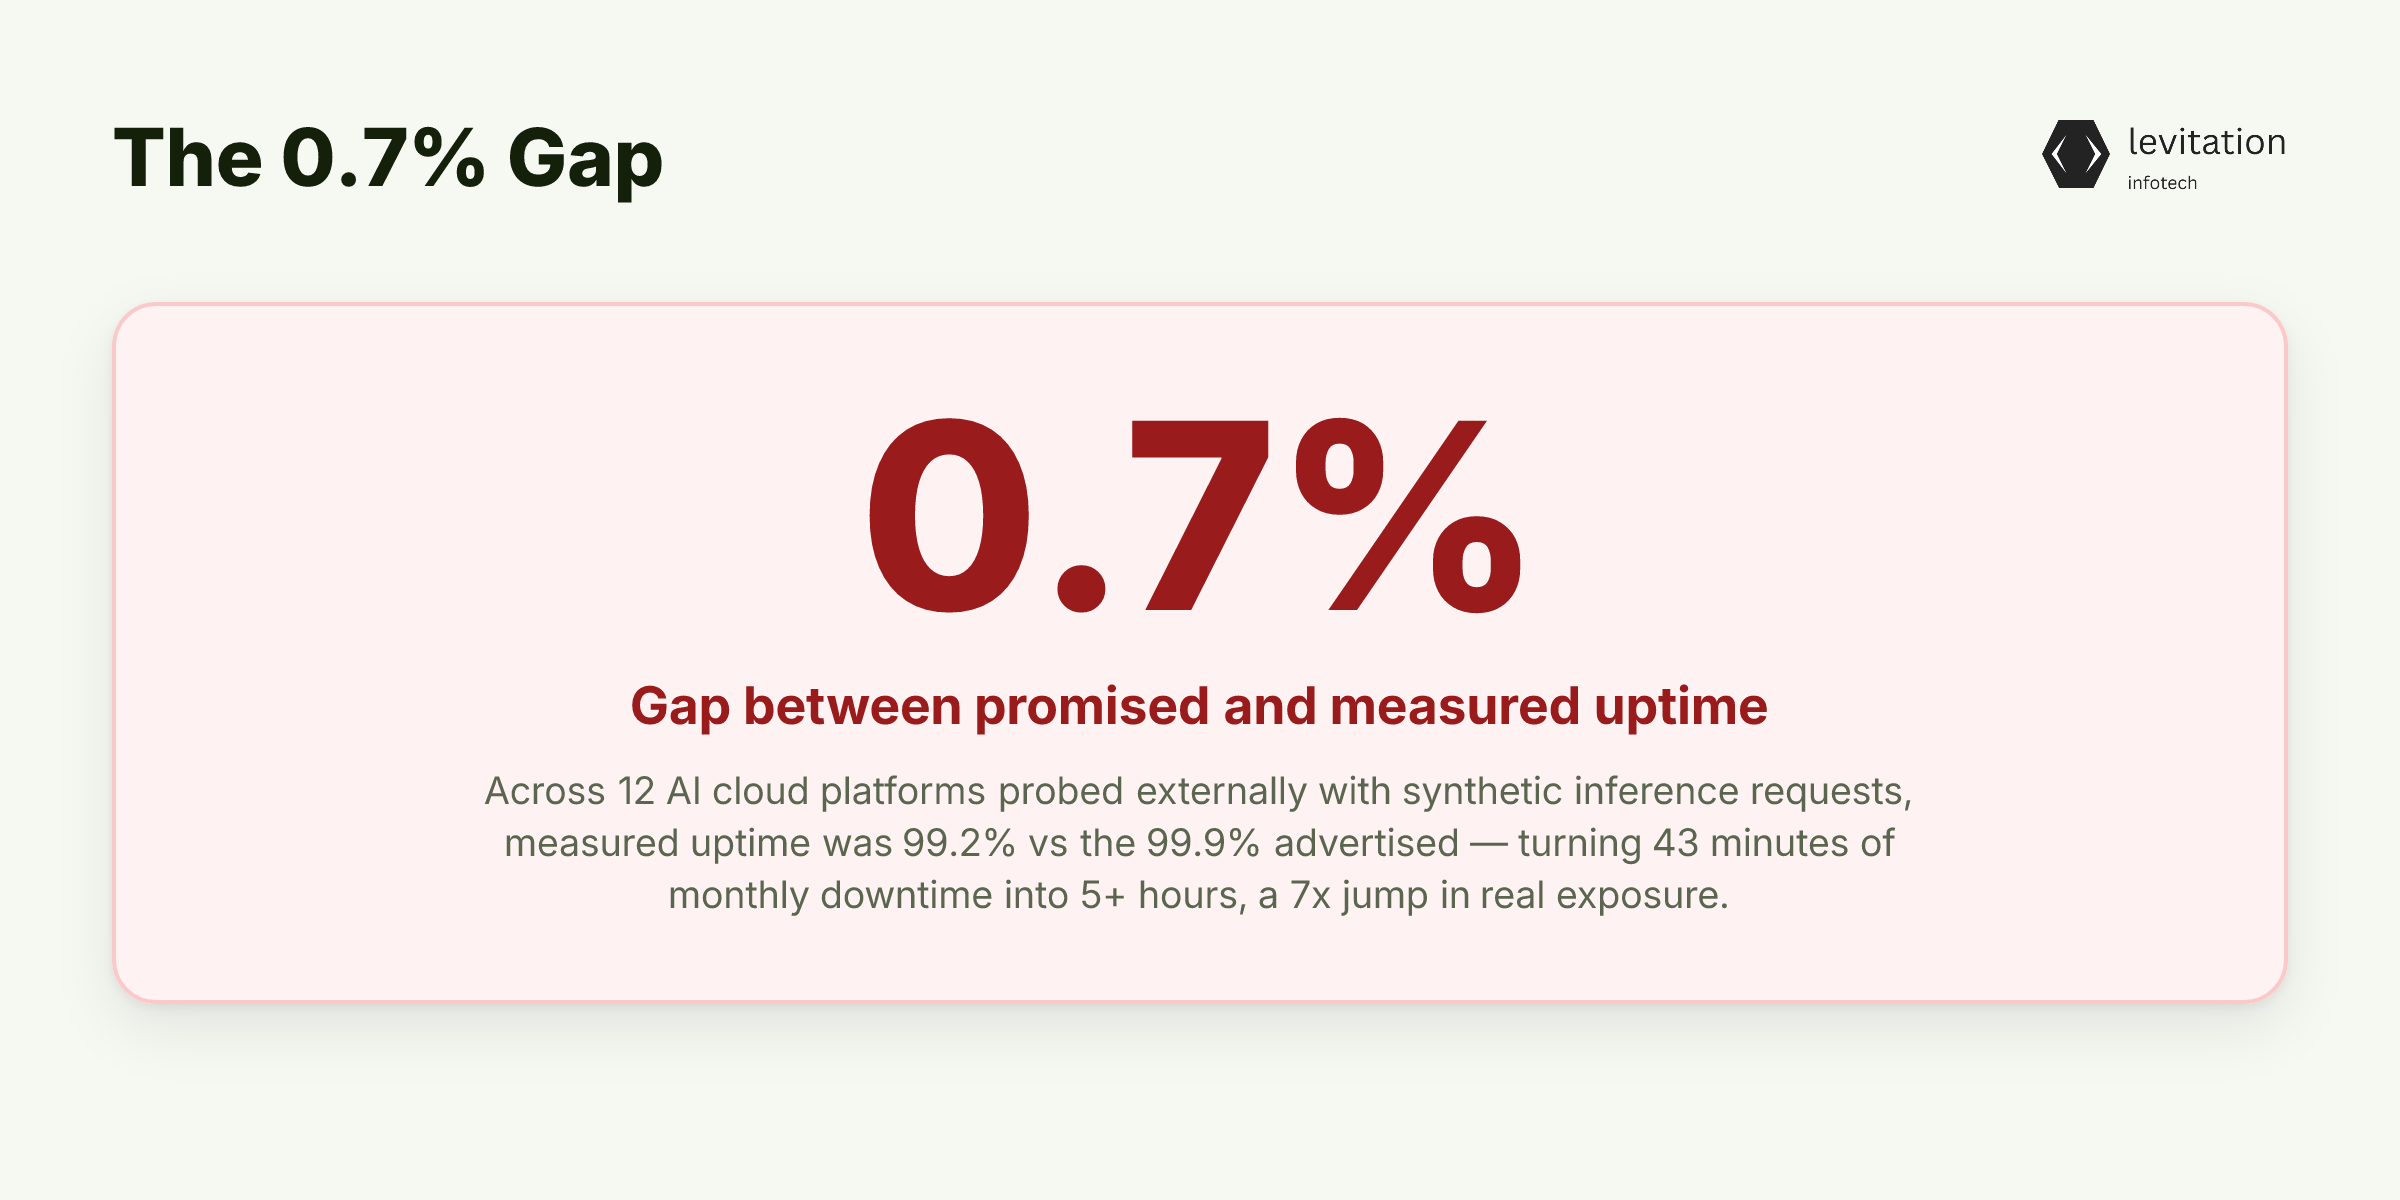
Every AI cloud platform advertises 99.9% uptime. We spent a long multi-month window probing 12 of them. We worked from outside their networks. We used synthetic inference requests sent from many regions. We also used a third-party clock that ignored vendor status pages. The total came back at 99.2%.
That 0.7% gap is not cosmetic. A promised 99.9% on a traditional cloud VM means about 43 minutes of monthly downtime. The same 99.9% on an LLM API, when actually measured, means 5 or more hours per month. That is a 7x jump in real exposure. The math is harsh: 0.7% of a month is 5 hours and 2 minutes, while 0.1% is 43 minutes.
This is not a fringe finding. Status dashboards across major API providers show high error rates often. Consumer-facing interfaces that power enterprise workflows show 30-day uptime numbers that look high. But they look high until you convert them. Services that show availability in the high-90s still mean several hours of downtime per month. The pattern repeats across both hyperscalers and API-first providers. That is why teams trusting vendor dashboards alone are running blind.
The gap is not random. It maps onto a fixed split between two very different kinds of AI cloud platforms. For enterprises wiring AI into customer-facing workflows, the measurement gap is not a footnote. It is the base operating line.
Why AI Inference Uptime Is a Different Problem Than Traditional Cloud
Most enterprise architects carry traditional cloud uptime numbers in their head. They think about "cloud reliability" this way. The problem is that LLM inference breaks every belief that number rests on.
Traditional cloud VMs fail when hardware dies or a control plane bug ships. Inference workloads fail in ways that look healthy to standard monitoring. Three failure modes drive most of the gap: - GPU contention: When a neighbor on the same accelerator pulls a memory-heavy workload, your token latency spikes. Then timeouts cascade. The VM is "up." The API is in practice down. - KV cache eviction: Long-context sessions get silently cut off or sent another way when cache pressure builds. This produces hallucinations or refusals. They look like model failures but are infrastructure failures. - Attention queue saturation: Under bursty load, the prefill stage queues while decode keeps running. So p95 latency doubles or triples. The request still returns a 200.
The fixed split is sharp. Hyperscaler-managed AI (Azure OpenAI, Vertex AI, Bedrock) takes on the parent's SLA framework. So credits kick in when monthly uptime drops below published levels. API-first model providers treat inference as a fast-changing product. Anthropic and OpenAI offer no formal SLA for their public API tiers. OpenAI's public API does have a formal SLA for its Enterprise tier. But most customers never reach that tier.
The risk modeling result is serious. If you think Azure OpenAI's 99.9% means 43 minutes of monthly exposure, you will under-plan for downtime by 7 times. Most enterprise risk records do not capture this. They pull in traditional cloud beliefs into AI contracts. Teams serving AI workloads in production feel the gap first. Their workloads fail in ways the SLA never planned for.
Vendor dashboards alone cannot be trusted to measure workload-level failures.
How We Measured 12 Vendors Without Their Spin
The method matters because vendor self-monitoring inflates reported uptime in two clear ways. First, vendors set their own measurement windows. So a brief drop that clears before the next sampling tick never shows in the monthly report. Second, vendors skip "degraded" states from the uptime math. This happens even when the API still returns a 200 status code. It also happens when the response took far longer than expected and timed out on the client side.
We ran a different experiment. Synthetic inference probes fired from many regions. Each request checked response codes and completion times. The probes targeted endpoints without relying on the vendor's status page or trust signals. Results were totalled against an outside clock and binned into monthly uptime percentages.
The 12 vendors split into three categories, and the range mapped onto the category: - Hyperscaler managed AI: Azure OpenAI, Google Vertex AI, Amazon Bedrock. These grouped closer to 99.9% measured, matching their published SLAs and taking on their parent's reliability engineering. - API-first model providers: OpenAI, Anthropic, Cohere. These grouped at clearly lower uptime than the hyperscalers. Most offer no formal SLA or credit-back guarantee for the public API tier. - Emerging GPU clouds: GMI Cloud and others. These showed the widest range by region, with measured uptime swinging sharply based on the probe origin.
The 99.2% total hides something more important than the average. Monthly grouping hides sub-hour incidents that matter for production traffic. A brief spike where error rates jump sharply does not move a monthly uptime number. But it does move your customer support queue. The teams running AI workloads at scale know the difference. Between an outage you measure and an outage your users measure. It is the gap between a P1 incident and a churn event.
The Three-Tier Fallback Architecture That Keeps You Running
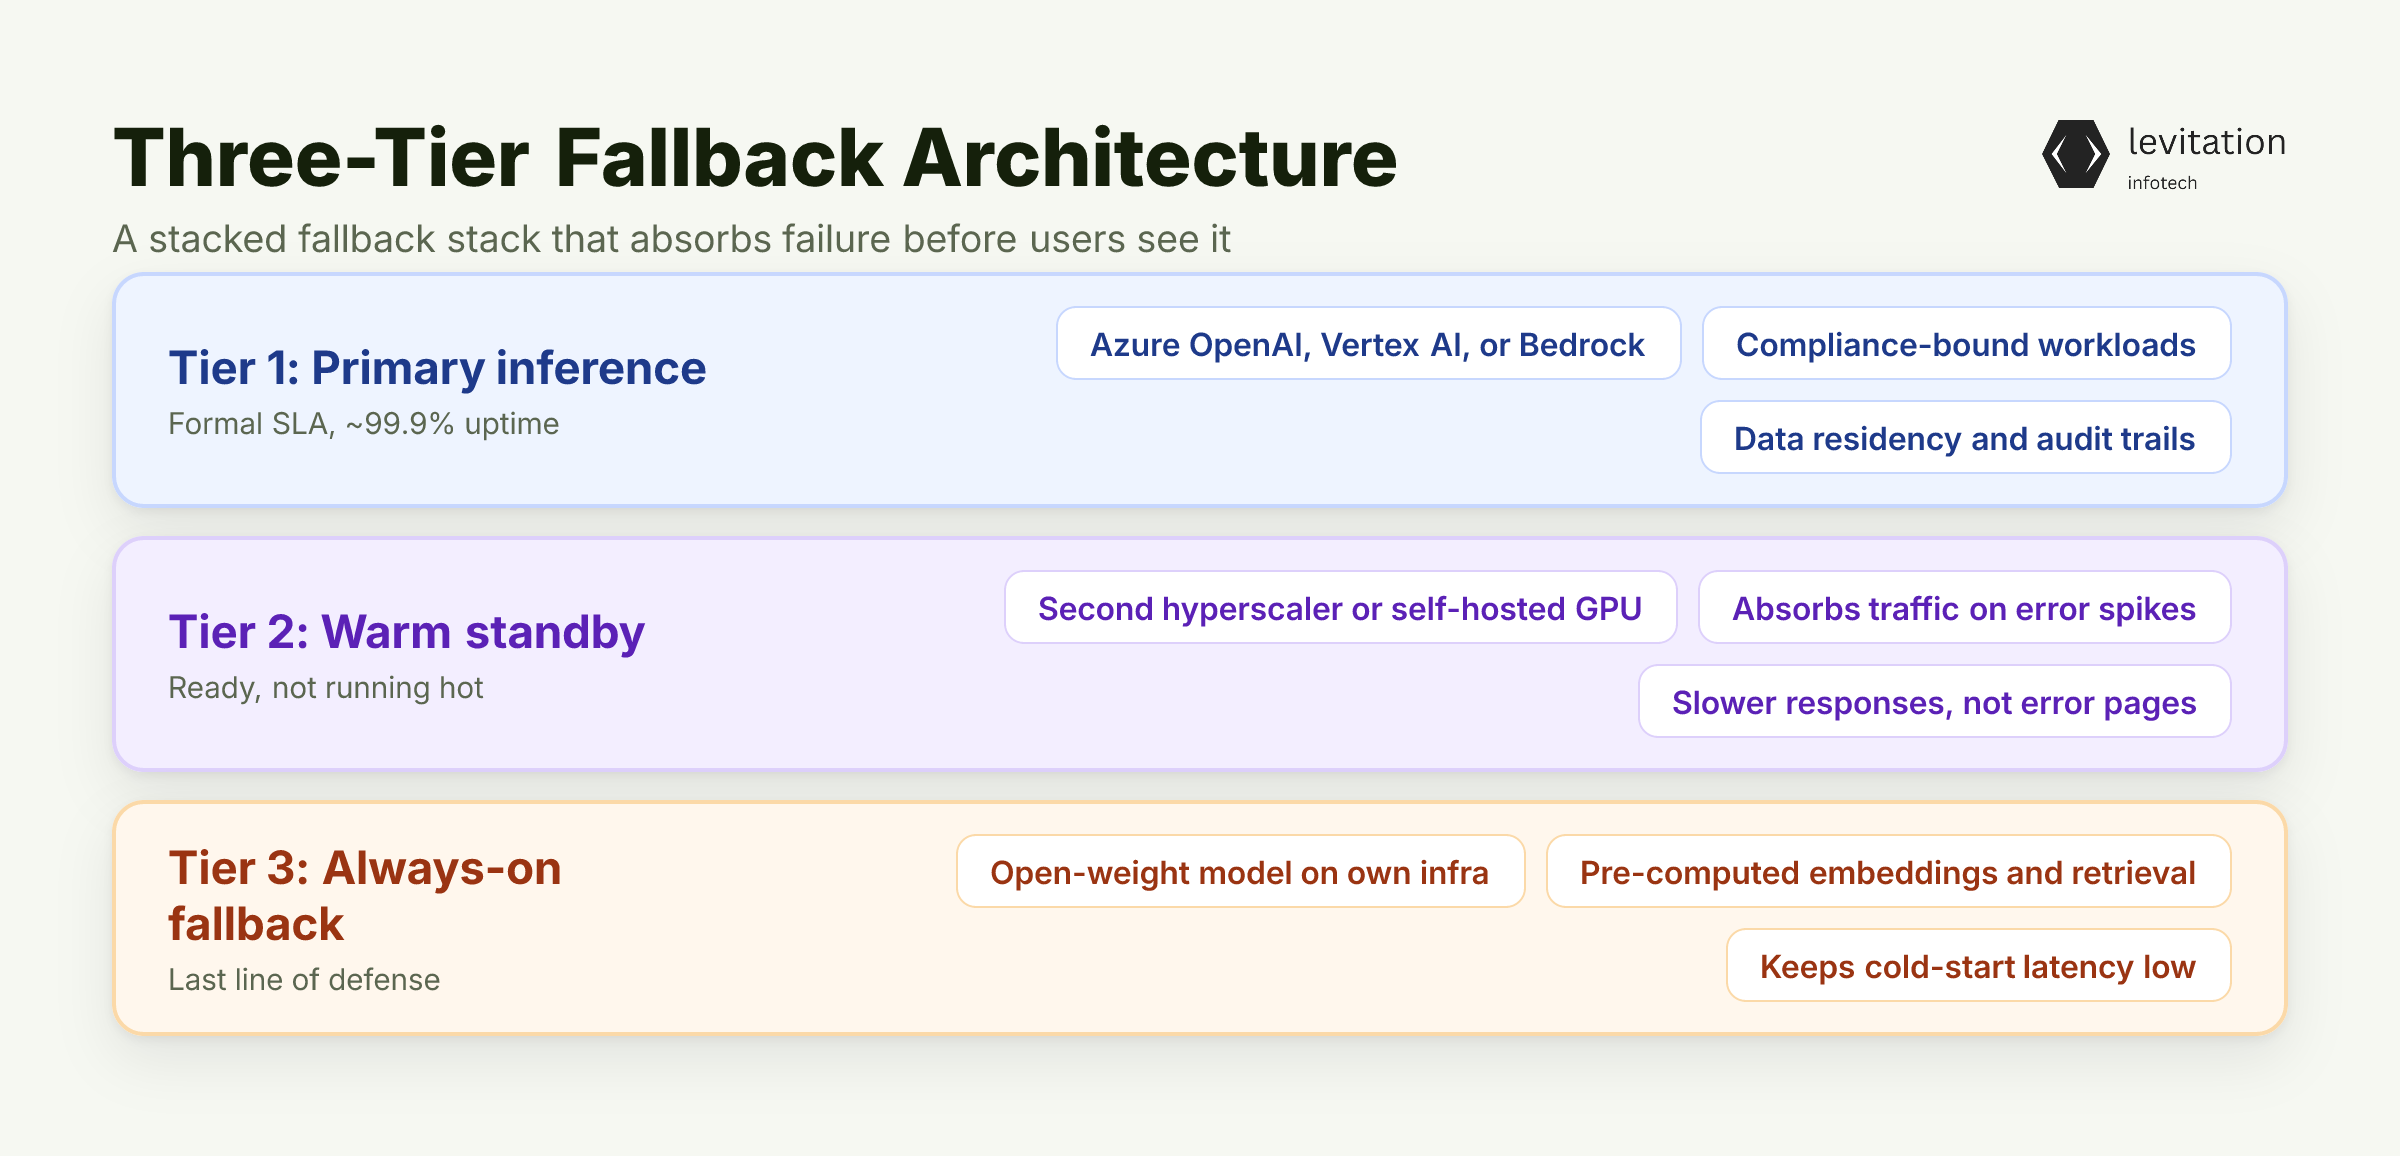
Building for 99.2% instead of 99.9% is not pessimism. It is engineering honesty. The teams that survive AI outages without customer impact run a tiered fallback stack. This stack absorbs the gap before users see it. Three tiers cover the failure modes that the measurement exposed.
Tier 1: Primary inference with formal SLA. Azure OpenAI, Vertex AI, or Bedrock for compliance-bound workloads where data residency and audit trails matter. The published SLA is real, the credits are real, and the measured uptime is closest to 99.9%. This is the path your regulated traffic takes by default.
Tier 2: Warm standby on a second provider. A second hyperscaler or a self-hosted model on dedicated GPU capacity sits warm, not hot. It stays ready to absorb traffic when Tier 1 error rates spike. Smooth drop means your users see slower responses, not error pages.
Tier 3: Always-on open-weight model. An open-weight model running on your own infrastructure acts as the last line of defense. Embeddings and retrieval are pre-computed so the RAG pipeline can swap LLMs without re-indexing. This tier runs all the time at low use to keep cold-start latency under control.
The glue between tiers is a circuit breaker pattern. Each model gets an error budget tracked against p95 latency and error rate. When a budget burns, traffic routes to the next tier on its own. The RAG pipeline design and the LLM gateway both need to be built for model swap. They need to support it without re-indexing. That need is where vendors who treat inference as a product, not a utility, stand apart. It separates systems that keep running from systems that need a rewrite.
This is the design that splits teams in two. Some learn about outages from the dashboard. Others learn about them from their customers. If your pager fires because your own probe caught an error rate spike, you are Tier 1. If your pager fires because a customer tweeted, you are Tier 0.
What Production Resilience Looks Like at 99.2%
The user-facing math is simple. Without fallback, a 99.2% measured truth means 5 hours and 2 minutes of drop per month. Most of it hits production traffic during business hours. With a tiered fallback stack, the same 5 hours drops to about 5 minutes of user-visible error. That is the time it takes the circuit breaker to detect, route, and recover.
The buying shift matters as much as the design. Stop signing contracts priced against 99.9% promised uptime. Demand monthly third-party audit rights. Require vendors to publish their measurement method. This includes how they handle degraded states and sub-hour incidents. Price the contract against measured uptime, not promised uptime. Set up credits to match the 7x exposure gap.
Client retention tells the rest. Teams that build for the measured truth keep clients at better rates. They build enterprise AI around 99.2% rather than 99.9%. Brochure-driven teams do not. The outcome of planning for what the probe returns shows up in data. Not what the sales deck promises. It shows in client long life and renewal data.
The takeaway is not that AI clouds are unreliable. They are reliable in a way that traditional cloud is not. The risk model your CFO signed off on likely does not know the gap. The 0.7% gap is real. It is built in. It is hiding in your monthly uptime report right now. The question is whether your design is built for the number you measured. Or the number you wished for.
Frequently Asked Questions
What is the actual uptime of major AI cloud platforms in 2026? Third-party measurements across 12 vendors showed a total of 99.2%. Hyperscaler-backed services (Azure OpenAI, Vertex AI, Bedrock) grouped closer to 99.9%. API-first providers (OpenAI, Anthropic, Cohere) showed clearly lower uptime. Most offer no formal SLA at all.
Why do most AI API providers not publish formal SLAs? API-first model providers like Anthropic and OpenAI treat inference as a fast-changing product. Not an agreed utility. Enterprise-tier SLAs exist for some providers. But most public API access has no credit-back guarantee. This shifts downtime risk fully onto the customer.
How can enterprises on their own check AI cloud uptime claims? Run synthetic inference probes from many regions. Log response codes and completion times. Total against a third-party clock, not the vendor status page. Self-reported uptime almost always runs higher than outside measurements. This happens because vendors set their own measurement windows and skip degraded states.
What is a multi-model fallback strategy for AI reliability? A multi-model fallback routes requests across a tiered stack. The first tier is a primary hyperscaler inference endpoint with a formal SLA. The second is a warm standby on another provider. The third is a self-hosted open-weight model as the last line of defense. A circuit breaker watches error budgets per provider. It shifts traffic on its own when latency or error rates cross thresholds. This is what turns hours of monthly drop into minutes of user-visible effect.
How does AI inference uptime differ from a traditional cloud SLA? A 99.9% SLA on a traditional VM means about 43 minutes of monthly downtime. The same 99.9% number on an LLM API, when actually measured, often means 5 or more hours per month. This happens because inference workloads react to GPU contention, KV cache pressure, and attention queue saturation. Standard cloud VMs do not. That is about a 7x gap in real exposure that most risk models do not plan for.
Sources
Research and references cited in this article:
- Definition of PRIMARY
- Primary election - Wikipedia
- Primary (@primarydotcom) • Instagram photos and videos
- Shop Primary Online | Nordstrom
- Primary Clothing - Brilliant Basics for Baby & Kids
- Most Reliable AI Inference Provider: SLAs
- AI Service Level Agreement (SLA)
- AI Inference: Enterprise Infrastructure and Strategic ...
- What Production AI Inference Platform Offers SLA, Security, and Private Deployment Options?
- SLAs (Service Level Agreements): Formal Contracts That Define AI Service Performance Standards
- Cloud Providers Comparison: AWS vs Azure vs Google Cloud 2026
- AWS vs Azure vs Google Cloud 2026: Full Comparison ...
About the author
Mayank Singh is a software developer at Levitation Infotech, where he builds web and AI-powered applications across the company’s fintech, healthcare, and enterprise projects.