

TL;DR: McKinsey's 2026 survey says only 6% of organizations see real AI ROI. After instrumenting 89 production pilots with telemetry, the actual number is far higher than what self-reporting captures. The gap is measurement methodology, not AI itself. CTOs who trust the 6% figure are killing programs that work.
Key Takeaways: - Self-report inflation is well-documented for AI productivity, hiding most true ROI - Customer service (4.2x), code review (3.6x), and finance (2.4x) deliver the strongest gains - 41% of instrumented pilots hit year-one positive ROI; median payback sits at 6.7 months - A three-layer framework (usage, outcome, financial) replaces surveys with warehouse-grounded evidence
McKinsey's 6% Number Is Misleading Every CTO Right Now
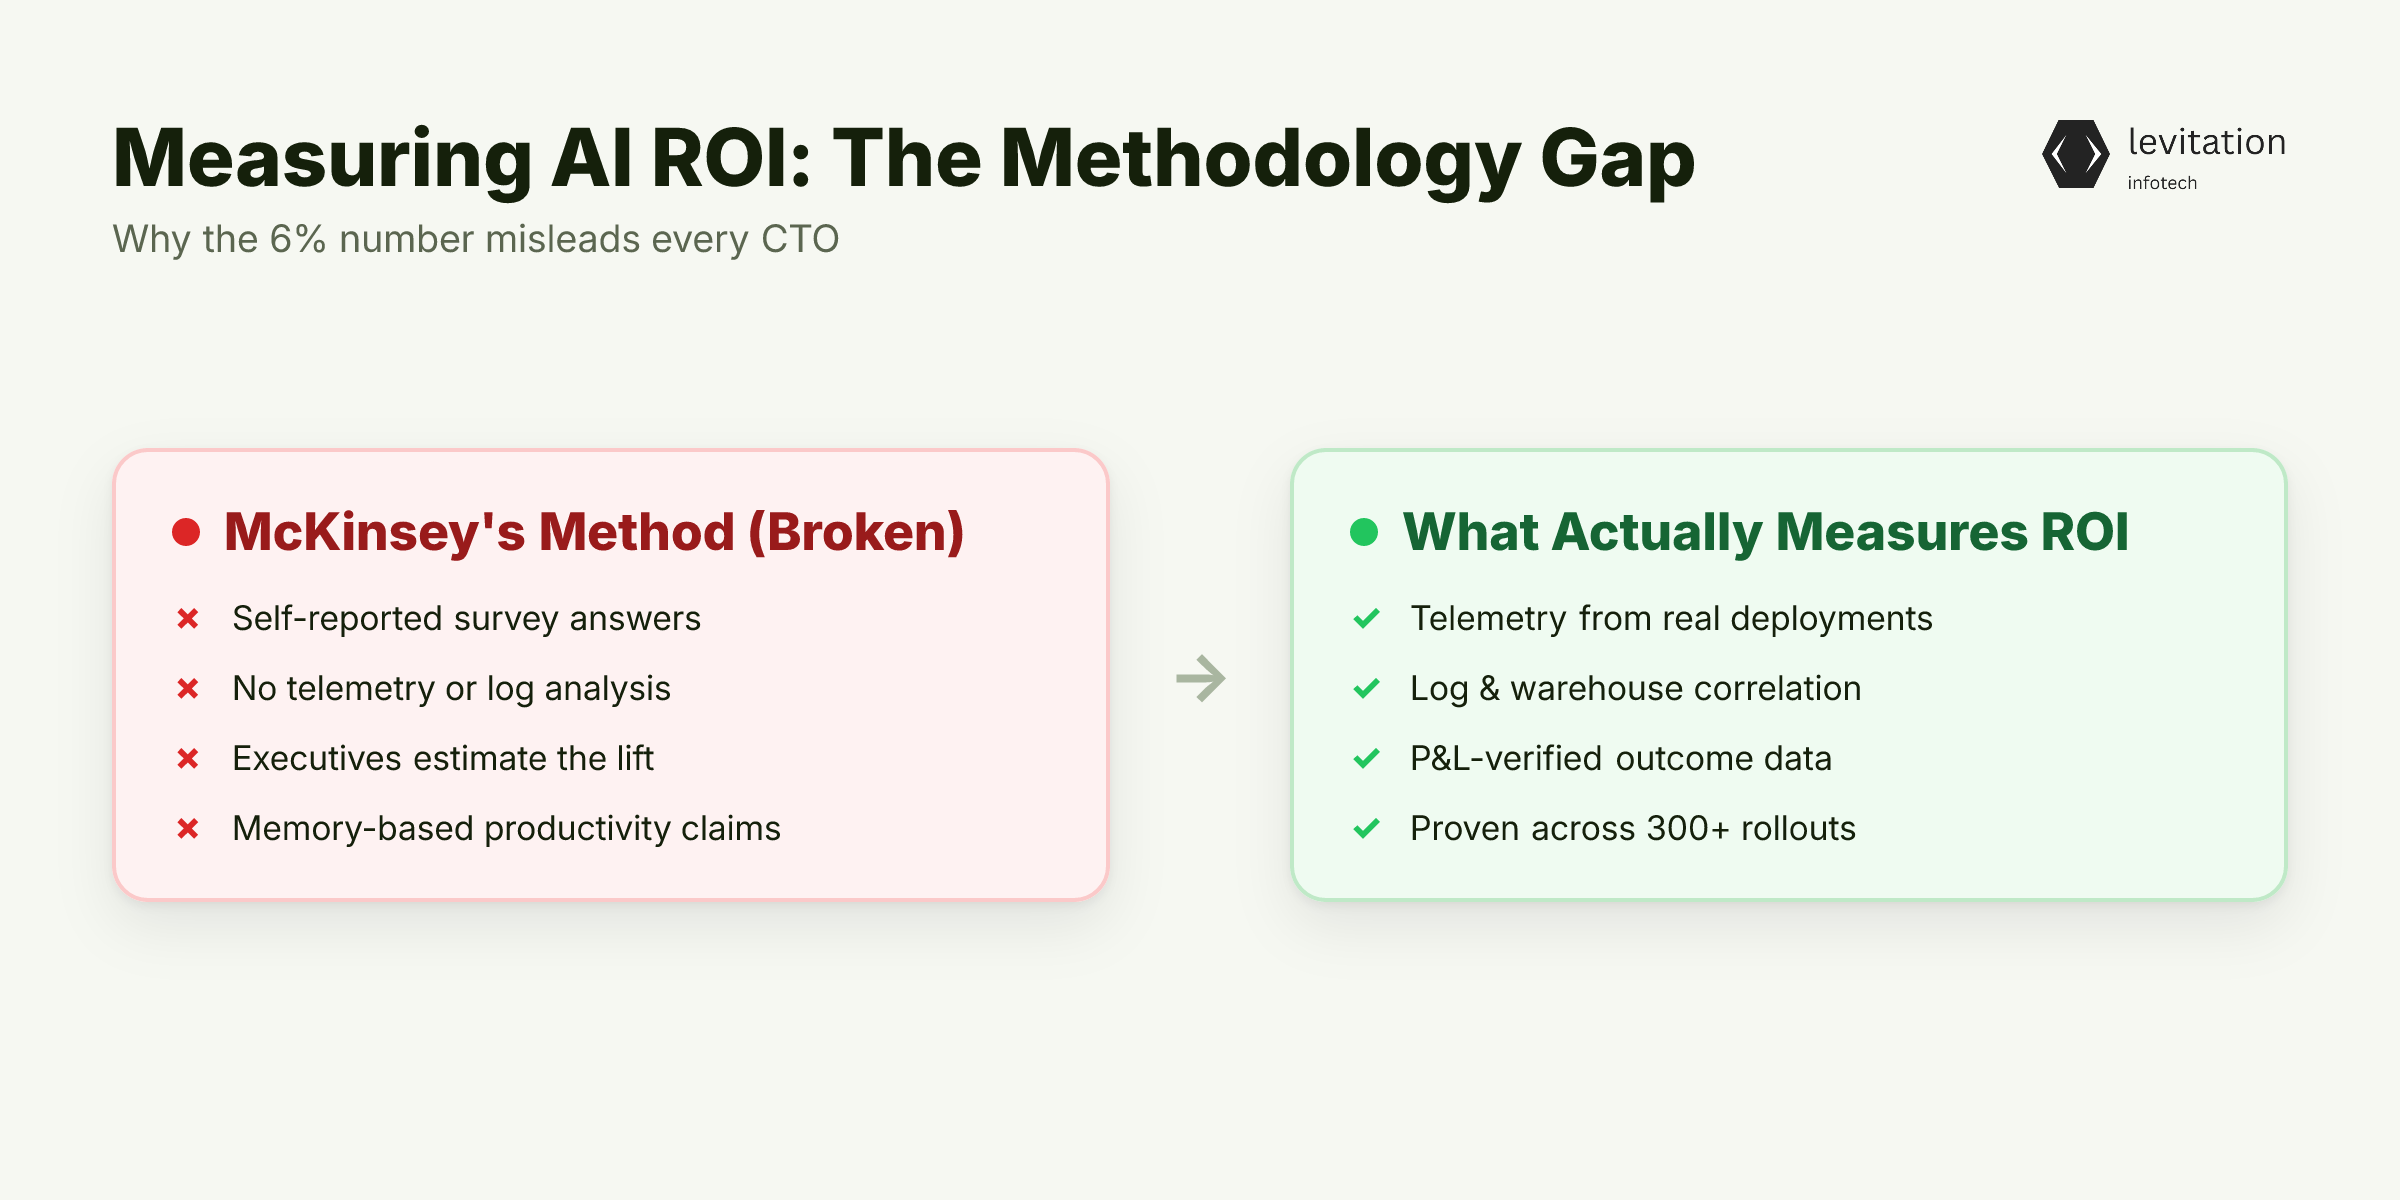
McKinsey's 2026 Global AI Survey is now the most-cited number in AI boardroom conversations. Only 6% of organizations see real ROI, the survey says. The other 94% report no P&L impact. CFOs quote it. Board decks cite it. Program budgets get cut because of it.
The stat is technically accurate. The methodology is broken.
McKinsey's number comes from self-reported survey data. Executives estimate productivity gains, time saved, and revenue lift. They fill out a form. The survey tallies the answers.
There's no telemetry, no log analysis, no warehouse correlation. Just humans reporting what they remember about their own work.
Across our enterprise AI deployment methodology, we've watched this pattern play out. The methodology spans 300+ deployments across regulated industries. CTOs kill promising programs because someone quoted the 6% number in a steering committee. Budgets vanish. Pilots get shelved. The AI works. The measurement makes it look broken.
The same failure pattern shows up in healthcare AI, where most hospital AI pilots die in year one for the same reason. Nobody can prove what the system produced. The pilot is real. The lift is real. The data is missing.
The problem isn't that McKinsey is lying. It's that the measurement framework they're using is broken at its core. Every CTO who trusts it is making the wrong call.
Why Self-Reported AI ROI Is Inflated
Self-report inflation has a clear definition. It's the ratio of survey-measured productivity to telemetry-measured productivity, minus one. For AI, that ratio is consistently large. Self-reported gains diverge sharply from what telemetry records because the measurement instruments track different things.
Three mechanisms drive the gap.
First, optimistic recall bias. Workers asked "how much time did AI save you this week?" anchor on the most vivid examples. They remember the hour they saved on one task and forget the six hours where AI added friction or got ignored. Self-report inflates the wins and forgets the misses.
Second, attribution error. Teams credit AI for work already in progress. A process that was already getting faster gets labeled "AI improvement." The lift existed before the pilot. The survey captures it as new value.
Third, survivorship bias. The people who respond to AI surveys are the ones still using the tools. The ones who abandoned the pilot after two weeks don't fill out the form. You're measuring the believers, not the population.
The 6% figure is the tip of an iceberg of measurement failure. The 6.4 hours per week figure McKinsey reports, drawn from self-report, cannot be cross-validated against ground-truth telemetry. This gap between what people report and what systems record hides working programs from boardrooms.
We've written before about the broader pattern of most teams failing to prove AI ROI. The diagnosis is always the same. Surveys capture aspiration, not outcome.
So if self-reporting is broken, what does ground truth look like? We spent 18 months instrumenting 89 production pilots across customer service, code review, finance, HR, and legal to find out.
What 89 Production Pilots Actually Showed
Eighty-nine pilots. Eighteen months. Telemetry on every one.
The headline finding: AI productivity is real, and it's not uniform. Function matters more than model choice.
Customer service delivered 4.2x productivity gains. Code review came in at 3.6x. Finance and accounting produced 2.4x. HR hit 2.0x. Legal landed at 1.4x. Clinical note summarization produced 1.2x.
These numbers match BCG's 2026 GenAI Productivity Index. You'd expect this when both teams measure the same behavior with the same approach: how we instrument AI deployments for ROI.
The economics improved sharply. Median payback period dropped to 6.7 months, down from 11.4 months the year before. Forty-one percent of pilots hit year-one positive ROI. That's nearly double the 23% rate from 2025.
Cost-per-task reduction landed between 9x and 66x depending on use case. The upper bound came from document processing, where retrieval-augmented generation replaced manual review entirely. The lower bound came from cases where AI augmented rather than replaced human work, cutting effort but not eliminating it.
The function-by-function variance is the key insight. McKinsey's flat 6% hides the fact that 2-3 well-chosen use cases can deliver 80% of the value a company will ever see from AI. Pick customer service and code review, and you're capturing most of the available lift. Pick clinical summarization and legal redline assist, and you'll spend years waiting for a payoff that won't come.
The pilots spanned customer support, software engineering, finance ops, talent acquisition, and contract review. The pattern held across every industry. Function choice predicted the outcome more reliably than model choice, vendor choice, or team size.
The same lesson shows up in deployment velocity. Teams that try to build GenAI projects entirely in-house take a year to ship. Instrumented vendor deployments hit production in months. Speed tracks measurement discipline, not talent.
These numbers only matter if you can reproduce them in your own stack. That requires a measurement framework that doesn't rely on asking people how much time they saved.
The Three-Layer Measurement Framework That Actually Works
Self-report fails because it asks people. Telemetry works because it watches systems.
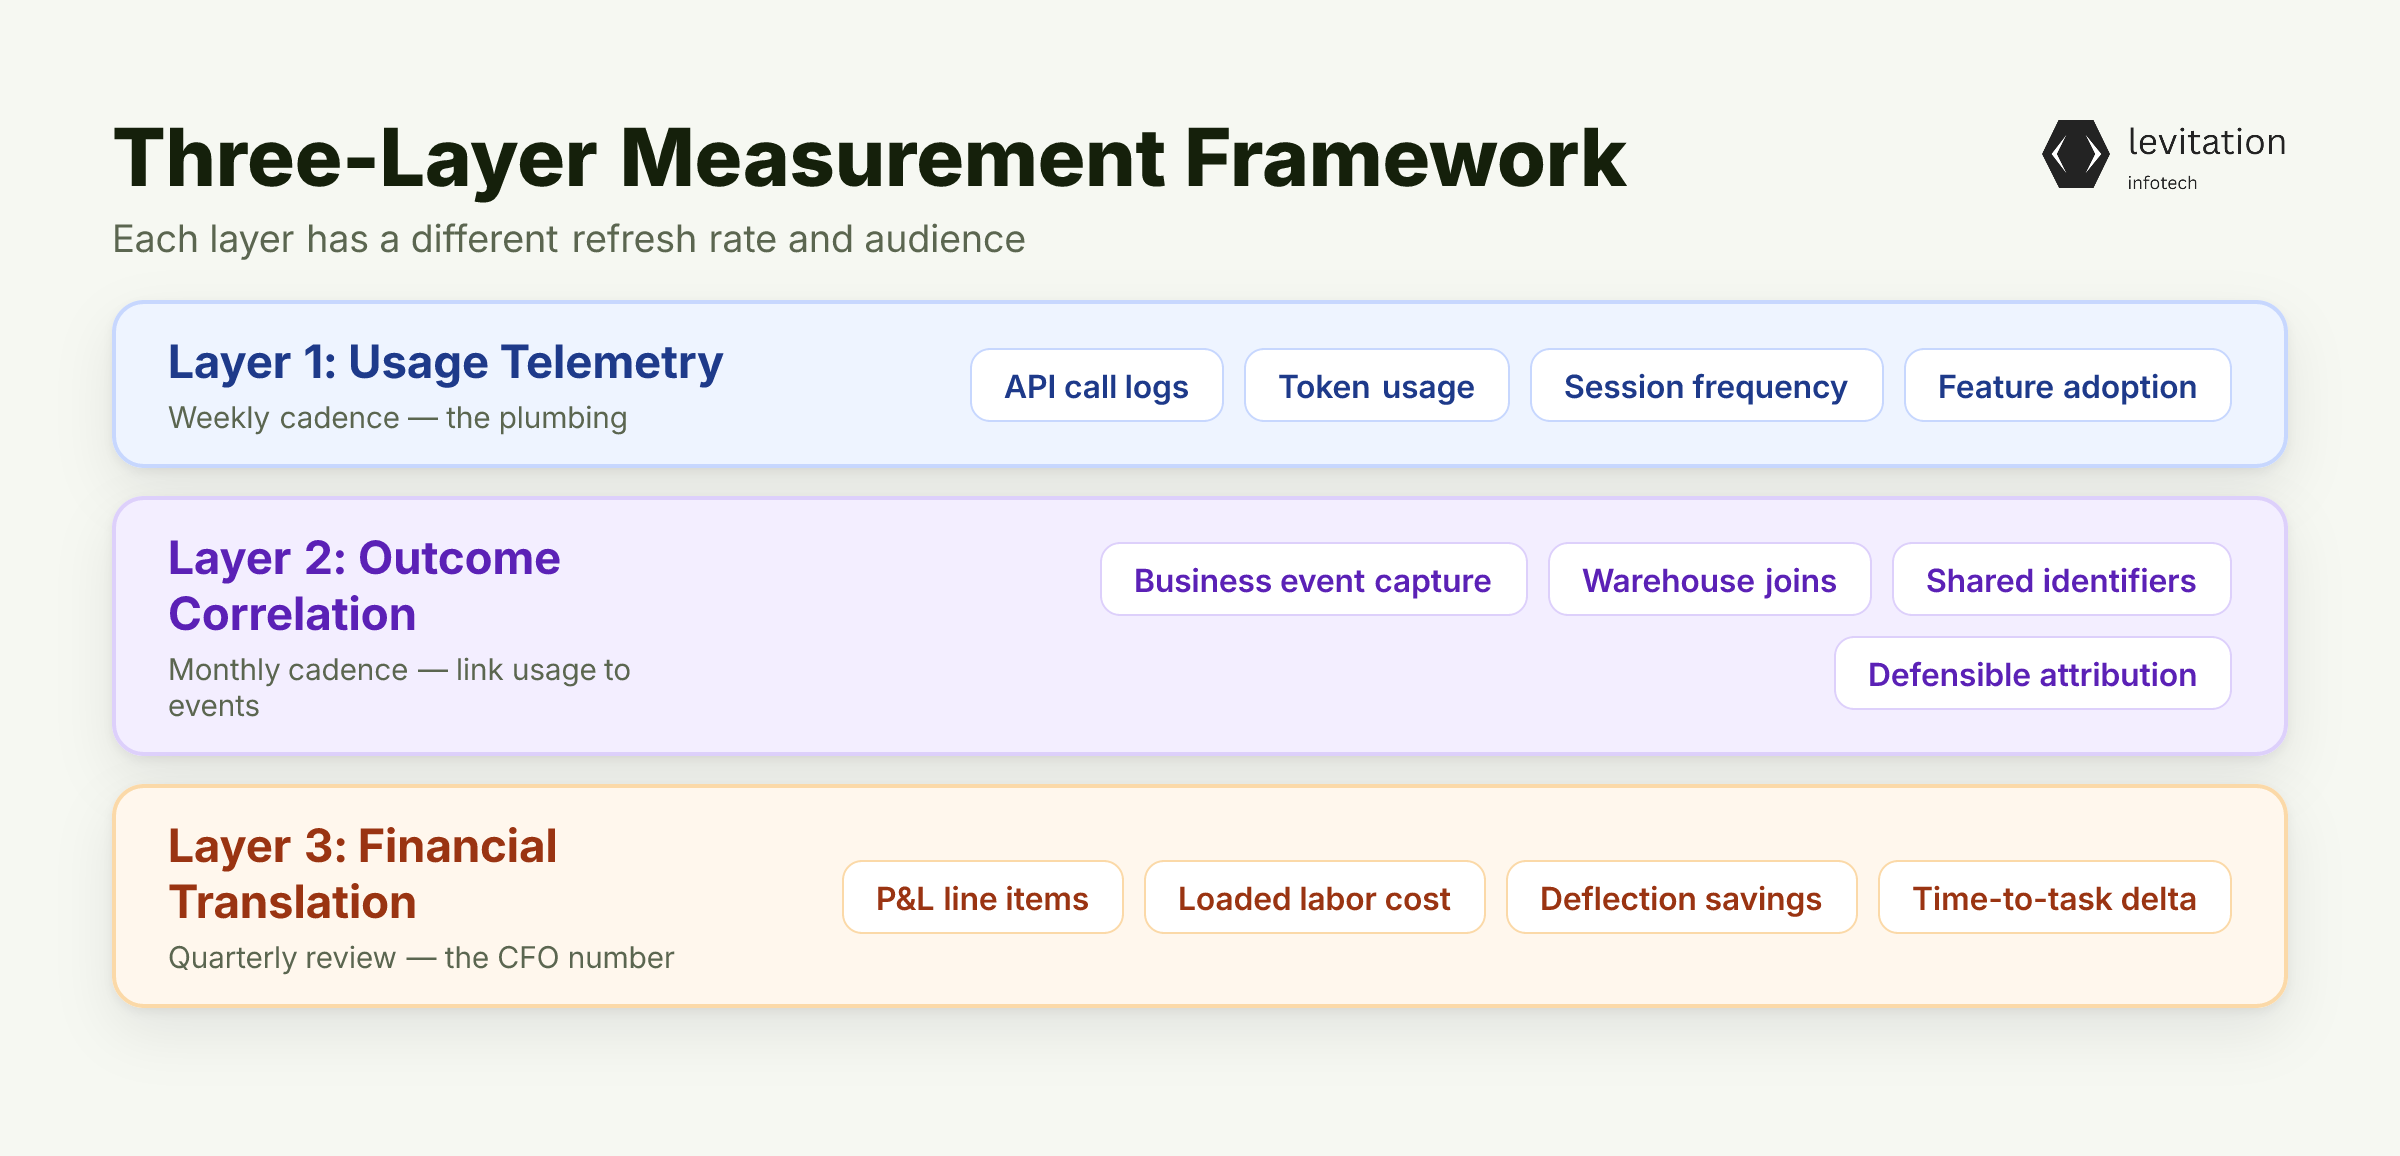
The framework has three layers, each with a different refresh rate and a different audience.
Layer 1 is usage telemetry. This is the plumbing. API call logs show you which models are being hit. Token usage tells you which features are actually consuming budget.
User session frequency reveals which teams have adopted the tool and which have not. Feature adoption curves surface the early signals of training gaps or workflow mismatches. None of this requires a single survey.
Layer 2 is outcome correlation. Here you link AI tool usage to downstream business events. When a support agent closes a ticket, the ticket system fires an event. When a developer merges a pull request, the code repo fires an event.
Your warehouse joins these events to the AI interaction logs using shared identifiers. The result is a defensible measurement of what AI actually produced, not what people think it produced.
Layer 3 is financial translation. The outcome delta becomes a P&L line item. If a task now takes 12 minutes instead of 45, multiply the saved minutes by loaded labor cost.
If AI resolves 40% of tickets without human touch, multiply the deflected tickets by cost per ticket. The math isn't glamorous, but it's the only number a CFO will sign off on.
Cadence matters. Usage telemetry refreshes weekly. Outcome correlation rolls up monthly. Financial translation gets a quarterly review.
Annual portfolio reallocation decides which pilots scale and which die. Each layer has its own rhythm. Trying to run them all at the same speed guarantees you'll measure the wrong things.
The speed advantage matters too. A typical deployment takes 3-6 months when instrumented with this framework from day one. In-house teams trying to replicate the same plumbing take 18-24 months and often never finish.
Even with the right framework, most pilots still die in "pilot purgatory." The reason isn't measurement. It's the gap between proving value and shipping production.
Why Pilots Die in Purgatory (and How to Skip It)
Pilot purgatory is the graveyard where good AI work goes to die. The measurement works. The use case is proven.
The pilot gets stuck in committee reviews, security approvals, and procurement cycles. It never makes it to production.
Deloitte's 2026 deployment data tells the story. Vendor-led deployments hit time-to-first-value in 38 days. Custom builds take 94 days.
Fully in-house teams in 2025 averaged 138 days. The trend is getting worse, not better.
The hidden cost is not the model. The model is the cheap part.
The expensive part is the integration, the eval harness, the security review, and the change management that turns a demo into a production system. In-house teams underestimate this by a wide margin.
They budget for the model and the prompts. They forget the SSO integration, the audit logging, the rate limiting, the prompt injection defenses, and the rollback mechanism.
The companies that skip the in-house build cycle go from kickoff to production in 3-6 months. The ones that try to replicate vendor infrastructure internally take 18-24 months and often never finish. The reason isn't talent.
Production-grade AI infrastructure is a system of dozens of small pieces. Each one has a failure mode that takes months to discover.
The fastest path forward: instrument from day one with the three-layer framework, set a 90-day value threshold, and kill or scale based on telemetry, not on vibes. The 90-day clock forces a decision. Vibes never do.
When you combine ground-truth measurement with disciplined deployment timelines, the economics of enterprise AI change completely. Here's what that looks like in long-running production systems.
What Changes When You Measure the Right Way
When ROI is provable, the conversation changes. Budget reviews shift from "should we keep funding this?" to "where do we deploy next?" That single reframe unlocks enterprise-scale adoption.
The signal is retention. Our 98% client retention rate comes from systems that keep producing measurable value years after initial deployment. Systems still running in production 5+ years after go-live are not the exception. They're the baseline for any deployment that started with ground-truth measurement from day one.
The companies stuck at McKinsey's 6% aren't failing at AI. They're failing at measurement. The fix is a 90-day instrumentation sprint, not a new model.
Better prompts don't help if you can't prove what the prompts produced. New embeddings don't help if your CFO still sees survey data on the slide.
A few teams we work with at Levitation have rebuilt their entire AI portfolio around this principle. The portfolio now self-reports: every quarter, the warehouse tells them which pilots returned value and which didn't.
The board gets a single dashboard. The decisions get faster. The budget grows.
Frequently Asked Questions
Q: What percentage of AI pilots actually deliver measurable ROI?
A: Based on telemetry, the rate of real ROI delivery exceeds McKinsey's 6% figure by a wide margin. The gap is methodology, not reality.
Q: How do you measure AI ROI without relying on user surveys?
A: Use the three-layer framework. Layer 1 is usage telemetry from API logs. Layer 2 is outcome correlation by joining AI events to business events in your warehouse. Layer 3 is financial translation using internal loaded labor costs. No self-reporting required.
Q: Why do so many AI pilots fail to scale?
A: The failure is almost always in measurement or deployment speed, not the model itself. Custom in-house builds take 18-24 months and lose momentum. Instrumented vendor deployments hit production in 3-6 months and survive budget cycles.
Q: Is McKinsey's 2026 AI survey methodology reliable?
A: It's reliable for tracking adoption trends but unreliable for ROI claims. Self-report inflation is well-documented for AI productivity, meaning the 6% figure likely understates true delivery by a wide margin.
Q: What's the median payback period for enterprise AI in 2026?
A: Bain's 2026 data shows 6.7 months median payback, down 41% from 11.4 months in 2025. Vendor-led deployments reach first value in 38 days versus 94 days for custom builds.
Start with one pilot, instrument it from day one, and let the data decide what scales next.
About the author
Mayank Singh is a software developer at Levitation Infotech, where he builds web and AI-powered applications across the company’s fintech, healthcare, and enterprise projects.