


TL;DR: Most engineering organizations can't prove whether their AI investments work because they measure the wrong things. Traditional velocity metrics (DORA, PR throughput) were built for human-paced development and now actively mislead when AI shifts work from writing to reviewing. A three-tier framework covering direct engineering impact, indirect operational cost, and strategic value, instrumented over 30 days, is the only approach that survives a CFO audit.
Key Takeaways: - The 70% who can't prove AI ROI aren't failing at AI. They're failing at instrumentation. - DORA metrics and PR throughput become cost drivers, not productivity gains, once AI enters the loop. - Tier 1, Tier 2, and Tier 3 metrics must be tracked together to build a defensible ROI model. - Baseline before deploy. If you can't defend a metric to a skeptical CFO in 30 seconds, it's vanity.
The 70% Problem Is Measurement, Not AI
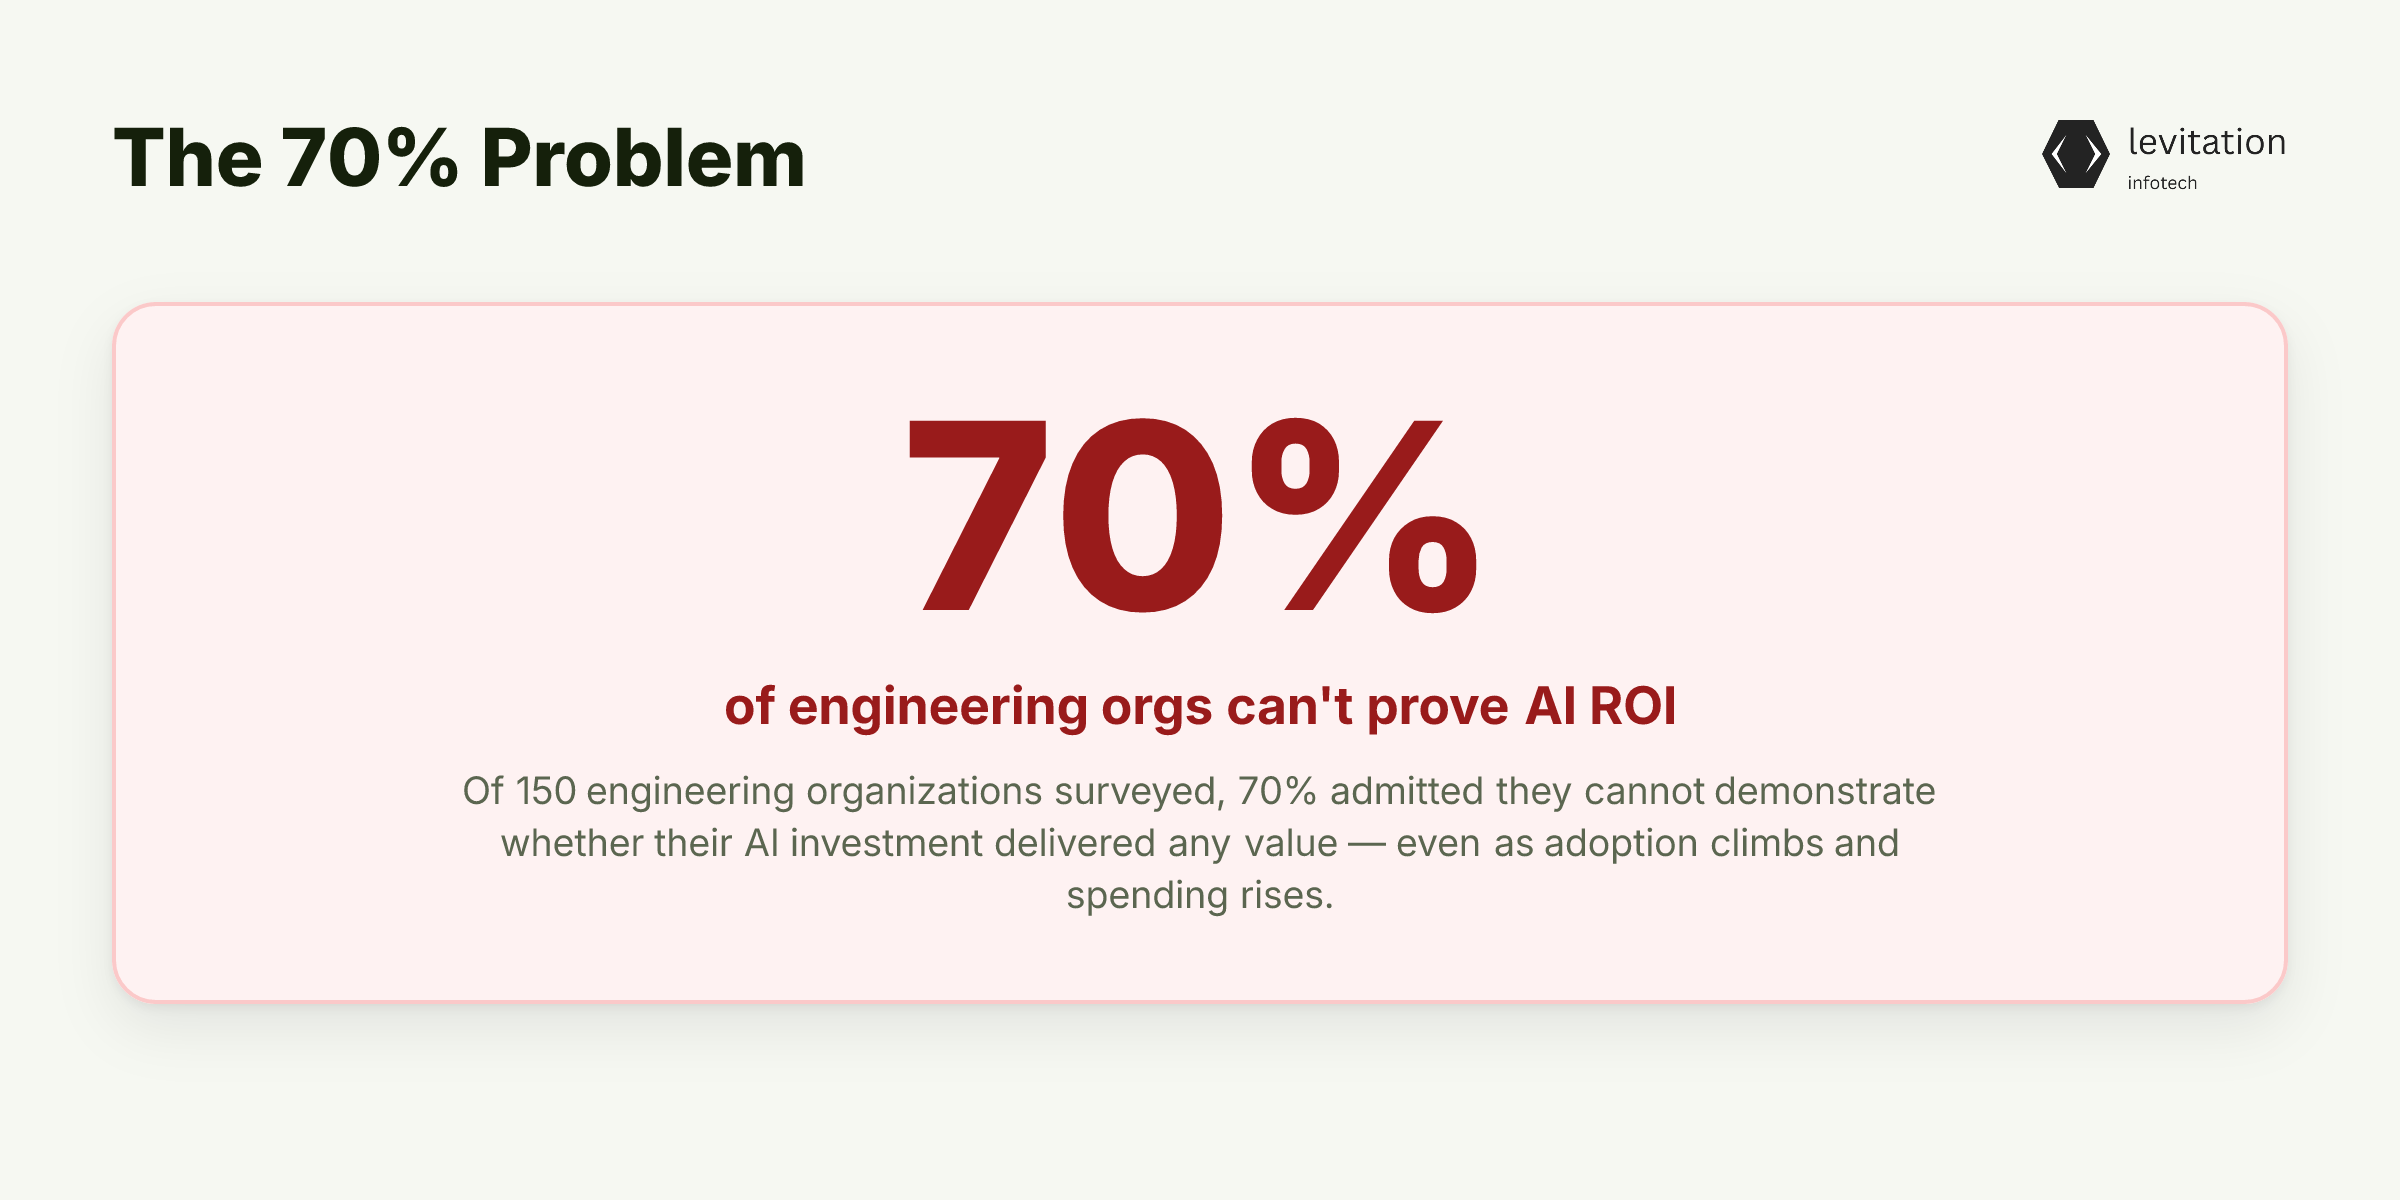
We asked 150 engineering organizations whether they could prove their AI investment was working. 70% said no. The technology is everywhere. Adoption keeps climbing. Yet most teams still can't tell the board whether the spend made anything better.
The numbers tell a strange story. 78% of companies now use generative AI in at least one function, per McKinsey's State of AI research. An MIT study found 95% of generative AI pilots fail to deliver meaningful bottom-line impact.
Spending is up. Pilots are everywhere. The gap between adoption and value keeps widening.
Most leaders blame this on the technology. They say the models aren't ready, the use cases are wrong, or the data is messy. That instinct is wrong. The models work. The use cases are real. The problem is structural. We never built the instrumentation to know if AI is creating value, so the conversation defaults to vibes.
Here's the uncomfortable part: it's not that the 70% lack a measurement framework. It's that the metrics they already use are actively lying to them. Those numbers look like proof. They aren't. They're noise dressed up as signal.
The instinct to blame vague AI value misses something deeper. The dashboards most teams already trust show gains that don't exist, while hiding the real costs. We explored this pattern in our work on developer productivity measurement, and the baseline numbers rarely match the post-AI narrative.
Why DORA Metrics and Velocity Are Lying to You
DORA metrics were designed for a world where humans wrote code. Deployment frequency, lead time, mean time to recovery, and change failure rate made sense when each pull request came from a developer who thought about it for hours. They break the moment AI starts generating suggestions in seconds.
When AI floods the review queue with more pull requests, faster cycle time stops being a productivity win. It becomes a cost driver. Your review queue explodes. Your senior engineers spend their days evaluating machine output instead of building. Throughput goes up. Quality does not.
The 81% problem makes this concrete. 81% of engineering leaders report spending more time reviewing AI-generated code. That work doesn't show up in any velocity dashboard. It's a hidden cost line that grows with every model upgrade and every new suggestion feature shipped by your vendor.
PR count goes up. Lines of code go up. But what about rework rate, security defect density, and the cognitive load of evaluating machine output? Those numbers get worse, silently. Comparisons to pre-AI baselines become meaningless once AI shifts the mix of work from authoring to auditing. Velocity metrics reward motion. They were never built to measure judgment, and AI moves the bottleneck from motion to judgment.
If your dashboard says you're faster, but your engineers are drowning in review, your dashboard is wrong. The economics also shift in ways finance teams miss, which is why we wrote about justifying AI engineering investment elsewhere.
If velocity metrics mislead and PR throughput inflates without signal, what is the actual cost structure you're missing? That's where it gets worse.
The Real Cost Structure Nobody Models
Licensing is the smallest line item. The real bill is dominated by review, rework, and context-switching. Almost no finance team models it.
AI introduces a permanent operational cost that scales with usage. Every time a developer accepts a suggestion, a review obligation follows. Every time the underlying model updates, and it will, your team must re-validate suggestions, re-tune prompts, and re-train habits. The cost isn't static. It compounds with every release from your vendor.
Hidden costs stack up fast: - Senior engineer time spent evaluating AI output - Expanded testing surface area for generated code - Security review burden for new attack patterns the model introduces - Prompt iteration overhead as teams learn the tool's quirks - Re-work loops when AI suggestions pass review but fail in production
Internal cost models systematically underestimate because they treat AI as a static tool. It's not static. It's an evolving system that shifts its behavior with each model generation. Your team is also evolving, learning what to trust and what to reject. That adaptation has a price tag that never appears on the invoice.
The compounding effect is the part most boards miss. When the model changes, your best engineers spend weeks re-validating workflows that worked fine last quarter. Those weeks are real cost. They show up as reduced feature velocity, not as a line item called "AI overhead." Finance treats it as normal variance. It isn't.
If traditional metrics mislead and cost models miss the real spend, what should you actually measure? That's where the framework comes in.
A Three-Tier Framework That Distinguishes Vanity From Value
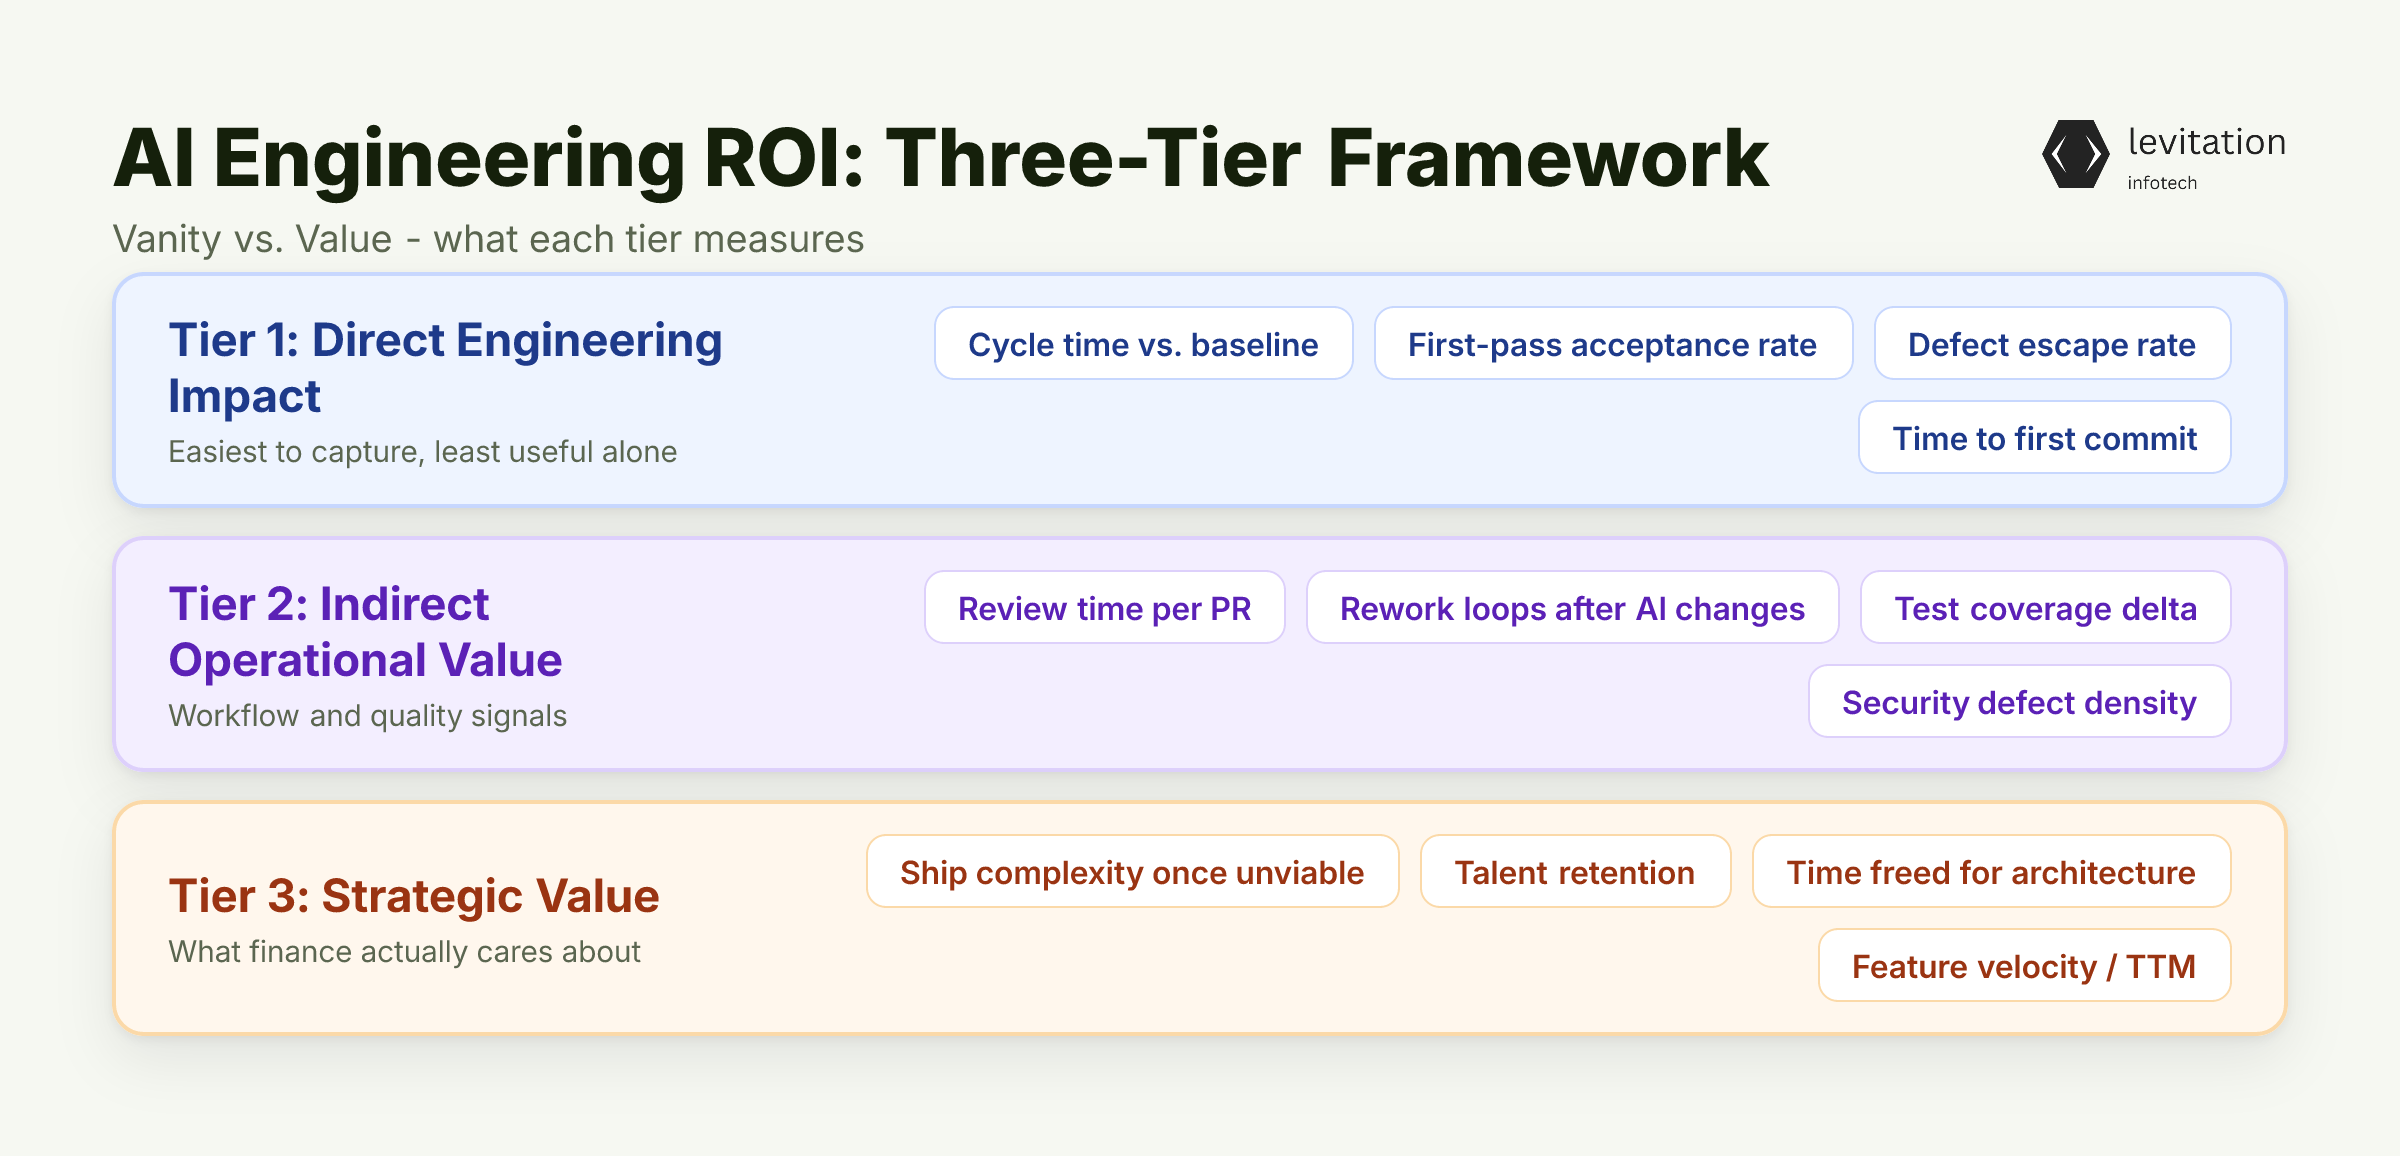
Most teams measure one thing and call it done. That single metric is usually Tier 1, the easiest to capture, and the least useful in a board conversation. Here's what each tier contains.
Tier 1: Direct Engineering Impact - Cycle time for AI-assisted tasks versus non-assisted baselines - First-pass acceptance rate of AI suggestions - Defect escape rate to production, correlated with AI involvement - Time to first commit for new engineers using AI tooling
Tier 2: Indirect Operational Value - Review time per pull request - Rework loops after AI-assisted changes - Test coverage delta between AI and non-AI commits - Security defect density per thousand lines of AI-generated code - Context-switching frequency during AI-assisted sessions
Tier 3: Strategic Value - Ability to ship complexity that wasn't economically viable before - Talent retention, because engineers leave when tooling feels dated - Time freed for architecture and platform work versus maintenance - Customer-facing feature velocity and time to market
Most organizations measure Tier 1 and stop. The CFO pushes back on renewal, and nobody can answer why. The fix is to translate each tier into hours saved, risk reduced, or revenue enabled. Avoid "productivity points" or abstract scores. Finance can't audit them, and vague numbers get cut first.
The 30-second CFO test matters more than any dashboard. If you can't defend a metric to a skeptical finance leader in 30 seconds, it's a vanity number, not a metric. Tier 1 survives scrutiny when paired with defect data. Tier 2 survives when paired with engineering hours. Tier 3 survives when paired with shipped outcomes finance already tracks.
We built the deeper version of this in engineering metrics for the AI era, and the tier structure holds across teams. The underlying signals shift as models evolve. That's why the framework treats measurement as a living system, not a one-time setup. This is also why AI coding assistants quietly break traditional engineering metrics. The old definitions can't survive the new workload mix.
A framework only works if you can deploy it. Here's the 30-day instrument plan.
How to Instrument This in 30 Days
Most measurement programs fail because teams skip the baseline. They deploy AI, then try to measure the delta from a number they never captured. The plan below fixes that.
Week 1-2: Establish the baseline
Measure current cycle time, review time per pull request, defect escape rate, and context-switching frequency across three representative teams. Don't change anything yet. The baseline is the only thing that lets you prove a delta later.
Week 2-3: Deploy instrumentation
Track AI suggestion acceptance rate, time spent in review, rework rate per pull request, and correlate each with downstream production defects. Instrument both human and AI contribution in commit metadata so the data is auditable later. If the trail isn't reconstructable, finance won't trust it.
Week 3-4: Run the comparison
Every team gets a dashboard showing Tier 1, 2, and 3 metrics side by side with pre-AI baselines. The side-by-side is the point. A single number out of context means nothing to finance. The comparison is what makes the story defensible.
Build versus buy
Building measurement infrastructure in-house requires ongoing engineering investment, and most internal efforts stall when the underlying model changes. Partners with production-proven frameworks deploy faster and adapt as the AI stack evolves. This is the same logic that applies to any platform expected to survive multiple model generations. If your measurement system can't keep up with vendor releases, it isn't a measurement system. It's a snapshot.
What to ignore: - "Lines of AI code generated" - engagement metric, not value - "Copilot adoption rate" - measures usage, not outcome - Self-reported "time saved" surveys - biased, unauditable
Common mistakes to avoid: - Measuring AI in isolation without correlating with downstream defect data - Treating all teams uniformly, since some workloads benefit more than others - Skipping the baseline and calling a snapshot a measurement
The full sequence, including what to do when the model vendor ships a major upgrade mid-quarter, is mapped in our AI engineering ROI framework.
When this instrumentation is done right, the conversation with the board changes.
What Changes When You Can Actually Prove AI ROI
Renewal conversations stop being defensive. Finance stops asking for stories. You show a model with audit-grade numbers, and the budget conversation becomes a strategy conversation. Engineering gets allocated more, not less, because the value is provable.
Teams that sustain AI value longest share one trait: they treat measurement as infrastructure, not as a quarterly exercise. The gap is almost always instrumentation, not the technology itself.
That fix is faster than most teams think. Baseline for two weeks. Instrument for two more. Compare for one month. Defend the numbers to a skeptical CFO. Repeat every quarter.
The teams that win the next AI cycle won't have better models. They'll have better answers.
Teams that build this discipline early, including baseline, instrument, audit, and adapt, are the ones still running production systems years later, which is exactly the CEO-level strategy gap we keep seeing in AI adoption.
Frequently Asked Questions
How do you measure ROI on AI coding tools?
Track three tiers simultaneously. Direct engineering impact: cycle time, first-pass acceptance, and defect escape rate. Indirect operational cost: review time, rework, and context-switching. Strategic value: ship complexity, retention, and time freed for architecture. Avoid vanity metrics like "lines of AI-generated code" or self-reported time savings. They won't survive a CFO audit.
Why is AI ROI so hard to measure in engineering?
Traditional metrics like velocity and PR throughput were built for human-paced development. They become misleading when AI increases output without reducing review burden. The 81% of leaders who report more time reviewing AI code illustrate the gap. AI shifts work from writing to evaluating, and most dashboards don't track the latter.
What metrics should CTOs track to justify AI investment?
Start with audit-grade numbers: cycle time for AI-assisted versus non-assisted tasks, defect escape rate correlated with AI involvement, senior engineer hours spent on review, and the ability to ship projects that weren't viable before. The 30-second CFO test matters. If finance can't follow the logic in 30 seconds, the metric isn't ready.
How long does it take to see ROI from AI engineering tools?
Timeframes depend on the maturity of your instrumentation and the stability of your AI stack. Tier 1 signals typically surface first because they are closest to the developer workflow. Tier 2 operational costs take longer to stabilize as teams adapt their review and testing processes. Tier 3 strategic outcomes require the longest observation window. They depend on sustained behavior change and compounding effect across multiple quarters.
The bottleneck is almost always instrumentation, not the AI itself. Teams that skip baseline measurement can't tell when ROI arrives.
Should we build AI ROI measurement in-house or buy a framework?
Building from scratch requires ongoing engineering investment and continuous maintenance, and most internal efforts stall when underlying models change. Established partners with production-proven frameworks reduce deployment time and adapt as the AI stack evolves. The same logic applies as for any core engineering platform expected to survive multiple model generations.
Sources
Research and references cited in this article:
- Measuring engineering productivity in 2026
- How to maximize AI ROI in 2026
- The cost of implementing AI in engineering: why ROI is ...
- AI ROI: The Complete Guide to Measuring Artificial ...
- Engineering leaders are investing in AI. How are they ...
- AI Has Outpaced How Companies Measure Developer Productivity, Report Finds - MIT Sloan Management Review Middle East
- What Stanford’s study of 100,000 developers reveals about AI’s real impact on engineering productivity
- The struggle to prove AI productivity gains - LeadDev
- How to measure AI's impact on developer productivity - DX
- Measuring the impact of AI on software engineering – with Laura Tacho
- how - Wiktionary, the free dictionary
- HOW | definition in the Cambridge English Dictionary
About the author
Mayank Singh is a software developer at Levitation Infotech, where he builds web and AI-powered applications across the company’s fintech, healthcare, and enterprise projects.