


TL;DR: A green canary dashboard does not prove your deploy is safe in a multi-zone API server. Canary groups that run in a single zone or follow zone affinity never see failures that only manifest in specific zones like use1a1 or rs2. The fix compares canary vs baseline deltas, spreads canary traffic across zones, and auto-rolls back on SLO breaches when divergence is sustained.
Key Takeaways: - A canary that runs in one zone inherits that zone's blind spots. It cannot observe topology-dependent failures. - The signal is the delta between canary and baseline error rates, not the canary's absolute count. - Rollback should wire to SLO deltas with auto-rollback triggered by sustained divergence. No human in the loop.
The Canary That Let Query 500s Through
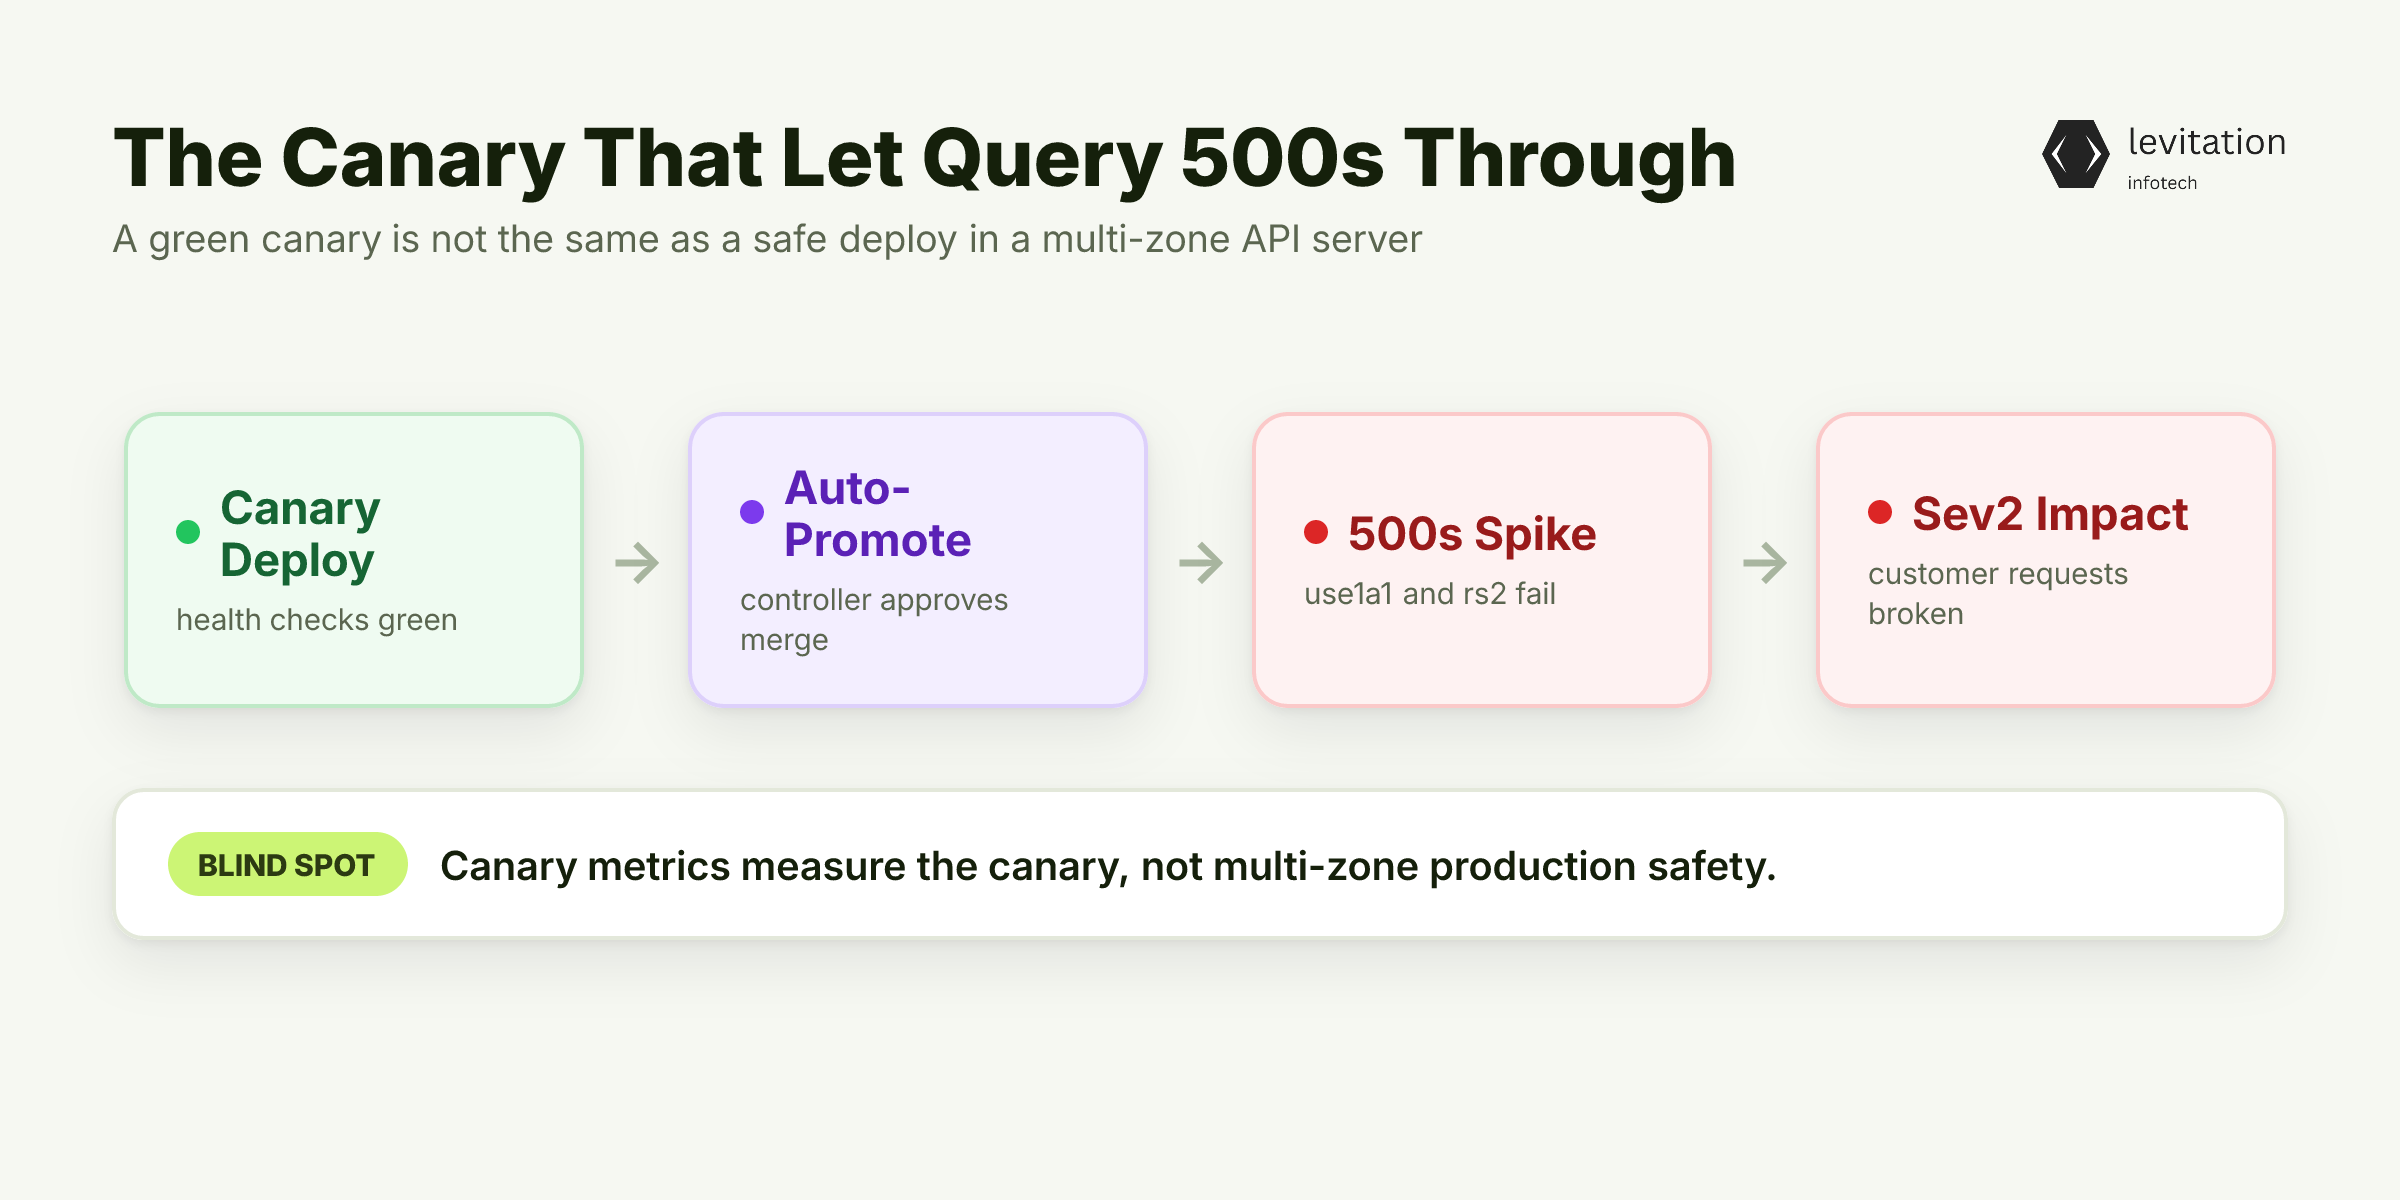
A Sev2 incident hits your channel during peak traffic. The canary deploy to the API server looked clean. Health checks were green. The deployment controller had auto-promoted the canary.
Now query 500s are spiking in use1a1 and rs2. Customer requests are failing. The on-call engineer stares at a dashboard that, until moments ago, said everything was fine.
This is not a hypothetical. It is the failure pattern most platform teams discover only after a Sev2, never before.
The canary did its job by every metric the team defined. It ran for the configured window. Error rates stayed within threshold. Latency held steady. The canary was green. Production was not.
A green canary dashboard is not the same as a safe deploy in a multi-zone API server. Canary deploys are sold as the mechanism that catches exactly this class of failure. The fact that yours did not is the signal. It points to a blind spot most platform teams inherit without realizing it.
Your canary was not lying. It was telling you a precise thing about the failure mode. You just have to be set up to hear it. The same class of blind spot is what makes observability stacks lie about Kubernetes health. It is the same one that turns a passing cloud security solution check into a false sense of safety.
The Multi-Zone Canary Blind Spot Most Platform Teams Miss
The blind spot starts with a conflation. A canary group is not the same as a canary zone. Most teams treat them as interchangeable. The difference is the entire failure mode.
A canary group is a set of pods running the new build. A canary zone is a topology assertion. It means canary traffic is observed across multiple failure domains. It hits the same network paths and dependencies that production traffic will.
In a single-zone deploy, you have the first. In a multi-zone API server, you need the second.
Here is the mechanism. Load balancer zone affinity and topology-aware routing will funnel canary traffic into a subset of zones if you let them. The canary pods exist in all zones. The traffic never reaches them in use1a1 or rs2. It stays in the zone the load balancer prefers. The canary never sees the failure because the canary never sees the traffic that triggers it.
The shared backend trap makes it worse. Query 500s often originate from shared dependencies. Think etcd quorum, control plane caches, and DNS resolvers. The canary pod hits the same etcd. But the canary traffic pattern does not stress the same code path that production does.
A subtle change to a query planner, a new connection pool config, or a DNS resolver timeout can be invisible to a canary that only sees a synthetic traffic shape. This is why building a canary layer through focused is less about tooling and more about topology awareness. The canary has to see what production will see, not a filtered version of it.
The obvious fix is wrong. Scaling canary traffic to a larger share will not surface a failure that depends on a specific zone's network path or hardware state. You can run most traffic through the canary. If all of that traffic lives in use1a2, you still will not observe the failure in use1a1.
The failure mode is topology-dependent. Your canary coverage has to be topology-aware too. It is the same logic behind why a custom software development effort needs to map the topology, not just the syntax.
The canary is telling you something concrete about query 500s in use1a1 and rs2. The question is whether you know how to read the signal it actually emits.
What a Sev2 Canary Actually Tells You About Query 500s
Most teams read the canary wrong. They look at absolute error rate, see a number under their threshold, and declare the deploy safe. That is the wrong question. The right question is the delta between canary and baseline over the same window in the same zone.
Here are the four signals that actually matter, in order of how early they fire. - Error rate delta, not absolute rate. A baseline with a non-zero error rate will mask a canary that elevates the rate relative to that baseline. If your absolute threshold is set high, the canary looks fine in absolute terms. The canary is actually degrading the zone relative to baseline. Always compare canary vs baseline in the same zone over the same time window. - Latency tail divergence as a leading indicator. p99 and p999 latency in canary vs baseline often diverges before error rates spike. Tail latency is the canary's first warning. If canary p999 climbs while baseline p999 holds, the failure is forming. It has not yet crossed the error threshold. - Zone-specific error amplification. When query 500s concentrate in use1a1 and rs2 while other zones stay clean, the canary is telling you the failure is topology-dependent. It is not code-dependent. The rollback should target the routing layer, not just the build. Routing the affected zones back to the previous build, or shifting them to a clean zone, contains the blast radius before a full rollback runs. - Error budget burn rate. A canary that rapidly consumes the zone's error budget is a hard rollback signal. This holds whether or not the canary window has expired. Error budget is a better gate than time. The canary does not get to "finish its window" if it has already burned the budget the SLO depends on.
These four signals are the diagnostic layer most canary setups lack. They are not complicated to compute. But they require that you keep canary and baseline metrics separated by zone. They also require that you write the comparison rules before the canary starts, not during the incident. Reading these signals correctly is the same skill as reading any cloud-native failure mode. The metric is there. The inference is what has to be built. A custom software development layer around your canary turns the raw metrics into a verdict.
Knowing what the canary is telling you is only half the problem. The other half is wiring that signal into your deployment pipeline so rollback happens before a human sees a PagerDuty page.
Building a Canary That Catches Multi-Zone Query Failures
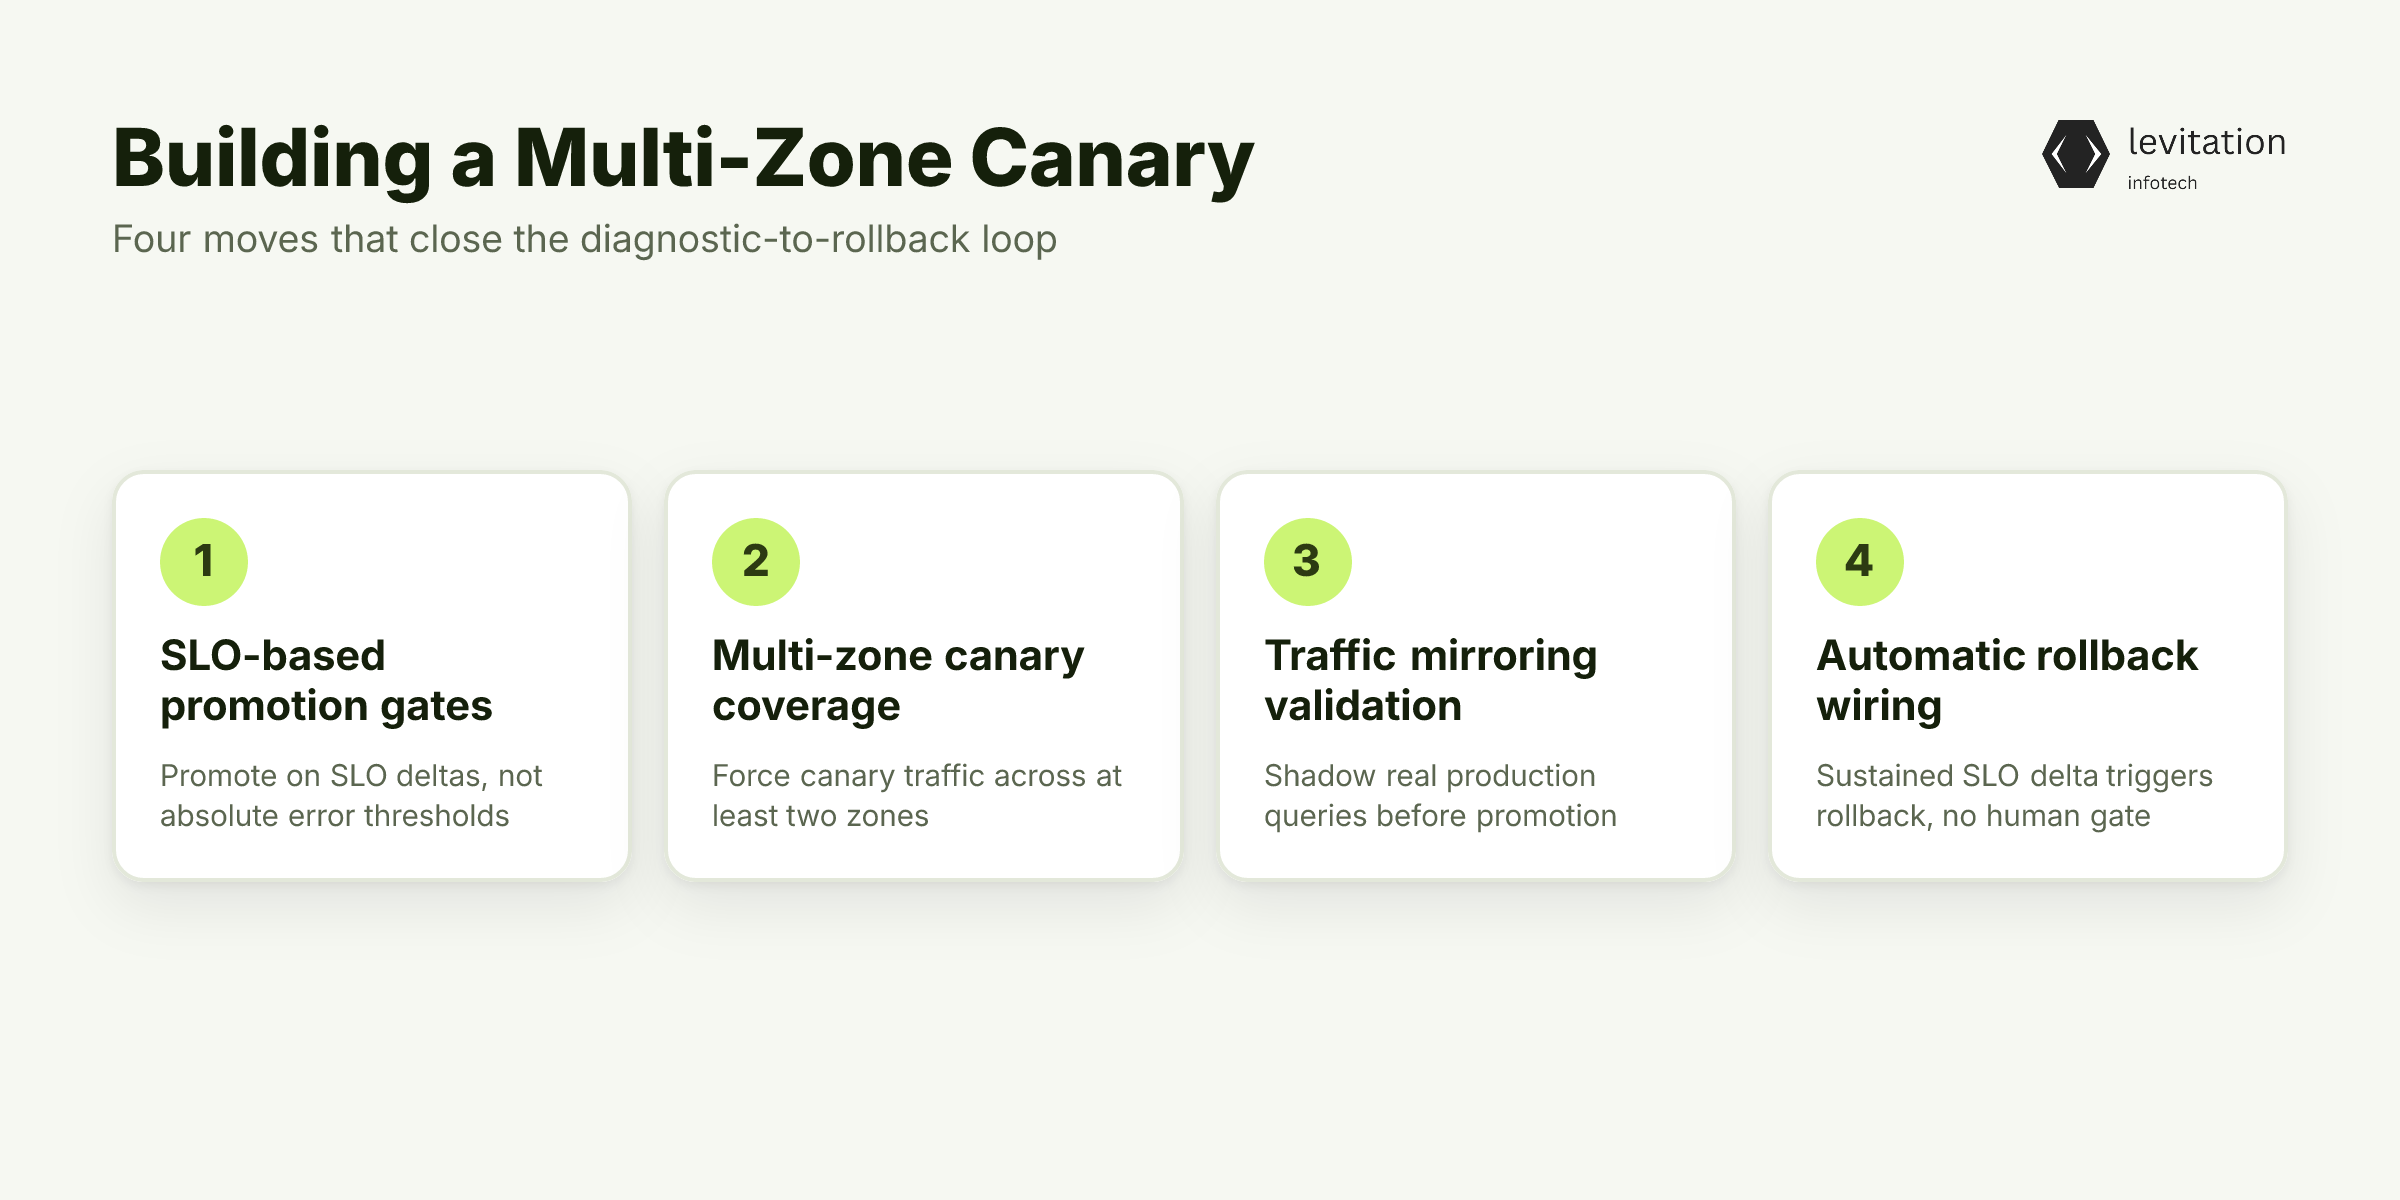
Building is where most teams stall. The diagnostic layer is half the work. The other half is the rollback wiring. Here are the four moves that close the loop. - SLO-based promotion gates. Define canary promotion criteria as SLO deltas, not absolute thresholds. A canary that degrades a zone beyond its baseline error rate auto-fails regardless of the absolute number. This catches the "looks fine in absolute terms" failure mode. - Multi-zone canary coverage. Force canary traffic to spread across at least two zones. Use a header-based or weight-based traffic split that bypasses zone affinity. The canary has to exercise the same routing paths production will hit. Without this, topology-aware routing will funnel canary traffic into a subset of zones. You will keep learning the same lesson the hard way. - Traffic mirroring for pre-promotion validation. Mirror a percentage of production query traffic to the canary replica in shadow mode before any user-facing traffic shifts. The canary sees real query load, including the topology-dependent patterns that triggered the Sev2. If the canary survives shadow traffic in use1a1 and rs2, it has earned promotion. - Rollback automation that does not wait for a human. Wire the canary-vs-baseline comparison to your deployment controller. A sustained error rate delta above your SLO threshold triggers an automatic rollback. No manual approval gate. The human approves the SLO, not the rollback.
Here is a concrete Prometheus rule and rollback command that wires this together.
1groups: - name: canary_vs_baseline2 rules: - alert: CanaryErrorRateDeltaBreach3 expr: |4 (5 sum(rate(http_requests_total{version="canary",zone=~"use1a1|rs2",status=~"5.."}[5m]))6 /7 sum(rate(http_requests_total{version="canary",zone=~"use1a1|rs2"}[5m]))8 )9 >10 (11 sum(rate(http_requests_total{version="baseline",zone=~"use1a1|rs2",status=~"5.."}[5m]))12 /13 sum(rate(http_requests_total{version="baseline",zone=~"use1a1|rs2"}[5m]))14 )15 for: 2m16 labels:17 severity: sev218 annotations:19 summary: "Canary error rate exceeds baseline in use1a1 or rs2"20 action: "kubectl rollout undo deployment/apiserver -n prod"
Bind the alert to a rollback runbook. The controller fires. The canary rolls back. The human gets a postmortem, not a PagerDuty page at 02:00. This kind of wiring is what separates a custom deployment platform from a CI script. The diagnostic layer is the product. The deployment is just the trigger. A well-designed cloud security solution follows the same pattern. The policy is the product. The enforcement is just the trigger. Canary deploys that look routine from the outside are almost always the result of this layer being done right, not the result of lucky traffic.
When this is wired in correctly, canary failures become routine. And routine is exactly what you want from a system that runs in production for years without drama. The payoffs accumulate in three places.
The Payoff: When Canary Deploys Get Boring, Incidents Get Rare
The first payoff is detection time. Automated canary comparison catches the error rate delta before query 500s reach a Sev2 threshold. Rollback completes automatically. The same incident that used to take minutes of customer impact now takes none. The canary never got promoted.
The second payoff is blast radius. Multi-zone canary coverage means the failure is caught at a small traffic share, not full production traffic. Customer-facing impact is minimized for canary-detectable issues. The Sev2 pattern stops being a Sev2 pattern. It becomes a routine canary rollback, logged and reviewed, with minimal customer impact.
The third payoff is engineering trust. When teams stop seeing canary deploys as a gamble and start seeing them as a diagnostic instrument, deploy frequency goes up. Change-failure rate goes down. Canary is no longer the step everyone fears. It is the step that proves the deploy is ready.
The pattern is consistent with what we have seen in long-lived systems. Their canary layer treats multi-zone failure modes as a first-class signal, not an edge case. The deploy pipeline is the system. The system has to see what production will see. Custom platform engineering done right looks boring from the outside because the interesting failures are caught before they are interesting. Teams that need help building this layer often work with a partner like Levitation that has shipped production canary-vs-baseline comparison systems.
If your canary is passing but your zones are not, the gap is in the diagnostic layer, not the deploy. Build the comparison. Spread the traffic across zones. Wire the rollback. The next Sev2 is the one your canary was supposed to catch.
Frequently Asked Questions
Q: Why did my canary pass but production still got 500s in use1a1 and rs2?
A: Your canary likely passed because it ran in a single zone or a traffic slice that did not exercise the zone-specific routing paths, shared backend dependencies, or topology conditions that triggered the query 500s. A passing canary is only meaningful if the canary group sees the same traffic shape as the zones that failed.
Q: How quickly should a canary trigger a rollback on query 500s?
A: For a Sev2-class API server incident, the canary-vs-baseline comparison should trigger an automatic rollback as soon as a sustained error rate delta exceeds your SLO threshold. Waiting for human approval or for the canary window to expire turns a caught failure into a customer-impacting incident.
Q: Can you run a canary across multiple zones simultaneously?
A: Yes, but only if you bypass zone affinity in your load balancer or service mesh so canary traffic is explicitly spread across target zones. Without this, topology-aware routing will funnel canary traffic into a subset of zones, and the canary will never see failures that only manifest in use1a1 or rs2.
Q: How do you distinguish a canary-induced 500 from a flaky zone?
A: Compare the canary group's error rate to the baseline group's error rate in the same zone over the same time window. If the canary's error rate is consistently higher than the baseline in the same zone, the canary is the variable, not the zone. If both groups show elevated errors, the zone or a shared dependency is the variable.
Q: What metrics matter most for a multi-zone canary comparison?
A: The three highest-signal metrics are error rate delta (canary vs baseline), tail latency divergence (p99 and p999), and error budget burn rate per zone. These three together catch most query 500 patterns before they escalate. They work across zones without requiring zone-specific thresholds.
Sources
Research and references cited in this article:
- How to Deploy Multiple Environments - MOSS
- How to Troubleshoot REST API 500 Internal Server Errors in Java Applications - CodingTechRoom
- How to troubleshoot "500 Internal Server Error" in .Net core API? – MindStick
- How to troubleshoot CloudFront 503 Errors | AWS re:Post
- Troubleshooting Octopus Deploy Issues in Enterprise DevOps Environments - Mindful Chase
- How to Debug Canary API Releases for Modern Web Apps
- Canary Testing for APIs: Catch Bad Releases Before Your Users Do
- How to Debug Canary API Release Failures for Public APIs
- Set up an API Gateway canary release deployment
- How we deploy confidently with Canary Deployment - Crisp's Blog
- How to Implement Blue-Green and Canary Deployment Strategies
- kubernetes deployment strategies for 2026
About the author
Mayank Singh is a software developer at Levitation Infotech, where he builds web and AI-powered applications across the company’s fintech, healthcare, and enterprise projects.