

TL;DR: A recent study of 240 engineering teams found that three of four DORA metrics declined after AI coding assistant adoption. The decline is not a measurement failure. It is a diagnostic signal. AI magnifies pre-existing team weaknesses, so the fix is to read what the metrics are telling you about review depth, then augment DORA with workflow and business signals rather than replace it.
Key Takeaways: - Three of four DORA metrics declined across 240 teams post-AI. - The decline is diagnostic: AI amplifies whatever review culture, test discipline, and integration safety your team already has. - Elite teams add three measurement layers DORA never covered: lifecycle depth, developer workflow signals, and business alignment.
Your AI rollout shipped a surge of pull requests last quarter. Your DORA dashboard looks worse. You are not measuring the wrong things. You are measuring the right things in a world that no longer behaves the way the metrics assume it does.
That is the finding from a study of 240 engineering teams that adopted AI coding assistants. Three of the four canonical DORA metrics moved in the wrong direction, and the pattern was too consistent to blame on random variance. Something structural shifted in how these teams ship software, and DORA was designed to measure a different machine than the one now running.
The Deployment Frequency Delusion
Teams that generated more code, in less time, with fewer keystrokes, saw their delivery health scores decline on three of four axes. The contradiction is not a bug in the numbers. It is the entire story.
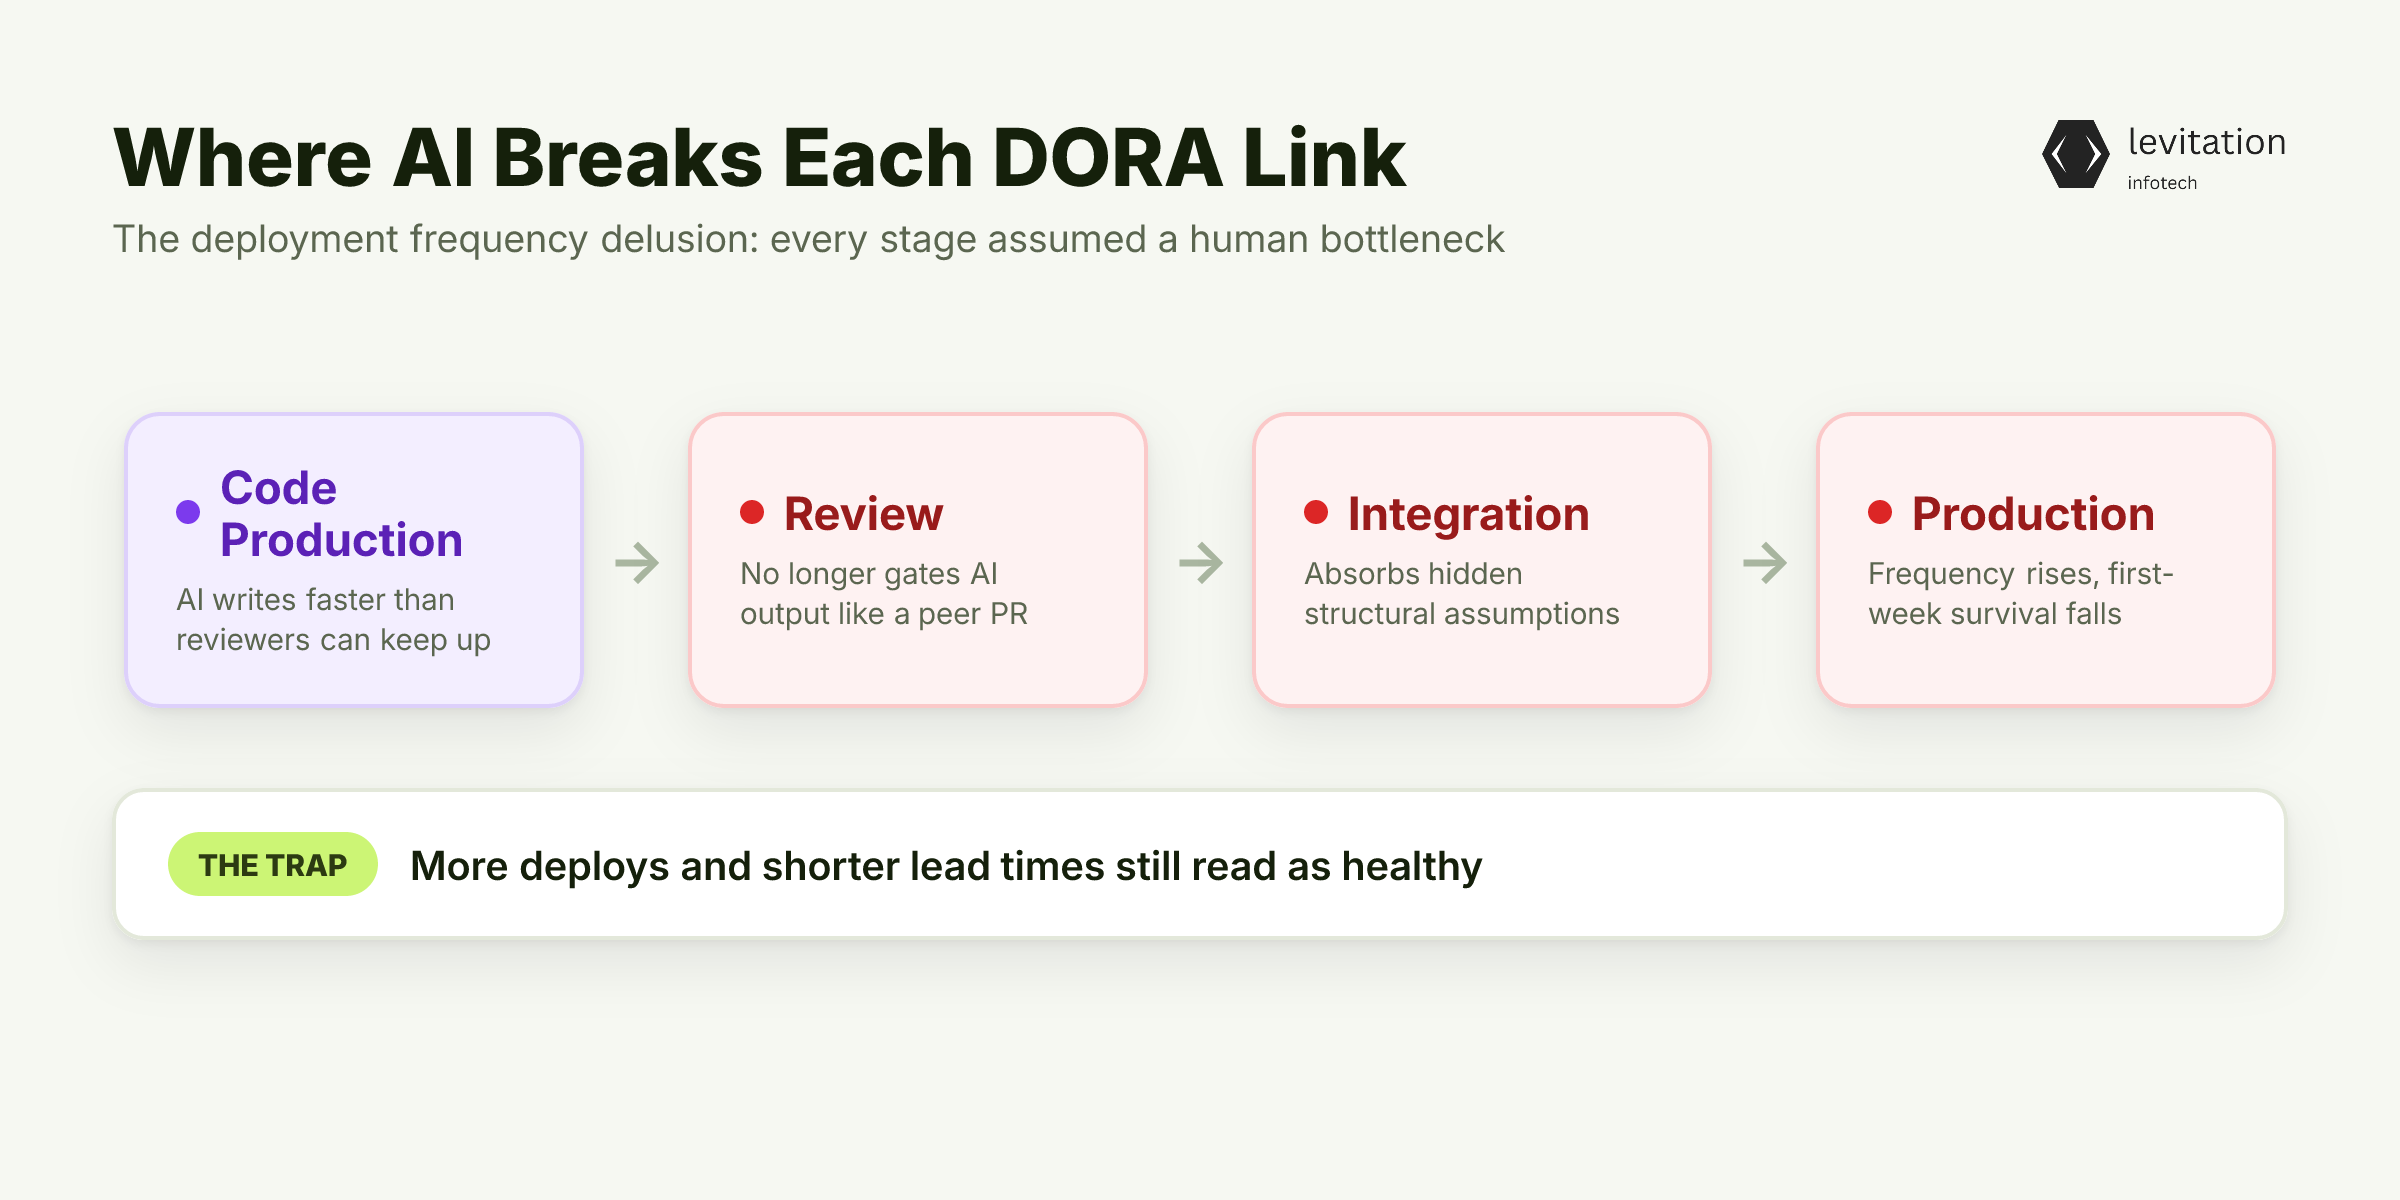
DORA was built on an assumption: humans write code, humans review code, and the bottleneck is getting human-written code safely into production. Every metric in the framework was tuned for that machine. AI breaks every link in that chain. Code production no longer waits on a developer with a keyboard. Review no longer gates AI output the way it gates a peer's pull request. Integration absorbs AI-generated diffs that look clean but carry hidden structural assumptions the assistant had no context to evaluate.
Deployment frequency, lead time for changes, and change failure rate all assume that more deploys and shorter lead times mean a healthier team. Post-AI, a single engineer with an assistant can flood your pipeline with code your reviewers cannot keep up with. Deployment frequency can rise while the proportion of changes that survive their first week in production falls. Lead time for changes can drop at the build step and balloon at the review step, and the headline number still looks fine if you only measure commit-to-deploy.
The decline is real data about a real problem. It just is not the problem most engineering VPs think it is. As we covered in DORA Metrics Are Not Enough in 2026, the framework's blind spot is not a flaw in arithmetic. It is a flaw in assumption. Most leaders look at falling DORA scores and reach for the obvious answer: we need better metrics. That reflex is exactly what makes the situation worse.
Why "Add More Metrics" Is the Wrong Reflex
The instinctive VP response to declining DORA scores is to instrument more. Add cycle time. Add review latency. Add AI acceptance rate. Add code churn. Build another dashboard. The reflex feels productive, and it is the most reliable way to spend budget without changing anything.
DORA was always a proxy for software delivery health, not a measure of value. Linus Torvalds' famous dismissal of lines-of-code as a metric applies to deployment frequency with equal force. Just because a number goes up does not mean engineering quality is going up with it. A team can triple its deployment frequency by shipping three times as many broken things, and the metric will celebrate the achievement.
The 240-team data shows a specific failure mode. AI accelerates code generation faster than human review can absorb it. Lead time for changes may shorten overall, while the time a change spends waiting for a human reviewer balloons. The headline metric falls, and the team's actual delivery capability falls with it. The same dynamic corrupts change failure rate. A review queue that overflows approves faster and rejects less, because reviewers are drowning. Failure rate then measures the success of the drowning, not the health of the system.
As our earlier piece on AI coding assistants breaking engineering metrics showed, this pattern repeats across tooling stacks and team sizes. The bottleneck has moved. It used to be code production. Post-AI, it is code comprehension, review depth, and integration safety. Measuring the old bottleneck harder does not move it. It just produces nicer charts about a problem that has relocated.
Our analysis of AI coding assistant impact walks through how teams that respond to a measurement decline by adding more measurement end up with two dashboards and the same bottleneck. If the bottleneck moved, the question becomes: what is AI actually doing to your team beyond making pull requests pile up?
AI Is a Magnifier, Not a Multiplier
The most important finding from the 240-team study is not the metric decline. It is that AI amplifies existing team strengths and weaknesses. Teams with strong review culture become elite. Teams with weak review culture accelerate straight into the wall. AI does not level the playing field. It tilts it based on whatever your team already does well or poorly.
This explains why three of four metrics declined across the cohort but not uniformly within it. The variance between teams widened. A team whose reviewers were already focused on architecture and system intent absorbed AI output and shipped faster than its human-only baseline. A team whose reviewers gatekept on style nits, or rubber-stamped anything that passed CI, saw the same AI output produce more bugs, longer queues, and a quieter collapse in change failure rate that nobody caught until the metrics moved.
Practically, the implication is sharp: - If your reviewers are gatekeepers who block on style nits, AI code floods them and throughput collapses. - If your reviewers focus on architecture and intent, AI-generated code gets evaluated on the right axis and ships faster than the human-only baseline. - If your test suite was always thin, AI exposes the gap within a sprint, not within a quarter. - If your integration discipline was always loose, AI makes every merge a small bet on a large unknown.
The DORA decline is therefore diagnostic. It tells you which pre-existing weakness AI just exposed. Change failure rate rising means your test coverage was never adequate. Lead time elongating at the review step means your review culture was never scaling. Deployment frequency inflating while reliability falls means the metric was never measuring what you thought it was. The metric is a symptom. AI is the stressor that made the symptom visible.
This is the lens the DORA AI Capabilities Model takes, and the reason it reorganized the framework around archetypes rather than performance tiers. Once you accept that AI exposes weakness rather than creates it, the question shifts from "which new metric do we add" to "which layer of the delivery lifecycle do we start measuring properly."
What Elite Teams Track Beyond DORA
The 2025 DORA report moved from four performance tiers to seven archetypes and introduced the AI Capabilities Model. That shift is a quiet admission that DORA is no longer a complete picture. The framework's own maintainers have accepted that the original four metrics cannot describe post-AI delivery.
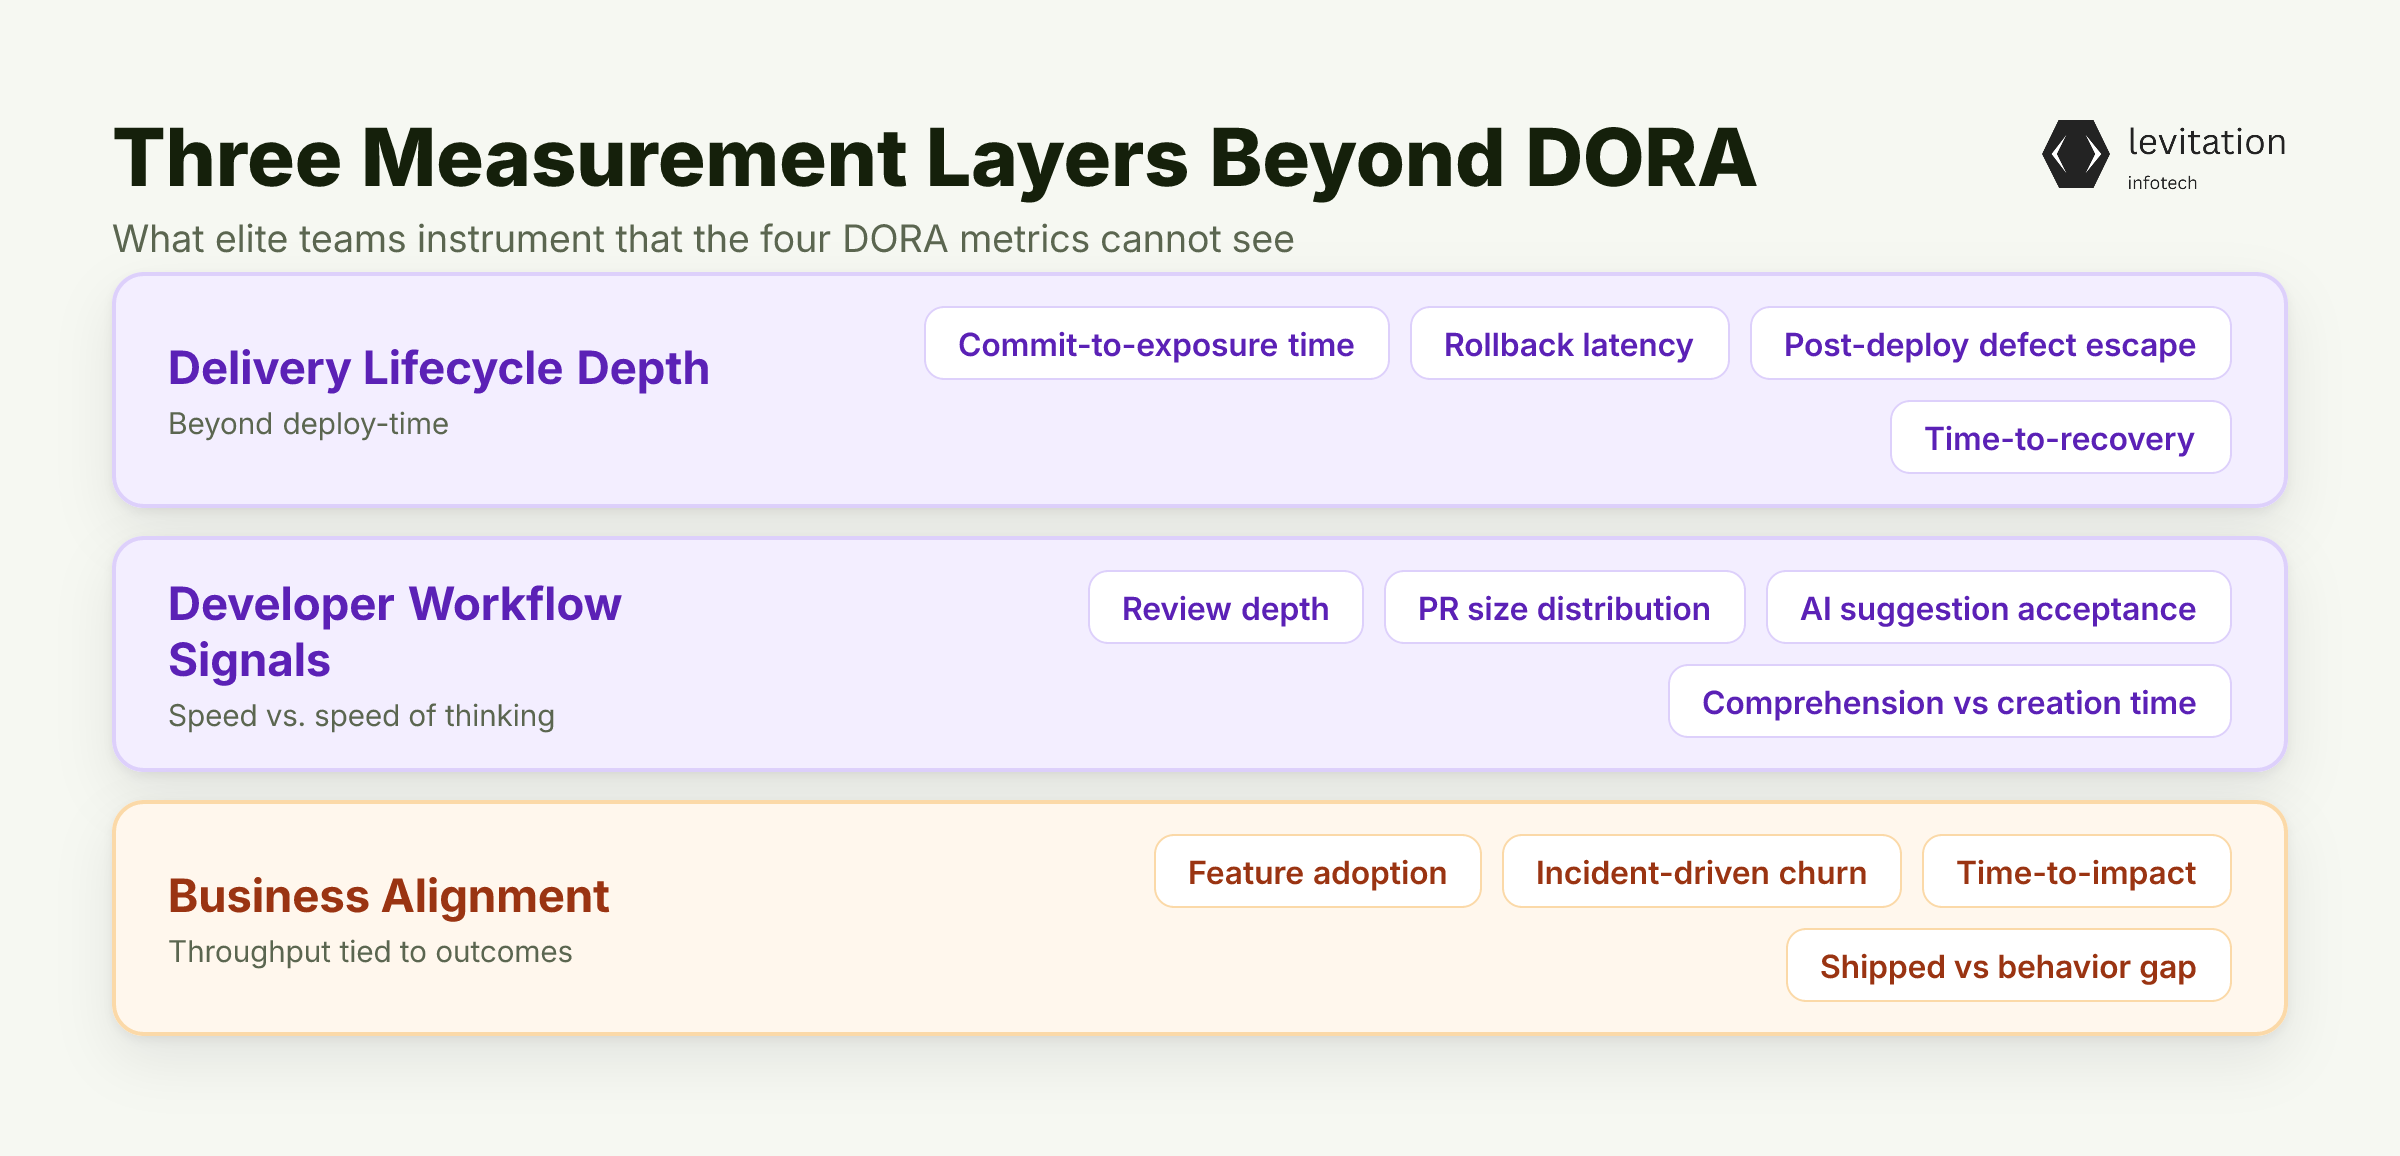
Elite engineering organizations have converged on three measurement layers DORA does not cover. Each one captures a different bottleneck the framework was never designed to see.
Delivery lifecycle depth means instrumenting beyond deploy-time. From commit to first user exposure. Rollback latency. Post-deploy defect escape rate. Time-to-recovery when something does go wrong. These capture the value DORA's frequency metric assumes but never measures. A team that deploys ten times a day and rolls back nine of them is not healthier than a team that deploys once. The same logic applies to teams that ship features nobody adopts, and the pattern we unpacked in vibe coding creating compliance debt shows how invisible lifecycle gaps become audit risks later.
Developer workflow signals cover review depth, pull request size distribution, AI suggestion acceptance rate, and time spent in code comprehension versus creation. These tell you whether AI is making engineers faster thinkers or faster typists. The distinction shows up in defect rates, in onboarding time for new joiners, and in how much context your reviewers need to absorb before they can sign off. The DX Core 4 framework codifies much of this measurement in a structure teams can adopt without rebuilding their stack.
Business alignment ties engineering output to customer outcomes. Feature adoption. Incident-driven churn. Time-to-impact for shipped work. The gap between what shipped and what moved a customer behavior. This is the layer that prevents DORA's throughput game from becoming a value game you lose.
Knowing what to measure is one thing. Knowing what to do about it as a VP with twelve other priorities is another.
The 90-Day VP Playbook for Post-AI Measurement
The transition from "we have a measurement problem" to "we have a delivery problem our metrics now show" is where most teams stall. Here is the playbook that breaks the stall.
Phase one, days 1 through 30: audit the review pipeline before touching metrics. Measure review queue depth, median time-to-first-review, and pull request rejection rate by reviewer. These three numbers explain most of the DORA decline before you change a single instrument. They are also the leading indicators your AI rollout has been silently breaking.
The point of phase one is not to ship a new dashboard. It is to make the bottleneck visible to the people who own it. Teams that skip this step and reach for AI acceptance rate as a proxy end up measuring the assistant, not the team, and miss the leading indicators that would have surfaced the DORA decline in the first place.
Phase two, days 31 through 60: instrument developer workflow signals. Capture AI acceptance rate per developer, pull request size distribution before and after AI adoption, and time spent reviewing versus writing. Resist the temptation to optimize AI acceptance rate as a goal. It will push your team toward autopilot acceptance of bad suggestions and make the underlying review problem worse. The right read on acceptance rate is variance, not mean. Which developers accept almost everything, which reject almost everything, and what does the code look like in both cases?
Phase three, days 61 through 90: connect engineering output to business outcomes. Pick one product flow and trace from commit to customer-visible change to downstream usage or incident signal. This is the layer DORA cannot give you, and it is what your board will ask about next.
The detailed instrument list lives in our guide to developer velocity measurement after AI adoption. Do not retire DORA. Augment it. The four DORA metrics remain useful as flow indicators, but treat them as the first quarter of your measurement stack, not the whole thing. Teams that run this playbook consistently land in a very different place from teams that treat DORA as the whole truth. The difference shows up in deployment outcomes, not just dashboards.
What Changes When You Read the Decline Correctly
Engineering organizations that have rebuilt measurement around the AI-magnifier insight deploy more predictably, not just faster. Predictability is what makes AI rollouts defensible to the board and the CFO. Speed without predictability is a story nobody outside engineering believes, and a budget nobody outside engineering renews.
The gap between teams that read the DORA decline correctly and teams that chase new metrics shows up as deployment cycle compression. Teams that instrument the full lifecycle post-AI catch architectural drift, review collapse, and value misalignment before they become outages. The absence of those catch-loops is what makes slower rollouts slow.
Our enterprise AI deployment practice applies this same instrumented approach. The posture that catches architectural drift also surfaces the kinds of agentic failure modes we covered in agentic AI quietly building your next outage, because the measurement surface already spans workflow and business outcomes rather than just deploy counts.
The DORA decline was never a sign that your team got worse at engineering. It was a sign that the part of engineering DORA never measured, review depth, integration safety, and value delivery, just became the bottleneck.
Frequently Asked Questions
Q: Are DORA metrics still relevant in 2026?
A: Yes, but only as the first layer of a broader measurement stack. DORA's four metrics remain useful flow indicators, but they were designed for human-only pipelines. Post-AI, they measure symptoms of bottlenecks that now live in review, comprehension, and integration rather than in code production.
Q: Why are DORA metrics declining after AI adoption?
A: Because AI shifts the bottleneck. Code generation accelerates faster than human review and integration can absorb, so change failure rate rises, lead time for changes stretches at the review step, and deployment frequency becomes inflated by AI-driven pull request volume rather than engineered capability. The 240-team study found three of four DORA metrics moved in the wrong direction for this reason.
Q: What metrics should replace DORA for AI-assisted teams?
A: Do not replace DORA; augment it. Elite teams add three layers: delivery lifecycle depth, including time-to-user-exposure, rollback latency, and defect escape rate; developer workflow signals, covering review depth, AI acceptance rate, and pull request size distribution; and business alignment, covering feature adoption, incident-driven churn, and time-to-customer-impact.
Q: What is the DORA AI Capabilities Model?
A: Introduced in the 2025 DORA report, the AI Capabilities Model recognizes that the framework's traditional four metrics cannot capture how AI tools change team performance. It moves the framework from four performance tiers to seven archetypes and adds dimensions for AI tool adoption quality, review maturity, and integration discipline.
Q: How do you fix declining DORA metrics after AI adoption?
A: Read the decline as a diagnostic signal about pre-existing weaknesses rather than a problem with the metrics themselves. Audit the review pipeline first, then layer in developer workflow signals and business-outcome tracing. The four DORA metrics stay as flow indicators; the fix is adding the three layers they never covered.
Sources
Research and references cited in this article:
- DORA Metrics Are Not Enough in 2026: What Elite Engineering ...
- DORA Metrics in the AI Era: Why Deployment Isn't Faster - YouTube
- DORA metrics tools in 2026: What to measure, and what's missing
- DORA metrics are lying to you (and AI is making it worse) - Medium
- DORA | A history of DORA’s software delivery metrics
- How? Vs What? : r/ENGLISH
- HOW Definition & Meaning
- HOW Definition & Meaning
- What is the meaning of 'how' and how can I explain it?
- How to Use “how” in English | Meaning, Examples ...
- Why DORA Metrics Look Different When AI Is Part of Your ...
- How AI Impacts Software Performance: Insights from DORA ...
About the author
Mayank Singh is a software developer at Levitation Infotech, where he builds web and AI-powered applications across the company’s fintech, healthcare, and enterprise projects.