


TL;DR: Telemetry work is auto-generated. It is buried in cloud infrastructure line items. It is owned by no one role. As a result, its cost stays invisible to quarterly reviews. AI workloads just multiplied the problem. A 90-day plan with the right velocity metrics can surface the tax. It can also reclaim the tax before the next board meeting.
Key Takeaways: - The observability tax is industry-wide. 97% of orgs have hit unexpected telemetry overages. 67% of orgs hit them regularly. - AI inference calls produce dozens of spans per request. This inflates the time platform teams spend on telemetry plumbing. - Five velocity metrics can turn the hidden cost into a line item. The metrics are sprint allocation, cost per service, spans per request, MTTR ratio, and telemetry-driven rollback rate. Leadership can act on this line item.
Your engineers spend a growing share of every sprint on the tools that give you visibility. They wire them up, maintain them, and debug them. Leadership sees the dashboards. Nobody sees the bill, in hours.
The Hidden Observability Tax Nobody Reports Up
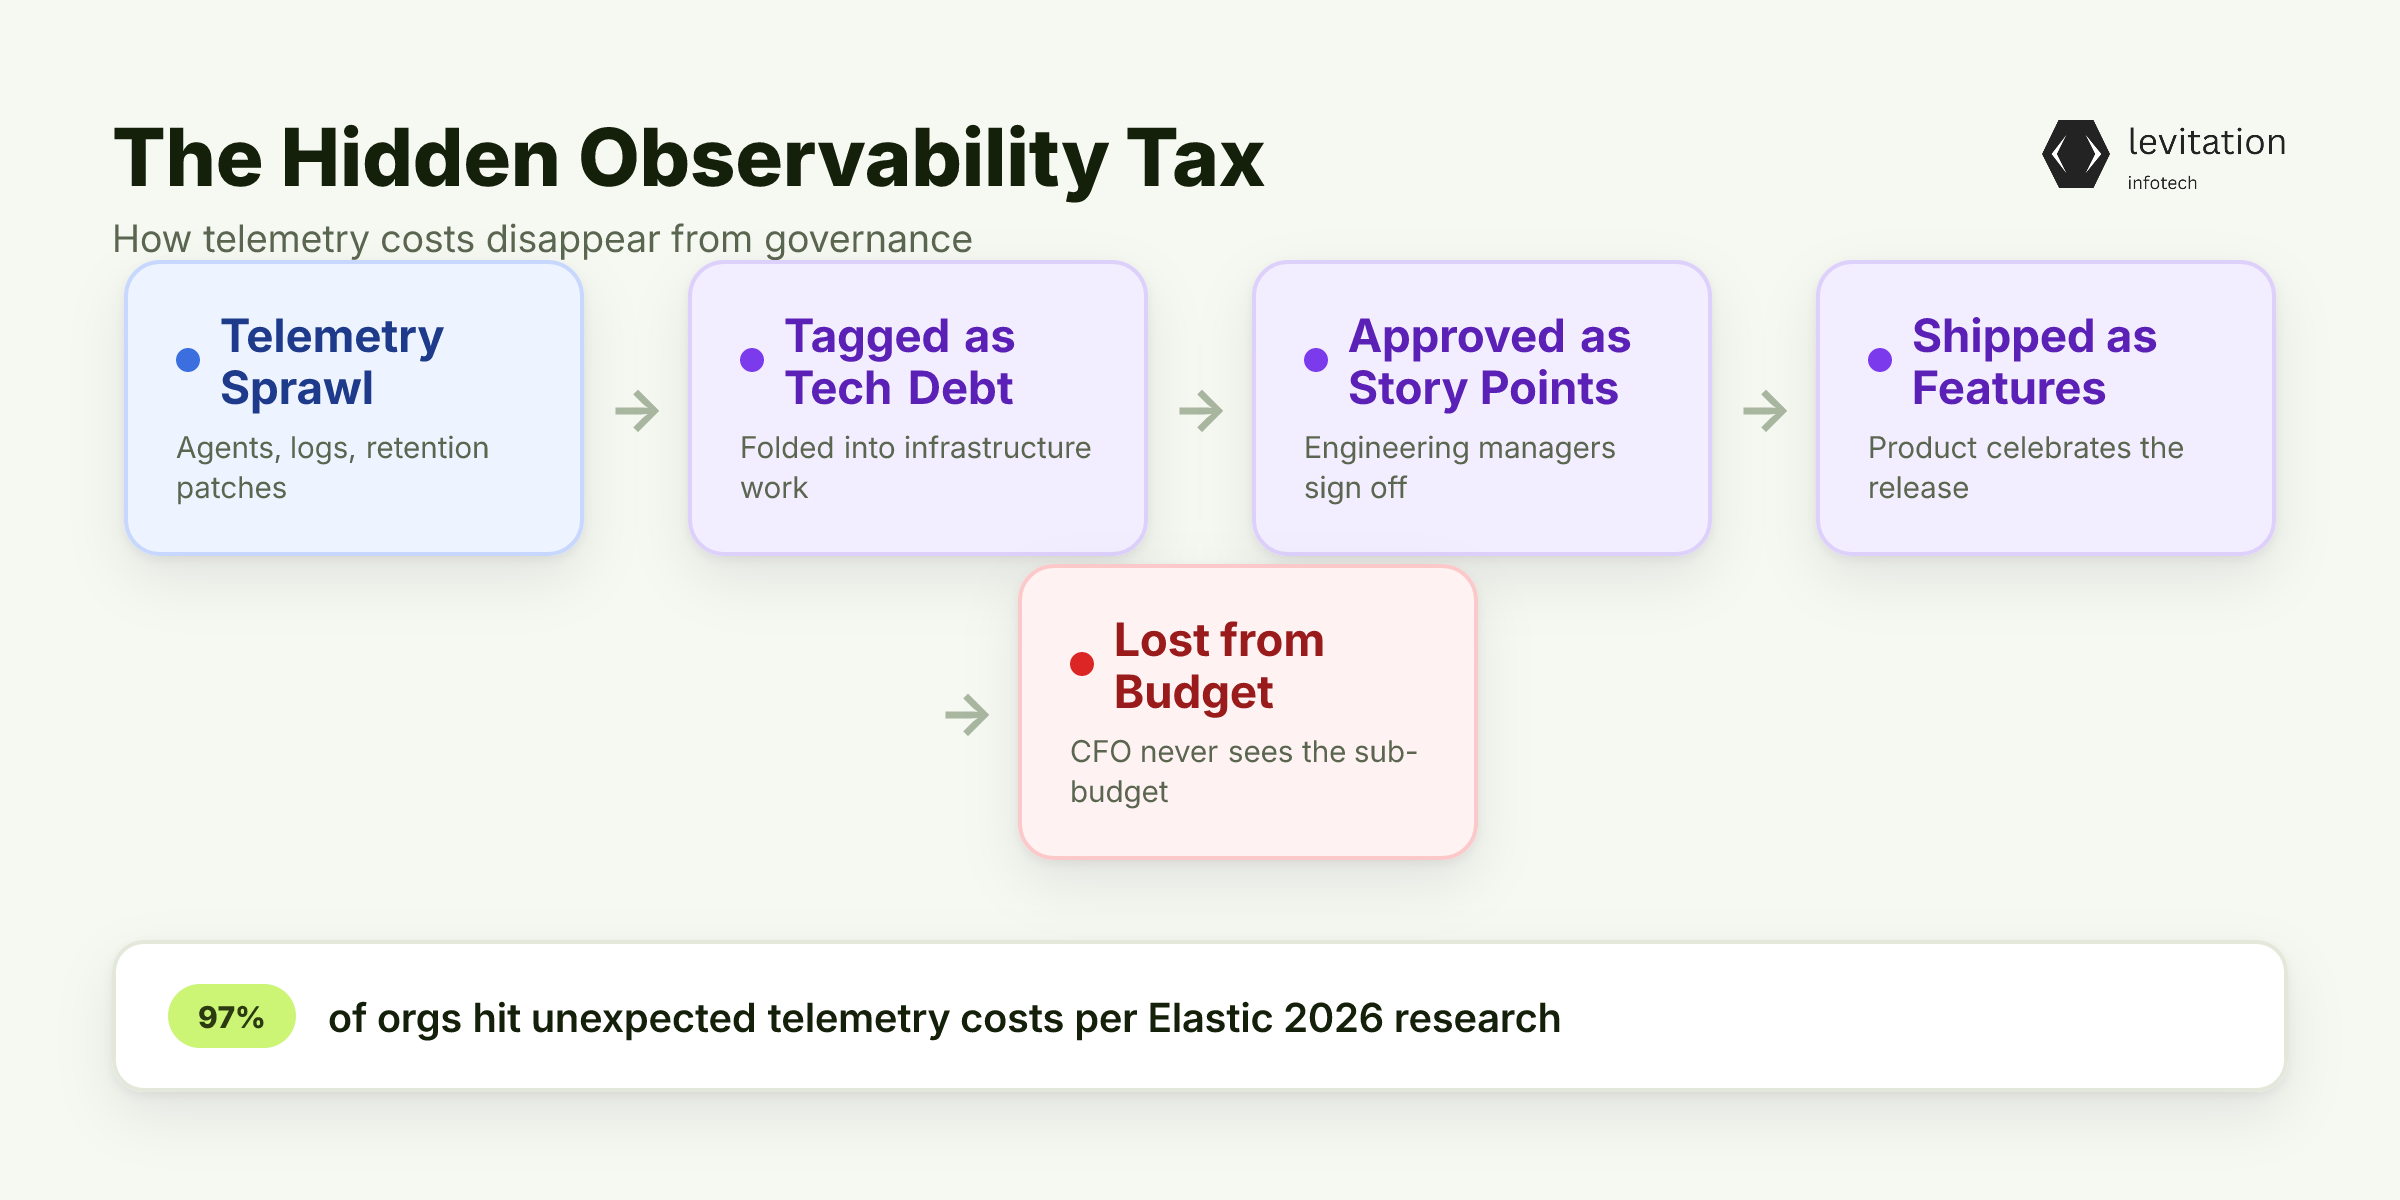
The tax does not show up in a budget line. It shows up as story points tagged "infrastructure," "reliability," or "tech debt." Engineering managers approve them. Product leaders celebrate shipped features. The CFO never sees the sub-budget. It was never a budget line to begin with.
This is not a maturity problem unique to a few shops. The Elastic 2026 IT research found that 97% of organizations have already hit unexpected telemetry costs. 67% say it happens regularly. The pattern repeats inside enterprises. They spend six figures on dashboards. Their leaders cannot defend those dashboards in a board review.
The core tension is structural. Observability is sold as the answer to complexity. It is the thing that lets you debug distributed systems at 2 a.m. But the answer itself has a price. That price is measured in sprints. The cost is paid by individual engineers. They pay it in late-night YAML edits, agent version bumps, and retention-policy patches. These get folded into feature work. Then they are quietly forgotten.
If the tax is this large and this widespread, why hasn't any VP caught it in a quarterly review? The cost lives below every layer of governance. Those layers would normally surface the cost. They were even built to catch it.
Why Observability Overhead Slips Past Every Layer of Review
Telemetry spend is structurally sub-budget. Spans are auto-generated. Agents ship bundled with cloud infrastructure runtimes.
Storage bills get absorbed into devops cost centers. Nobody reads those centers past the first page. By the time a FinOps team reviews the cloud ledger, the telemetry column sits among forty line items. Those line items compete for attention.
Two decisions cause most of the damage. Both decisions happen below the level where anyone reviews them. The first is what to instrument. It is decided by an engineer at 2 a.m. during an incident.
The second is how much to retain. This is set by a default value. No one has questioned it since the cluster was first stood up. Neither decision appears in a change advisory board. Neither decision appears in a procurement review.
Unlike headcount or SaaS licenses, observability cost has no natural owner. It sits between SRE, platform, and product engineering. Everyone uses the dashboards. Nobody is formally accountable for the bill. This is the only major cloud spend that still hides. It hides in the engineering org chart. It does not appear in a FinOps report.
The problem sharpens in regulated environments. Healthcare and financial-services teams have to instrument audit trails, access logs, and PHI or transaction traces. They do this whether the engineering team needs them or not.
Compliance forces broader instrumentation than pure technical needs would. The volume is dictated by the auditor, not the architect.
If the tax were already invisible in 2023, then something in the last 18 months made it dramatically worse. Most VPs have not recalibrated for it yet.
AI Workloads Just Multiplied the Span Tax
A traditional microservice request might generate a handful of spans. An LLM-backed request typically generates dozens. There is one per token batch. There is one per retrieval call. There is one per tool invocation. There is one per evaluation step. The observability cost curve is no longer linear once AI inference is in the path.
AI inference turns a previously predictable span volume into something. That something grows with token count. It also grows with retrieval depth. It also grows with tool-call fan-out. It also grows with evaluation steps.
The Elastic 2026 IT research notes that a request can change. A request that used to produce a handful of spans can now produce dozens. Teams under pressure to show AI progress should not treat telemetry as a phase-two concern.
There is one architectural lever that meaningfully cuts this. It is eBPF-based observability. Traditional agents run in user space. They consume CPU and memory on every host. eBPF programs run in the kernel. They collect the same data with minimal resource overhead.
On Kubernetes workloads, moving collection into the kernel frees CPU and memory. The savings compound across thousands of pods.
Most VP-level dashboards still report the user-space agent number. The kernel number is harder to surface in a vendor portal.
There is also a timing trap. By the time leadership asks for an AI ROI figure, the usage history is often gone. That history would have answered the question. It was cut by a retention policy. That policy was written during a cost panic.
Observability ROI is now a board-level conversation, not a platform-team one.
Five Engineering Velocity Metrics That Expose the Hidden Cost
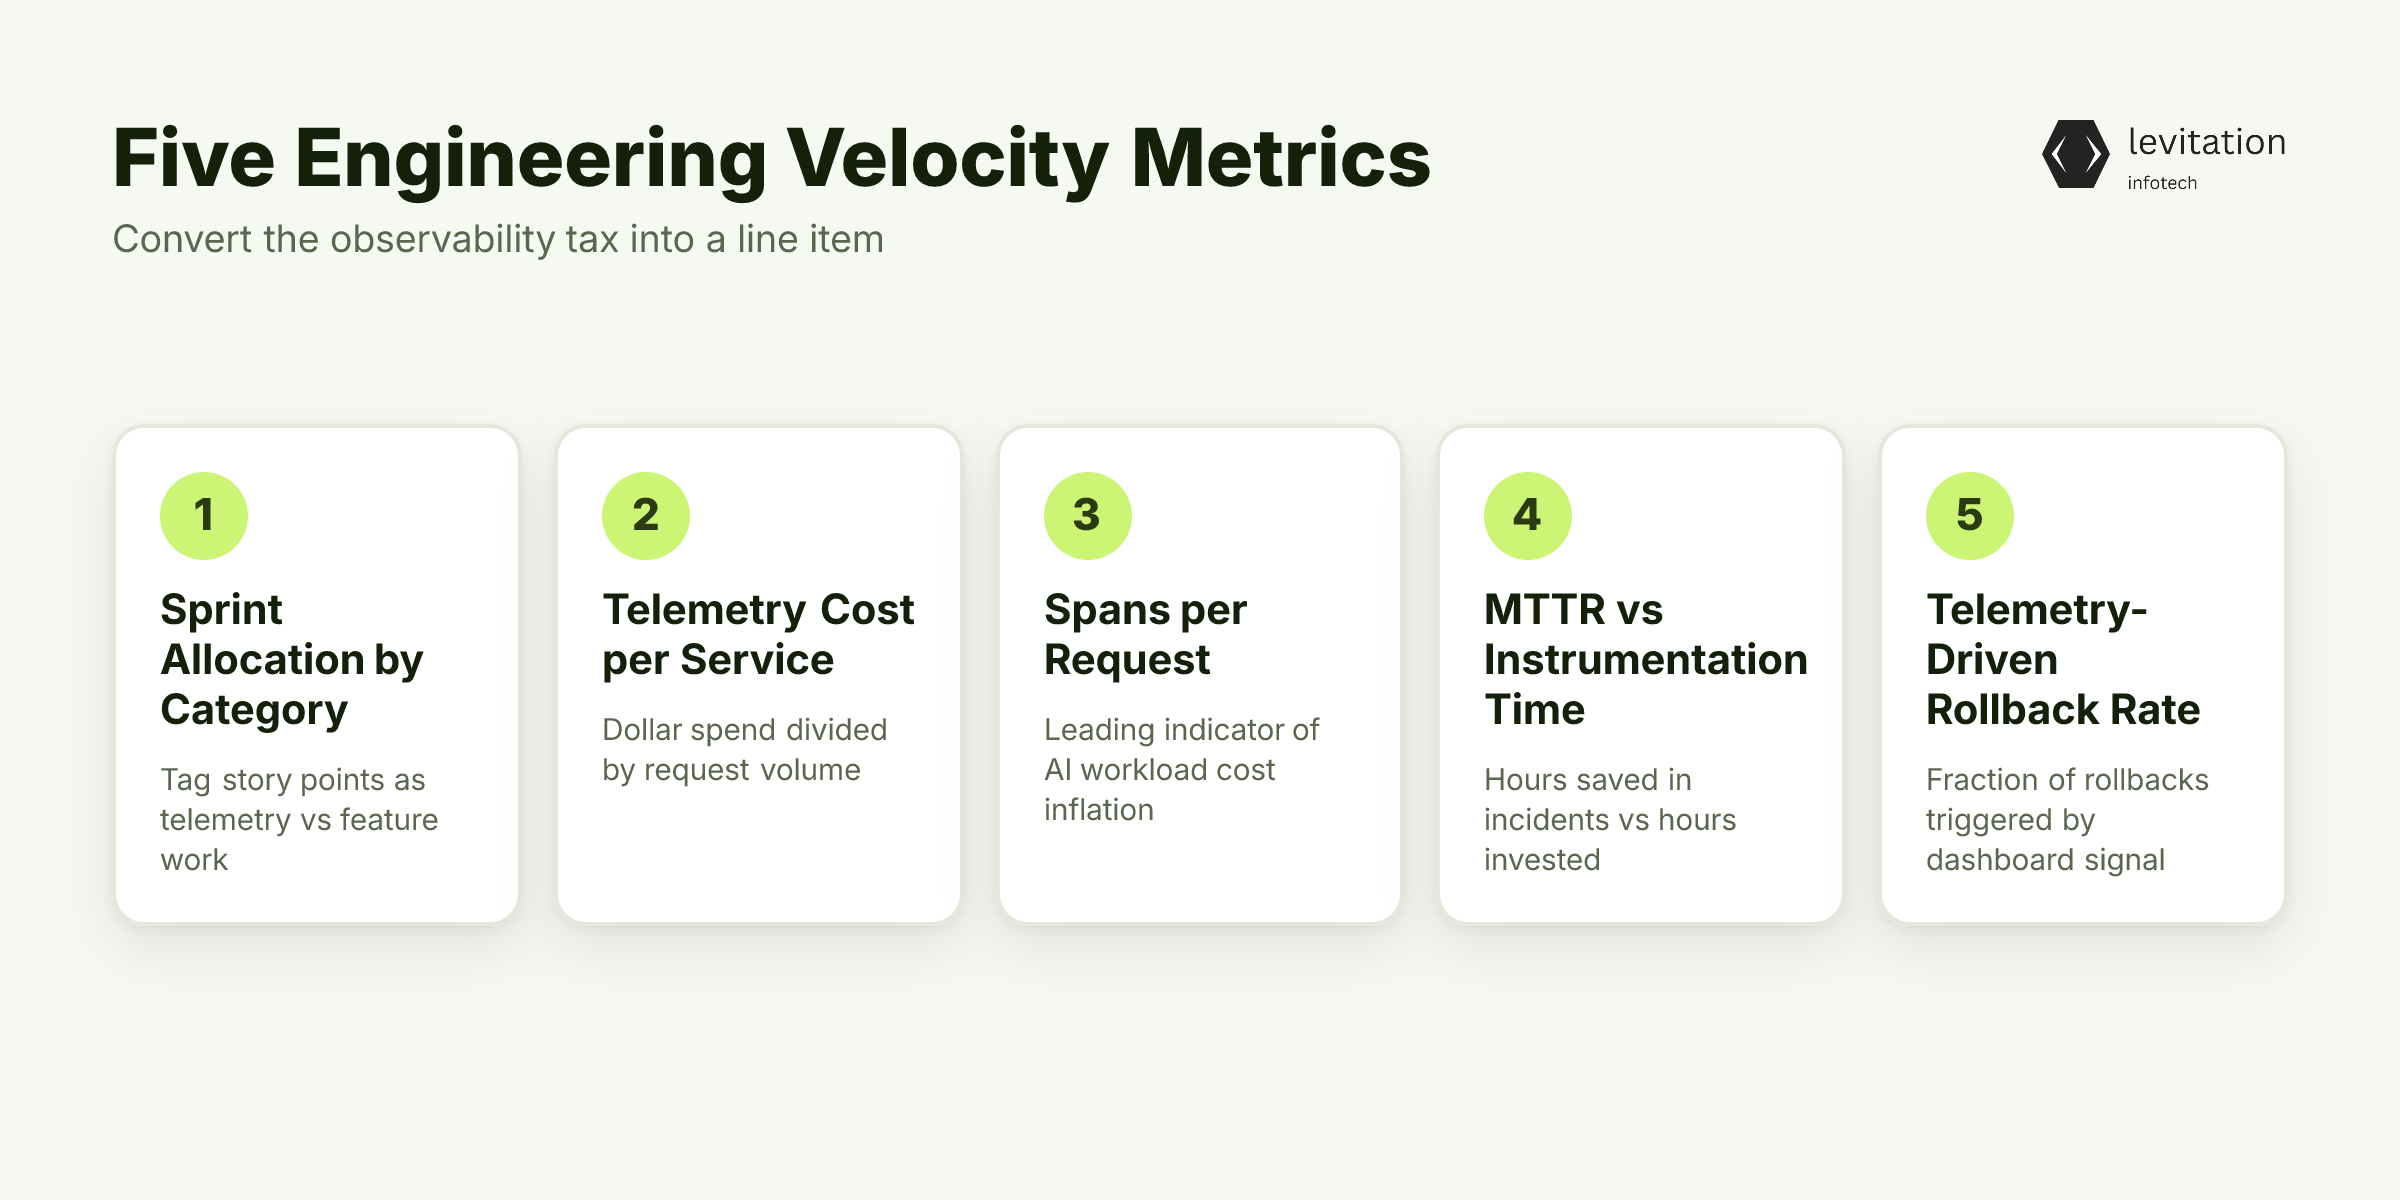
Metrics are how you convert a tax into a line item. These five belong in your next engineering review. - Sprint allocation by category. Tag story points as instrumentation, debugging-telemetry, dashboard maintenance, or feature work. Most teams discover they have been funding observability at feature-work rates. They do this without realizing it. - Telemetry cost per service. Divide dollar spend by request volume. Surface it the same way FinOps surfaces compute per workload. This is the number that travels best to a CFO conversation. - Spans per request. This is the single best leading indicator. It shows whether AI workloads are silently inflating your observability bills. A traditional API generating a handful of spans tells one cost story. An LLM endpoint generating dozens tells a very different one. - MTTR versus instrumentation time. This is the ratio of hours spent building and mending telemetry to hours saved during incidents. If hours saved fall well below hours invested, you are net-negative. This is true no matter how good the dashboards look. - Telemetry-driven rollback rate. What fraction of rollbacks were triggered by what your dashboards actually showed? Compare that to gut calls. This is the real observability ROI number. It ties the spend to outcomes leadership cares about.
A 90-Day Plan to Reclaim Lost Sprints
Days 1 to 30: Audit, then cut. Pull span cardinality and retention by service. Kill the top slice of high-cardinality labels. Those labels exist only because someone added them in 2022. They added them during a frantic postmortem. This step alone often surfaces real annual savings. This is true in a mid-sized cloud security solutions deployment.
Days 31 to 60: Migrate the collection layer. Move from agent-based collection to eBPF where the kernel supports it. On Kubernetes workloads, this typically reduces agent overhead. It does this without losing trace coverage. Engineers stop debugging sidecar crashes. They start shipping features again.
Days 61 to 90: Institute a telemetry PR review gate. Instrumentation changes should require the same review as schema migrations. No more "I added a label at 2 a.m. to debug one incident" creeping into the schema. That schema is the production trace schema.
Sequence the work as a platform initiative, not a tool replacement. Leadership will fund a velocity project where they would not fund a tooling refresh. The sprint tax compounds every quarter you delay.
The real test comes six months after leadership finally sees the number.
What Changes When Leadership Finally Sees the Number
Once the cost is visible, the conversation shifts. Leaders stop asking "do we need observability." They start asking "which observability spend is earning its keep." That is a more productive board question. It is a question CFOs can actually answer.
The real outcome is not a dashboard. It is reclaimed sprint capacity. It is also the ability to say yes to AI features without tripling platform headcount. It is a defensible position. That position matters when the next CFO review asks a question. Why has engineering velocity been flat for two quarters?
The tax stops being invisible the moment you name it.
Frequently Asked Questions
How much of engineering time is typically spent on observability?
Surveys consistently show observability work consumes a growing share of sprint capacity. The figure climbs as AI workloads increase per-request span volume.
Most engineering leaders underestimate the share. The work is distributed across story points. It is not tracked as a single line item.
What is observability overhead and how do you measure it?
Observability overhead is the combined cost of instrumenting code, running collection agents, storing telemetry, and maintaining dashboards. Measure it across four axes. The axes are sprint hours, agent CPU and memory, storage dollars, and span cardinality.
The most useful single metric is spans per request. It surfaces AI-driven inflation right away.
How does AI increase observability costs?
A traditional microservice request might generate a handful of spans. An LLM-backed request typically generates dozens. There is one per token batch. There is one per retrieval call. There is one per tool invocation. There is one per evaluation step.
97% of organizations have hit unexpected telemetry overages. 67% hit them regularly. AI workloads are the primary amplifier.
What is a realistic observability ROI?
Self-reported ROI figures vary widely across enterprise observability deployments. These returns are only realized when the investment is actively measured.
Organizations that treat observability as a set-and-forget platform consistently underperform. They underperform on both cost and reliability.
How can engineering leadership make observability spending visible?
Add telemetry cost as a first-class line in FinOps reporting. Also require the same approval threshold as other cloud spend. Tie engineering velocity metrics like sprint allocation, MTTR, and rollback rate directly to telemetry investment.
Move observability from a platform-team operational concern to a quarterly executive review topic.
About the author
Mayank Singh is a software developer at Levitation Infotech, where he builds web and AI-powered applications across the company’s fintech, healthcare, and enterprise projects.