


TL;DR: Your average latency hides the 1% of requests that ruin user experience. P99, the slowest 1 in 100 requests, drives complaints, timeouts, and SLA breaches.
Most inference orchestrators make P99 worse, not better. Each added layer multiplies variance instead of reducing it. The real fix lives in GPU scheduling and memory management, not another control plane.
Key Takeaways: - P99 is the 99th-percentile of request latency, capturing the slowest 1 in 100 requests - Adding routers, queues, and load balancers multiplies latency distributions rather than averaging them - Continuous batching, disaggregated prefill/decode, and PagedAttention are the mechanisms that actually move P99 - If you can't name the specific failure mode an orchestrator prevents, it's adding latency without value
Your P50 Looks Fine. That's the Problem.
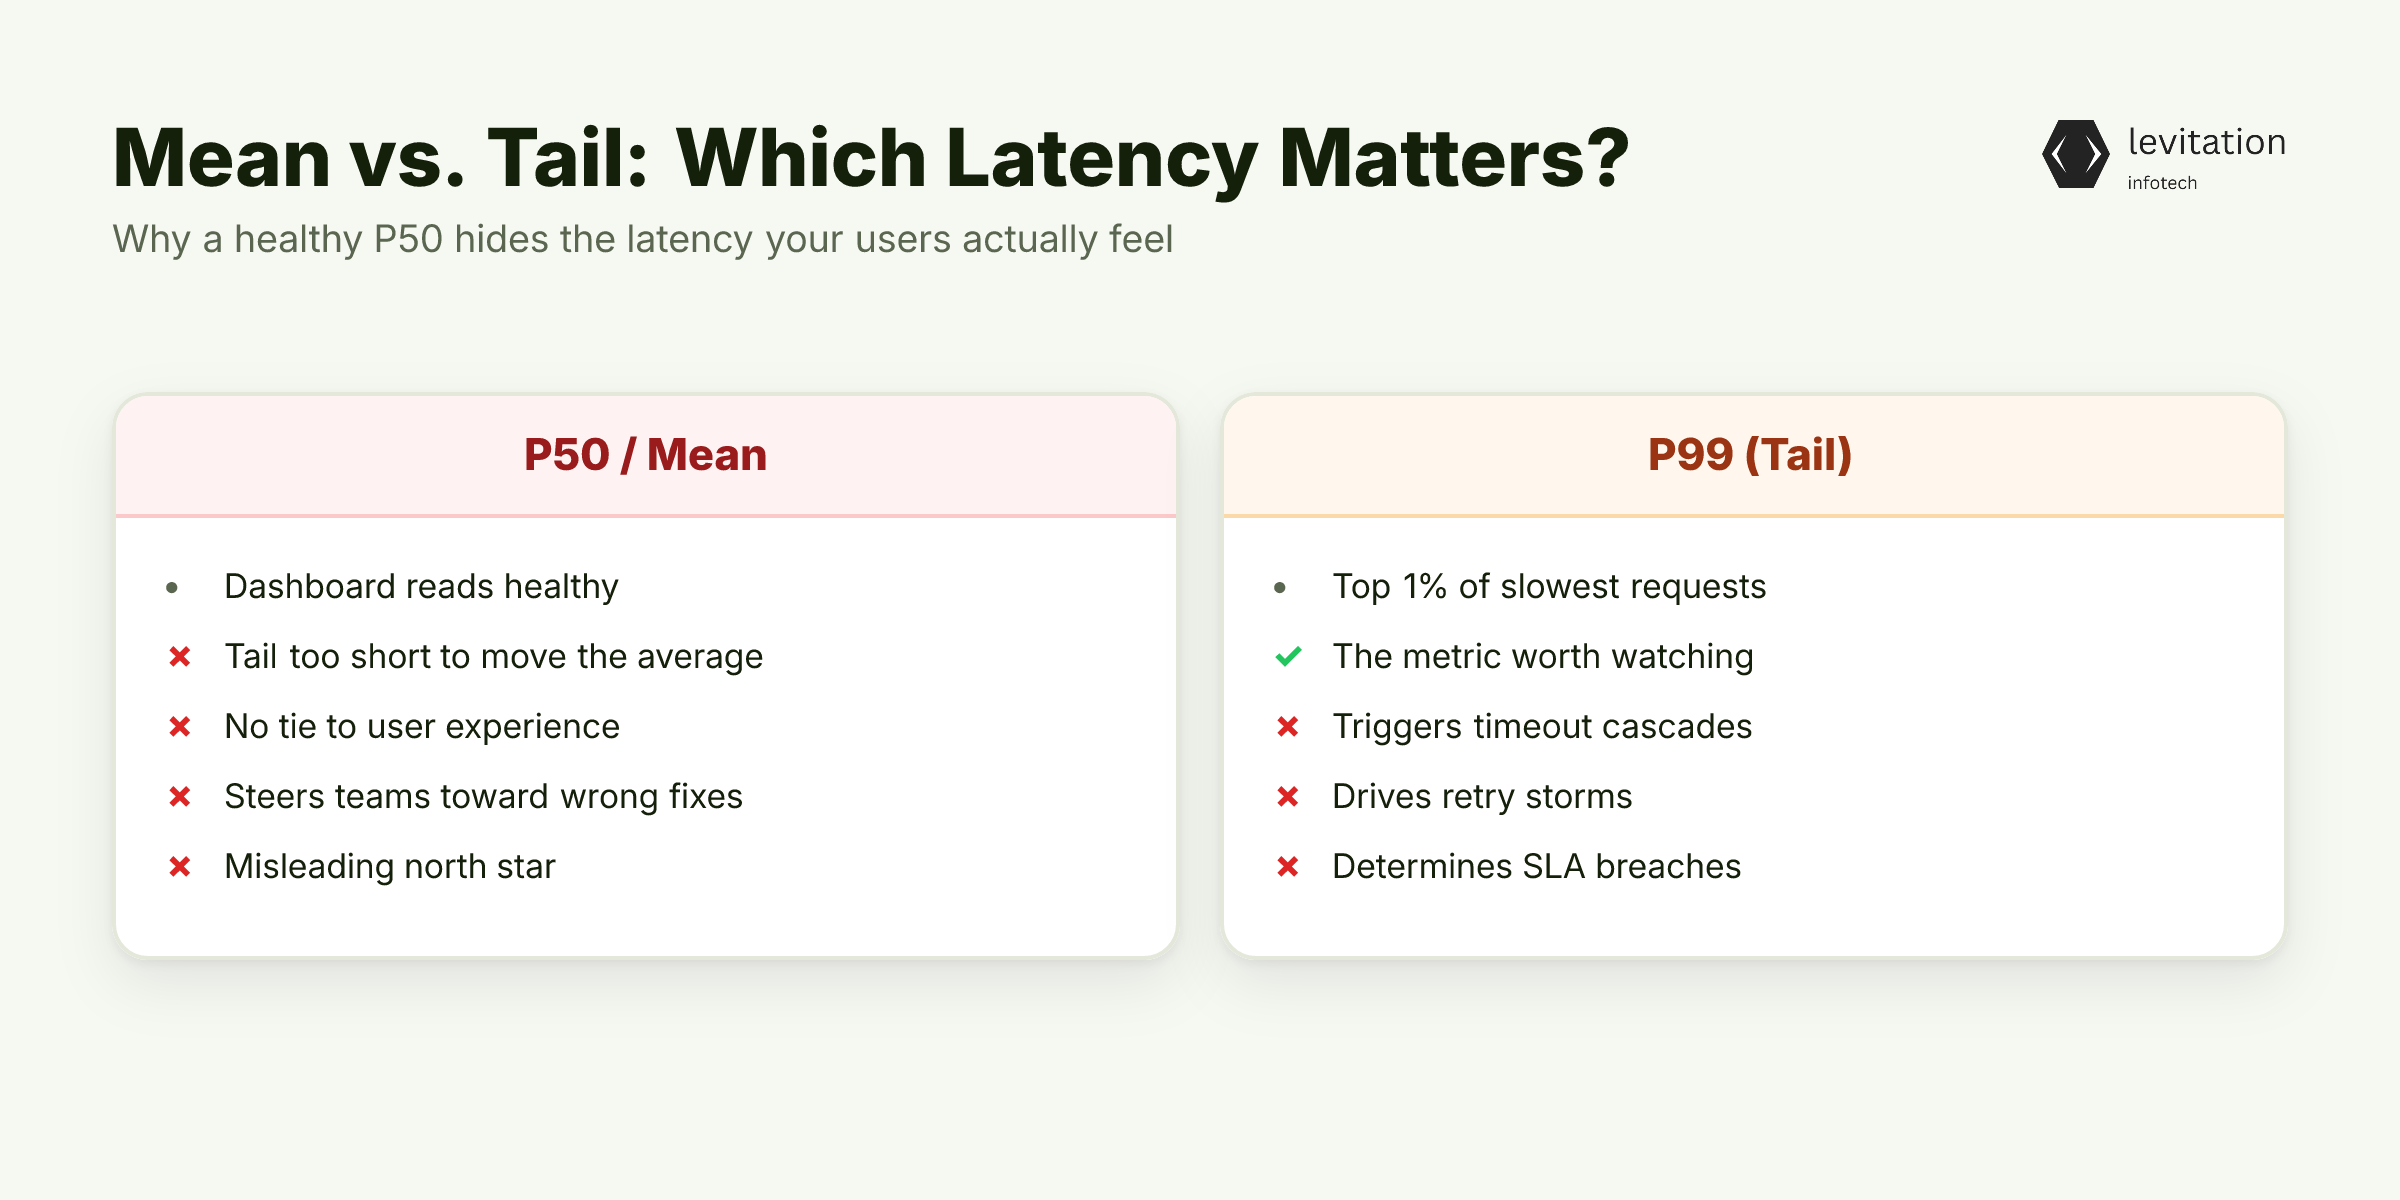
Your dashboard shows a healthy average latency. Your users are still seeing multi-second responses. That disconnect isn't a bug. It's the math of averages working exactly as designed.
P99 is the value at position 99 of 100 when you sort all observed request durations from fastest to slowest. One percent of requests take longer than this threshold. When your mean sits low but your P99 spans multiple seconds, the slowest 1 in 100 requests runs much longer than the typical one. The average doesn't see the tail because the tail is too short to dominate the sum.
This is where user complaints come from. Not the median. Not the average. The 1% that triggers timeout cascades, retry storms, and SLA breaches.
If you're optimizing for inference performance using mean latency as your north star, you're steering toward a metric that has no relationship to user experience.
Most teams notice the pain, panic, and reach for the obvious fix: add an orchestrator. Another layer to route traffic, balance load, manage queues. The instinct is logical.
The outcome is the opposite of what was intended.
Why Adding an Orchestrator Usually Worsens Tail Latency
Each layer you add introduces its own latency distribution. Router hops. Queue waits. Health checks. TLS termination. Load balancer decisions.
These distributions don't average. They multiply.
Adding a router to a healthy baseline doesn't produce a simple sum. It shifts the entire distribution right and grows the variance.
Cold starts from autoscaling triggered by bursty traffic routinely stall the first request hitting a new replica. That single event lands squarely in the tail.
Queue contention in front of GPU workers creates head-of-line blocking. One slow prefill delays every decode behind it. The orchestrator optimizes for utilization, which means high GPU occupancy. This directly conflicts with the goal of low queue depth. These are opposite objectives.
The orchestrator becomes the slowest component in the request path, not the model it claims to manage. Focused vendor deployments ship far sooner than in-house teams building orchestration layers from scratch. The tail gets worse during the entire build.
So if the orchestrator isn't the fix, what's actually causing those P99 spikes?
The Real Culprits Behind GPU Inference P99 Spikes
Four mechanisms drive almost every tail spike you'll see. None of them are orchestration problems. They live in GPU scheduling and memory management.
KV Cache Eviction. When a sequence grows beyond its allocated memory budget, the system evicts and recomputes attention state. The 1% of requests with the longest contexts pay this cost. Everyone else sails through.
The eviction event is a seconds-long stall that shows up in the tail and nowhere else. Cache fragmentation makes it worse. Blocks that could serve the next request sit unused because they don't fit the new request's shape.
Prefill-Decode Interference. Prefill is compute-bound. Matrix multiplies saturate the GPU. Decode is memory-bandwidth-bound. KV cache reads dominate. Mixing them in the same batch means the slowest prefill determines batch completion time. Every decode request in that batch waits for the prefill to finish.
Decode latency inflates for every request waiting behind the slow prefill in the mixed batch. This is an attention scheduling problem, not a routing problem.
Batch Composition Variance. A batch of short prompts finishes quickly. A batch containing one long-context prompt takes far longer. The variance between batch completions is the variance that shows up in P99. Static batching compounds the problem because every batch must wait for its slowest member.
Token-Level Tail Behavior. Even with perfect batching, time-to-first-token (TTFT) and inter-token latency (ITL) follow different distributions. TTFT is dominated by prefill. ITL is dominated by KV cache reads. When these distributions diverge, the user sees it as inconsistent streaming. Some tokens arrive instantly. Others stall.
The tail isn't one number. It's two correlated but distinct distributions. Once you see these mechanisms, the fixes become specific, and none of them require a new control plane. The next question is which lever to pull first.
What Actually Moves P99: Mechanisms That Beat Another Layer
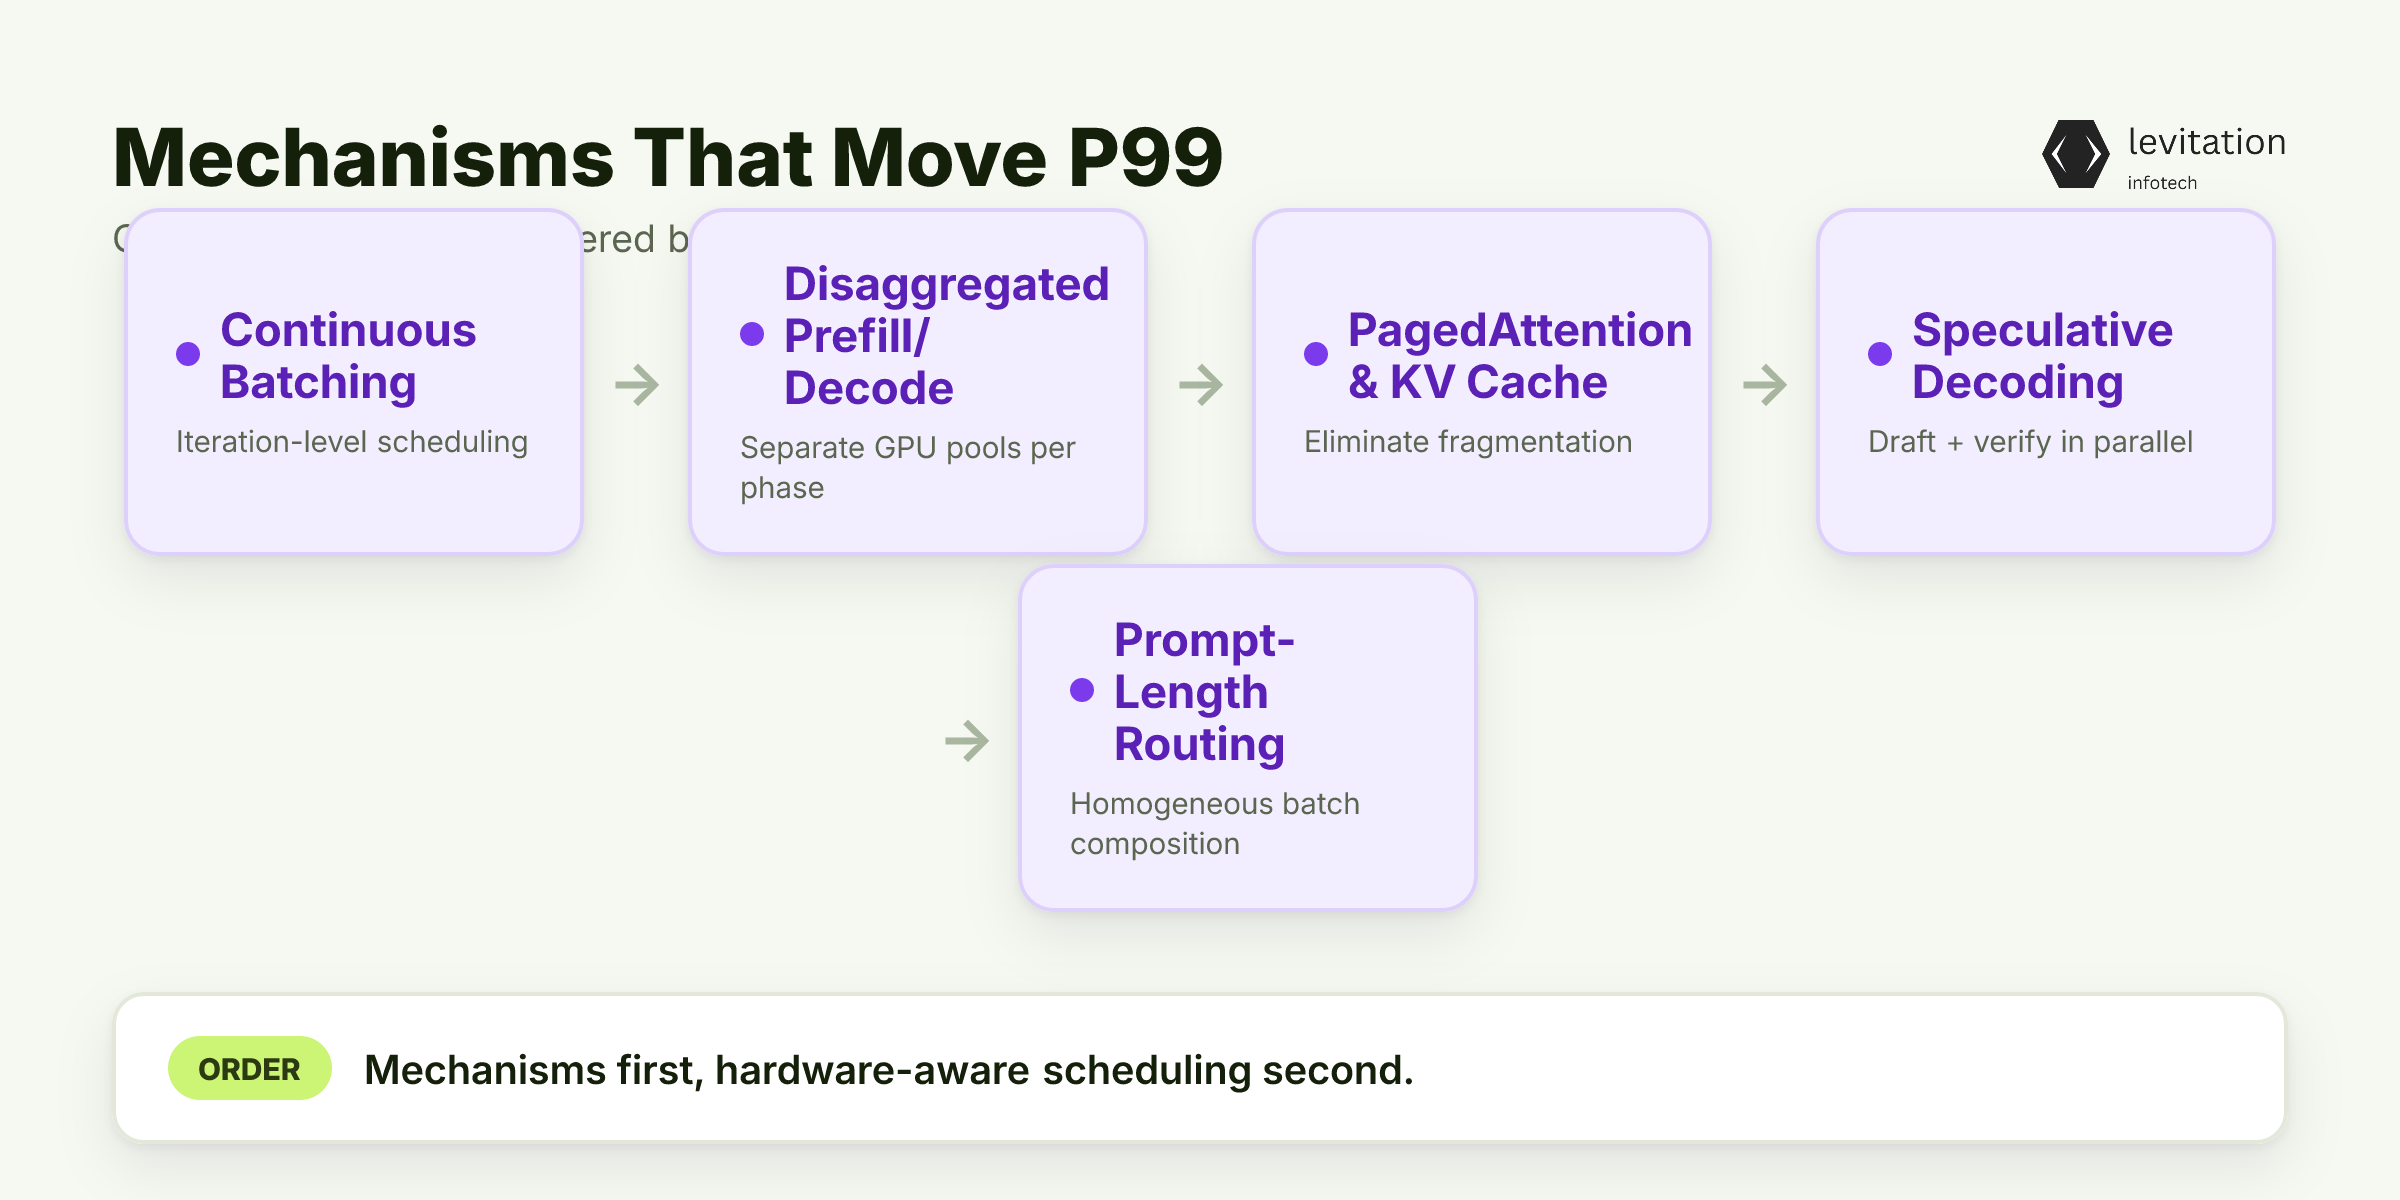
The techniques that actually move P99 are GPU-level mechanisms, not software layers on top.
Continuous batching (iteration-level scheduling) replaces static batching. Requests join and leave the batch at each token generation step. The "one slow prompt ruins the batch" problem disappears. No request waits for batch completion. It just waits for its own next token.
Disaggregated prefill/decode serving splits these phases onto separate GPU pools. Prefill latency stops polluting the decode tail. Compute-bound and memory-bound workloads no longer fight for the same hardware's resources.
This is the highest-impact architectural change for chat workloads. It's why disaggregated prefill/decode is treated as a separate discipline from autoscaling.
PagedAttention and KV cache pooling eliminate fragmentation. Eviction events become rare rather than routine.
KV cache blocks that used to sit unused now serve new requests. Tail latency from cache misses drops sharply.
Speculative decoding uses a small draft transformer to propose tokens. The large model verifies them in parallel. ITL variance compresses because the verify step is constant-time. The propose step is fast and bounded.
Request routing by prompt length bucket ensures homogeneous batch composition. Short prompts go to one pool, medium to another, long to a third.
When every batch contains similar-length requests, batch completion variance collapses. This single change often delivers more P99 improvement than any other operational lever.
NVIDIA Grove and similar hardware-aware schedulers help. But they only help after the software-level mechanisms above are in place. They are accelerators, not foundations.
Teams that have shipped production LLM systems tend to land here. Mechanisms first, hardware-aware scheduling second. The same principle that drives effective fine-tuning (measure the right signal before adding complexity) applies directly to serving architecture.
These techniques are only effective if you're measuring the right thing. Most teams aren't.
Measuring P99 Correctly: An Architect's Measurement Protocol
If your P99 number is wrong, everything you optimize is wrong. Averages cannot represent bimodal latency distributions. They collapse two distinct populations, the 99% and the 1%, into one number that describes neither.
Use histograms. HDR histograms or t-digests give you percentile resolution without storing every request. Averages give you a single number that lies.
Log per-request: prompt token count, output token count, TTFT, ITL, total duration, which GPU served the request. This is the minimum data set that makes root-cause analysis possible. Without it, you're guessing.
The fields that matter for model training data feedback loops are the same fields that matter for tail analysis.
Segment P99 by prompt length bucket. A flat P99 hides that long-prompt P99 is much worse than short-prompt P99.
The "good P99" might be the short-prompt P99. It masks the long-prompt tail causing your user complaints.
Track P99.9 at scale. The 0.1% tail is what triggers timeouts and retries. P99.9 is where SLA breaches originate.
If you're not measuring it, you're seeing the surface and calling it the ocean.
Measure at the user-facing boundary. Post-streaming. Post-tool-calls. Post-retries. Not at the model API boundary, which hides the real number behind a fast first byte. The orchestrator's own metrics are the least reliable.
Compare the P99-to-P50 ratio. When P99 drifts far from P50, your system is not tail-optimized regardless of the absolute number. This metric is the single best health check for any inference infrastructure. It catches bimodal distributions, cache eviction spikes, and batch composition problems that averages miss entirely.
There are real scenarios where an orchestrator earns its complexity. Knowing them prevents you from over- or under-building.
When an Orchestrator Actually Earns Its Keep
An orchestrator is a tool, not a default. It earns its complexity when it solves a specific problem you can name.
Multi-model routing where requests must land on the right model variant (7B vs 70B) based on content classification. Without classification-based routing, you can't run a cost-optimized tiered system.
Multi-region failover with health-aware traffic shifting. Worth the added latency if regional outages are a real risk. Most teams overestimate this risk; some underestimate it badly.
Heterogeneous hardware fleets where requests must be placed based on accelerator type. H100 vs A100 vs custom silicon. The placement decision is non-trivial and benefits from a control plane.
Canary and shadow deployments where a fraction of traffic must be split deterministically. Useful for safe rollouts of new neural network weights and for A/B testing serving changes.
The test: if you cannot articulate which specific failure mode the orchestrator prevents, it is adding latency without adding value. Teams that pass this test keep their stacks simple and their tails honest.
So what does production look like when tail latency is honest and mechanisms do the work?
The Engineering Payoff: Honest Tail Latency in Production
A tail-optimized inference system has a P99 that tracks P50 much more closely than systems with uncontrolled tails. That's the defining characteristic. It's not about hitting a specific number. It's about closing the gap.
Fewer retries. Fewer timeout cascades. Fewer user-visible errors. The system stops fighting itself. The tail is no longer a cliff the system occasionally falls off.
For an LLM serving layer, this is the difference between a cost model that holds and one that grows unpredictably. Teams with controlled tails scale predictably; teams with uncontrolled tails see costs spike at every traffic transition.
Simpler architecture is easier to debug. The failure surface is the GPU, not five software layers stacked on top of it. When something goes wrong, you know where to look.
Production systems built this way report stability from fewer moving parts, not more controls.
Lower operational cost. Fewer replicas are needed to absorb tail variance when the tail is genuinely controlled. The GPU budget stops scaling with P99 spikes and starts scaling with sustained throughput.
The teams that get this right don't add layers. They fix mechanisms. The result is a system that gets more stable over time, not less.
Levitation's GPU-aware scheduler ships these mechanisms out of the box, so your team can focus on the model instead of the tail.
Frequently Asked Questions
What is a good P99 latency for LLM inference?
For interactive chat workloads, low time-to-first-token and low inter-token latency are the relevant targets. The more important metric is the P99-to-P50 ratio. When P99 drifts far from P50, your system has uncontrolled tail regardless of the absolute number. Absolute targets depend on model size and prompt length buckets.
Does NVIDIA Grove replace the need for an inference orchestrator?
NVIDIA Grove is a hardware-aware scheduler that places workloads intelligently across GPU topologies. It addresses placement and topology awareness. It does not solve batching, KV cache management, or prefill-decode interference on its own. It is a complement to the software-level mechanisms (continuous batching, PagedAttention, disaggregated serving) that actually move P99.
How does continuous batching affect P99 versus P50?
Continuous batching primarily helps P50 by increasing throughput. It helps P99 even more by eliminating the "one slow prompt in the batch" problem. With static batching, P99 is determined by the longest possible batch completion. With continuous batching, requests stream in and out. P99 converges toward the distribution of individual request decode times, not batch completion times.
What is the difference between P95 and P99 for inference workloads?
P95 catches the slowest 5% of requests. P99 catches the slowest 1%. For inference, the gap between them is often large because tail behavior is heavy-tailed. A small number of very slow requests (long contexts, cache misses, prefill spikes) dominate the right tail. P95 will look acceptable while P99 reveals the real user experience problems. Always measure P99 at minimum, and P99.9 at scale.
Can KV cache eviction cause P99 spikes in GPU inference?
Yes. When a sequence exceeds the allocated KV cache budget, the system must either evict and recompute attention state (adding seconds) or trigger a memory reallocation that stalls the GPU. Both events land in the tail. PagedAttention and KV cache pooling reduce eviction frequency. The dominant lever is request routing by prompt length. This ensures no single request exceeds the cache budget allocated to its batch.
About the author
Mayank Singh is a software developer at Levitation Infotech, where he builds web and AI-powered applications across the company’s fintech, healthcare, and enterprise projects.