


TL;DR: llm-d 1.0 makes distributed inference a first-class production topology rather than a single pod. Treat the request execution graph as the incident unit. Use route, worker, cache, and accelerator evidence to contain failures and rehearse recovery.
Key Takeaways: - Green fleet metrics can hide a broken request path. - Every incident needs traceable route, worker, accelerator, and cache context. - Recovery must be scoped, rehearsed, and validated against request behavior.
When Every GPU Is Healthy but the Request Is Broken
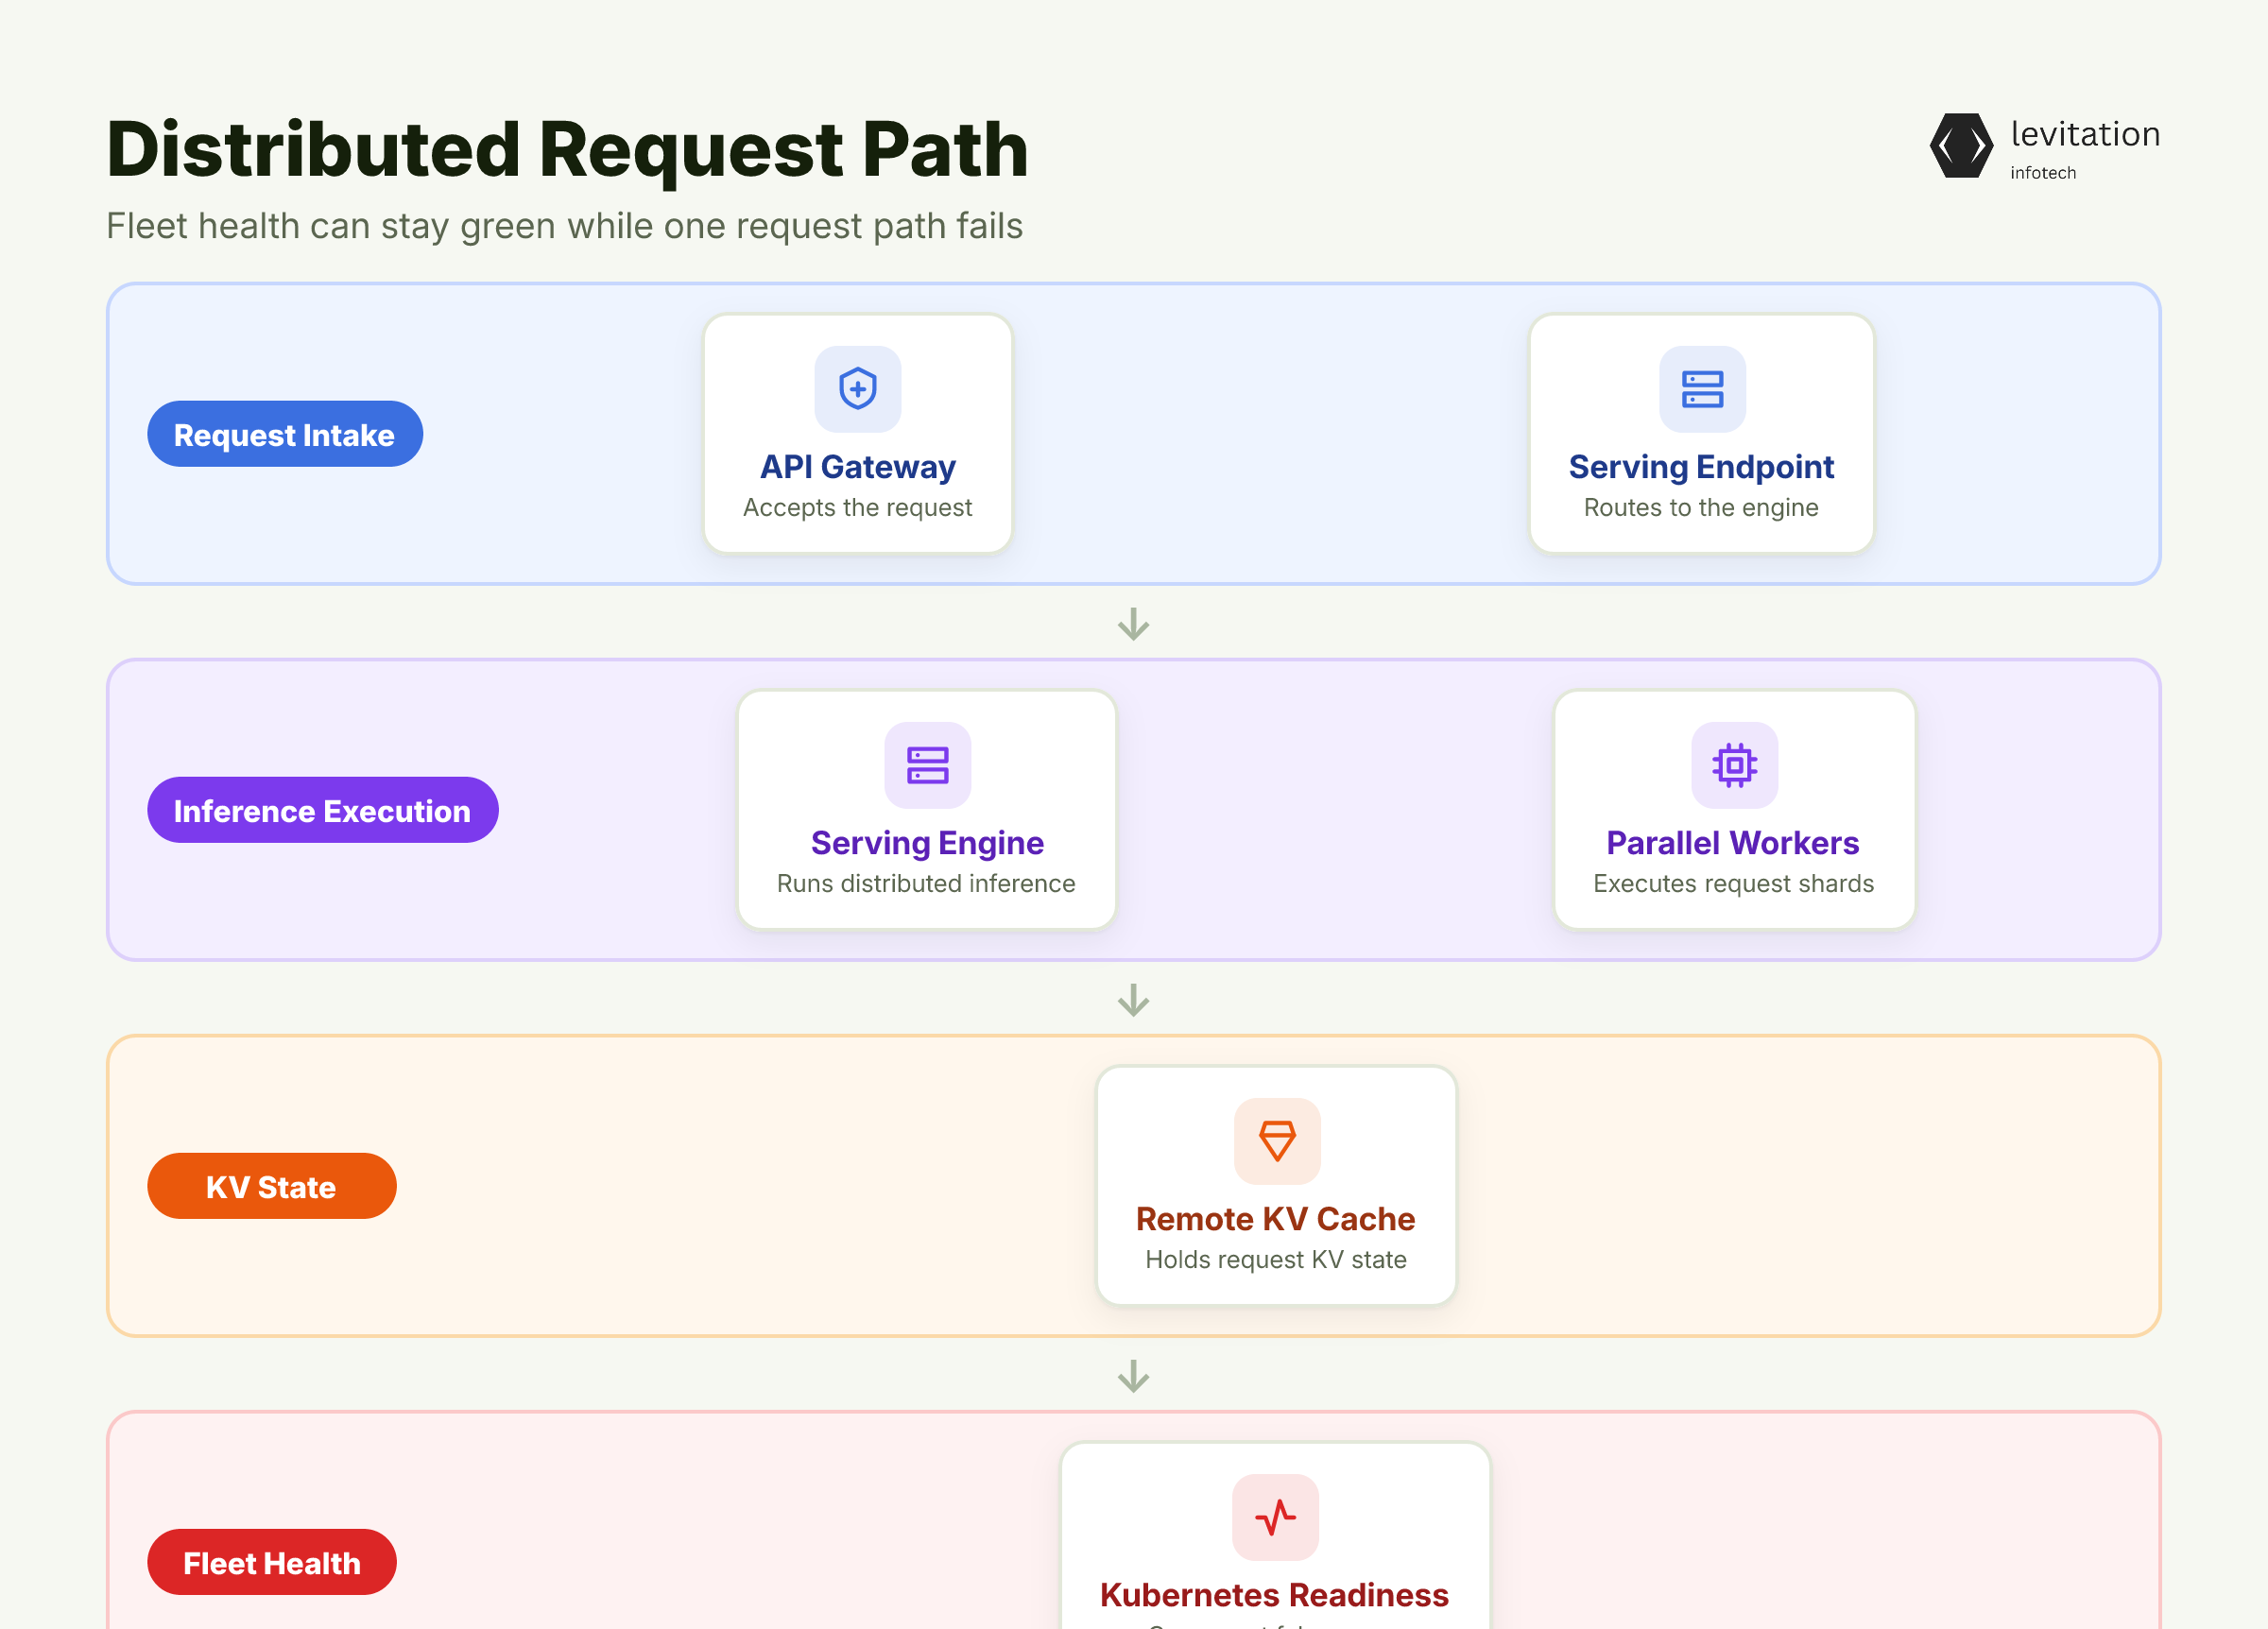
Every GPU can look healthy while one distributed inference request stalls. The request can use the wrong cache or wait on a degraded worker set.
At that scale, restarting the pod is not a recovery plan. It is a reliability bug waiting to become an outage.
A request can cross a gateway, an endpoint, a serving engine, parallel workers, and a remote KV cache. Kubernetes can call every pod Ready while the shared request path fails.
Start with placement:
1NAMESPACE="${NAMESPACE:?set NAMESPACE}"2kubectl get pods -n "$NAMESPACE" -o wide --show-labels
That command shows location, not causality. A responder still needs to know: - Which endpoint accepted the request? - Which engine and worker group ran it? - Which cache tier held the request's KV state?
llm-d 1.0 changes the operating unit. Its Kubernetes-native stack coordinates distributed inference across Google TPUs and NVIDIA, AMD, and Intel accelerators. That makes a one-machine runbook structurally incompatible with distributed LLM inference.
Shared AI/ML training capacity adds another dependency to the topology. Investigate one request path before changing shared infrastructure. If fleet health stays green while requests fail, what should the responder inspect first?
Why One-Machine Runbooks Miss Distributed LLM Failure Domains
The assumed failure boundary has moved
A pod, endpoint, and request are no longer interchangeable health units. A pod can be alive while its worker group cannot communicate. An endpoint can accept traffic while its cache location defeats the route.
llm-d 1.0 combines Kubernetes orchestration with distributed inference serving. The Gateway API Inference Extension supports endpoint selection.
1client2 -> Gateway API Inference Extension3 -> endpoint and replica4 -> vLLM or SGLang5 -> worker and parallel groups -> accelerator6 -> KV cache tier
Each layer creates a distinct failure surface: - Routing: Prefix- and load-aware routing makes route selection part of diagnosis. - Caching: KV cache offloading adds cache-tier dependencies and transfer latency. - Parallelism: Wide expert parallelism adds worker-group placement and coordination risks.
Old assumptions break one by one
The old model says, “The pod is Ready, so the request is healthy.” Distributed inference breaks that assumption in several ways. - Model weights and runtime memory can span accelerators. - KV state can live in a remote cache tier. - Replica readiness does not prove request-path health. - Heterogeneous accelerators do not have identical performance behavior. - A route can preserve load balance while losing prefix locality.
This also explains why multi-node inference can turn tenants into roommates. Placement, isolation, and routing now share one failure boundary.
Adopting a supported stack and operating model differs from building a custom control plane, cache tier, GPU router, and incident system. Reusing distributed mechanics lets teams focus on SLOs and model behavior.
The answer is not a longer checklist. Runbooks need a different object: the path the request actually took. Which edge failed first?
Make the Request Execution Graph the Runbook Object
Define one execution graph per request
Store one normalized execution graph for each request. Every incident record should point back to it.
Capture these required fields: - Identity: Request or trace ID, conversation or session ID, and model version. - Selection: Endpoint, replica, inference engine, routing reason, and route-decision timestamp. - Topology: Worker and parallel-group IDs, node, zone, accelerator type, and expert-parallel group. - State: Cache tier, prefix affinity, and the cache decision made for the request.
Add these fields when the architecture needs them: prefill and decode roles, tenant, prefix placement, and worker-group state.
Normalize gateway and worker telemetry into newline-delimited JSON. This query extracts the responder's path:
1jq -r '[.request_id, .trace_id, .session_id, .endpoint, .replica,2 .engine, .model_version, .worker_group, .parallel_group,3 .node, .zone, .accelerator_type, .cache_tier,4 .expert_parallel_group, .routing_reason, .prefix_affinity,5 .route_decision_at] | @tsv' request-trace.ndjson
This closes the gap described in LLM gateway logs without inference telemetry.
Replace one dashboard with a health hierarchy
Compare these layers before declaring the incident scope: - Fleet capacity and accelerator availability - Endpoint eligibility and routing policy - Worker-group and parallel-group readiness - Request-level errors and queueing - KV cache behavior and prefix locality
Within that hierarchy, accelerator-aware routing is dynamic, not a static load balancer. A healthy load score can still produce a poor route when cache location, engine version, or accelerator cohort changes.
Keep AI/ML training requests separate unless they share the same execution path. Without a reconstructed request graph, restart, drain, rollback, and reroute remain unsafe choices. Which signal should trigger each action?
Rebuild the AI Incident Response Runbook in Five Steps
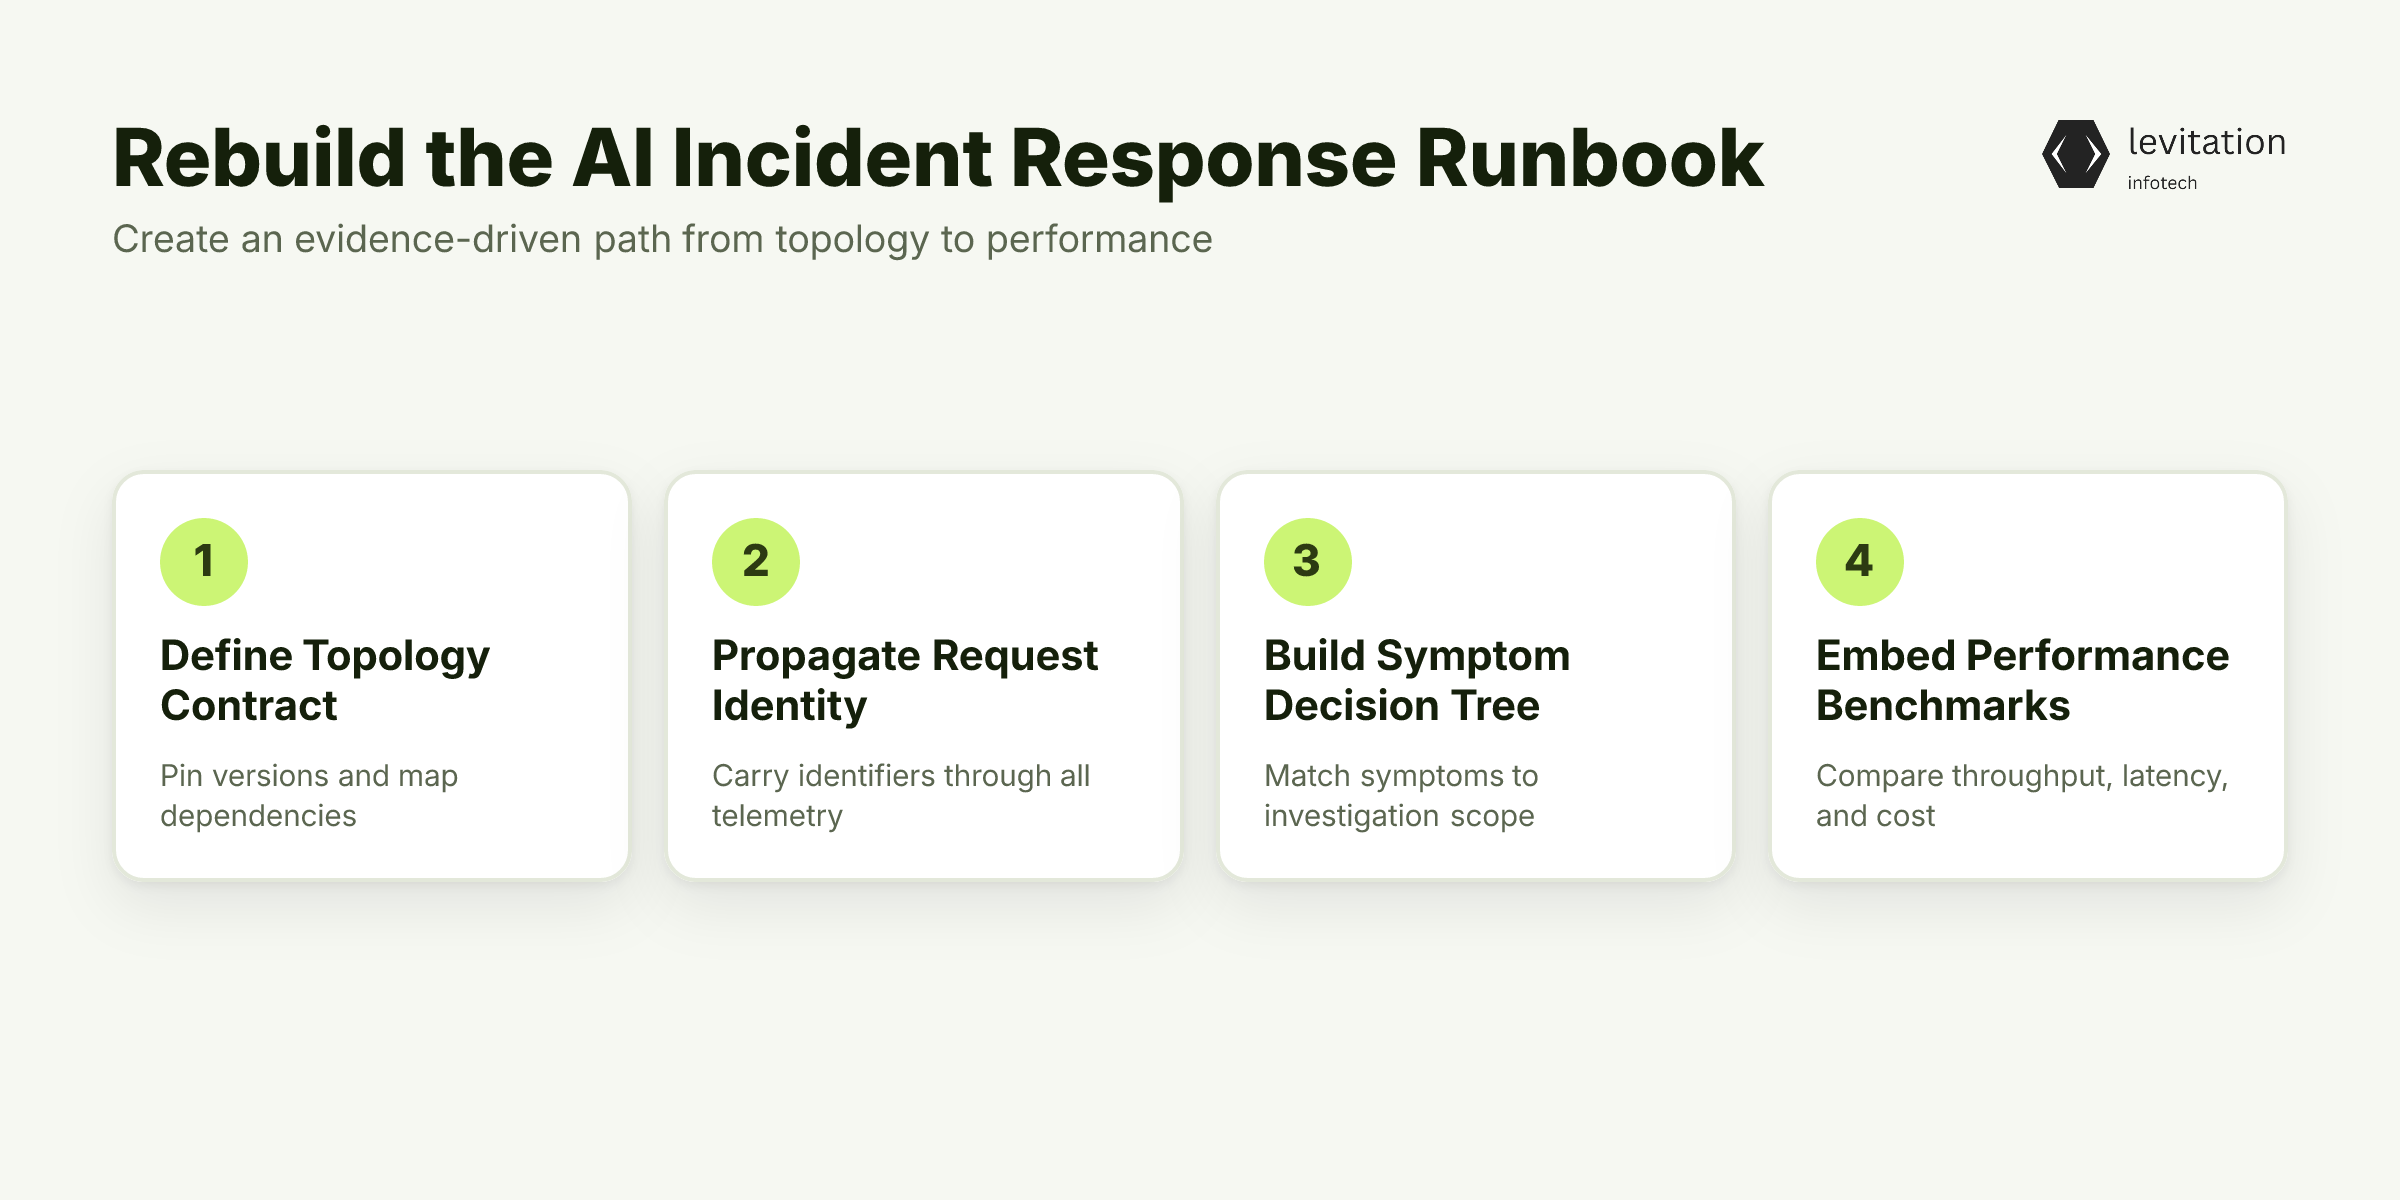
1. Create a topology contract
Pin the llm-d 1.0 release, Helm chart, gateway and kgateway components, inference-engine versions, model versions, and accelerator types. Map every endpoint to its node, zone, cache tier, tenant, and parallel group.
Mark shared AI/ML training dependencies explicitly. A shared node is part of the blast radius until proven otherwise.
1NAMESPACE="${NAMESPACE:?set NAMESPACE}"2RELEASE="${RELEASE:?set RELEASE}"3POD="${POD:?set POD}"45kubectl get pods -n "$NAMESPACE" -o wide --show-labels6helm history "$RELEASE" -n "$NAMESPACE"
Labels must map back to the execution graph. Otherwise, Kubernetes evidence remains disconnected from the failed request.
2. Propagate request identity
Pass request, trace, session, conversation, and model identifiers through gateway and worker telemetry. Join those identifiers to: - Route decisions and prefix placement - Queue depth and KV cache utilization - Time to first token and inter-token latency - Throughput, errors, retries, and cost
The objective is evidence continuity. A trace should lead directly to the selected route, running workers, accelerator cohort, and cache dependency.
3. Build a symptom-to-scope decision tree
Use symptoms to narrow the search: - One conversation: Check prefix affinity, session routing, and cache placement. - All new conversations on one engine: Check route policy and that engine's worker groups. - One accelerator cohort: Compare that fleet slice against the others. - Failure after rollout: Check version skew, route changes, and cache configuration.
Collect Kubernetes evidence only after joining those labels to the request graph:
1kubectl describe pod "$POD" -n "$NAMESPACE"2kubectl logs "$POD" -n "$NAMESPACE" --all-containers3kubectl get events -n "$NAMESPACE" --sort-by=.lastTimestamp
4. Make benchmarking part of the runbook
Use Prism with standardized `llm-d-benchmark` recipes and `inference-perf` workloads. Inspect the exact configuration behind each result. Upload local runs when needed.
Compare throughput, latency, and cost curves before and after each change. This matters because an AI cost dashboard can hide burst behavior. Benchmarks also expose regressions that a green pod list cannot.
5. Define rollback boundaries
Document deployment and rollback boundaries together. A responder should be able to roll back a route, replica cohort, engine version, or cache configuration.
1REVISION="${REVISION:?set target revision}"2helm rollback "$RELEASE" "$REVISION" -n "$NAMESPACE"
Do not default to a fleet-wide rollback. It changes too many variables and can destroy the evidence needed to explain the failure.
A graph-aware runbook only protects production if the team rehearses the failures that a dashboard cannot explain. Which partial failure will your team test first?
Drill Partial Degradation Without Amplifying the Incident
Build a failure matrix around real llm-d boundaries
A useful drill removes one dependency at a time: - Remove one worker from a parallel group. - Drain one node serving the selected cohort. - Degrade one accelerator type. - Make one cache tier unavailable. - Saturate one route or tenant. - Introduce engine-version skew during a canary rollout.
Each drill should define the expected scope and the symptoms that should not appear. If responders cannot distinguish those signals, the topology contract is incomplete.
Contain first, repair second
Use a fixed containment order:
- Declare the observed scope.
- Preserve request and topology evidence.
- Stop unbounded retries.
- Isolate the affected route or replica cohort.
- Drain affected work instead of restarting repeatedly.
- Restore service through the smallest viable path.
- Validate recovery with a canary request.
Cap retries at both client and orchestration layers. Use exponential backoff with jitter, and track the total attempt budget.
1import json2import os3import random4import time5import urllib.error6import urllib.request7import uuid89payload = os.environ["LLM_PAYLOAD_JSON"].encode()10headers = {11 "Content-Type": "application/json",12 "Idempotency-Key": str(uuid.uuid4()),13}1415for attempt in range(4):16 try:17 request = urllib.request.Request(18 os.environ["LLM_ENDPOINT"],19 data=payload,20 headers=headers,21 method="POST",22 )23 with urllib.request.urlopen(request, timeout=30) as response:24 print(response.read().decode())25 break26 except urllib.error.HTTPError as error:27 if error.code < 500 or attempt == 3:28 raise29 except (urllib.error.URLError, TimeoutError):30 if attempt == 3:31 raise32 time.sleep(min(2 attempt, 8) + random.uniform(0, 0.25))
Cancel or drain in-flight work where appropriate. Otherwise, a timed-out generation can continue running and then appear again on a healthy replica.
Separate blast radius from service health
llm-d 1.0 supports multi-tenant deployments. Contain a noisy tenant or model cohort with tenant- or cohort-scoped isolation rather than declaring the entire serving pool unhealthy.
Rehearse zero-downtime upgrades without assuming every replica updates atomically. If inference shares nodes with AI/ML training, isolate the inference cohort before draining shared capacity.
Measure each drill with the same Prism-based workload used for normal performance analysis. Check time to first token, inter-token latency, throughput, cost, cache behavior, and error rate.
Reopen traffic only when: - The worker set is healthy again. - Route selection matches the expected policy. - Cache placement and prefix locality behave normally. - A canary request completes successfully.
A green pod list is not an exit criterion. Done properly, these drills turn uncertain fleet-wide intervention into bounded, evidence-backed recovery. What changes when recovery becomes graph-aware?
What Changes When Recovery Becomes Graph-Aware
Restarting stops being the reflex. Responders identify the smallest affected request path, worker cohort, route, or cache dependency.
That shift produces several operational changes: - Fewer blind restarts and fleet-wide rollbacks - Safer expansion across heterogeneous accelerators - Clearer boundaries for canary and version upgrades - Better use of cache-aware routing - Capacity decisions based on request behavior, not raw GPU counts
The important change is diagnostic. Capacity looks different when requests have different context sizes, cache affinities, parallel groups, and latency targets.
At the platform level, partner deployment history and retention can inform selection. Neither replaces local drills, SLOs, or evidence from your own topology.
If inference and AI/ML training share operators or infrastructure, mark that dependency before declaring recovery complete.
The remaining questions are practical. Which pieces should every team standardize, and which must remain local?
Runbook FAQ for Distributed Inference Teams
What is the correct incident unit?
Use the request execution graph. It connects request identity to routing, engine, worker group, accelerator, cache tier, and model version.
What should the responder inspect first?
Reconstruct the route before changing shared infrastructure. Check endpoint selection, engine version, worker groups, accelerator cohort, cache placement, queue depth, and KV cache behavior.
1NAMESPACE="${NAMESPACE:?set NAMESPACE}"2SERVICE="${SERVICE:?set SERVICE}"3kubectl get endpointslices -n "$NAMESPACE" \4 -l kubernetes.io/service-name="$SERVICE"
Which metrics expose routing and cache problems?
Watch queue depth, KV cache utilization, prefix locality, time to first token, inter-token latency, throughput, and cost together. Use Prism and standardized benchmark runs to compare the same configuration before and during an incident.
Does llm-d 1.0 support heterogeneous accelerators and on-premises clusters?
Yes. llm-d 1.0 supports Google TPUs and NVIDIA, AMD, and Intel accelerators across managed cloud and on-premises environments. This makes fleet-aware diagnostics and routing essential.
Is automatic restart safe?
Not by default. Restart only when the failure boundary proves that one pod owns the fault. Roll back only the affected route, replica cohort, engine version, or cache configuration.
Preserve request and topology evidence before either action. A blind restart can discard evidence and duplicate work.
If inference shares nodes, networking, or operators with AI/ML training, include that dependency when defining the blast radius.
Use the request execution graph, not a single pod, to guide your next incident review. Which current runbook still assumes that the pod is the failure?
About the author
Mayank Singh is a software developer at Levitation Infotech, where he builds web and AI-powered applications across the company’s fintech, healthcare, and enterprise projects.