


TL;DR: Inference cost is not a rate. It is a sequence of spikes. Your averaged dashboard hides the spike mechanics that drive spend. Bursts in traffic, attention compute, and queueing retry storms account for most of the bill. The fix is burst-aware architecture plus per-request instrumentation, not a better spreadsheet.
Key Takeaways: - Inference traffic follows power-law distributions, not averages. A 10-minute spike can dominate a 24-hour cost window. - Token billing from providers like OpenAI and Anthropic adds opacity because token cost does not map linearly to GPU-seconds during attention-heavy bursts. - Up to 80% of AI budgets go to inference at scale, making burst management the dominant cost problem, not a corner case. - The fix is per-request instrumentation, separate steady-state and burst budgets, and metrics that survive bursty traffic like cost-per-completed-outcome at P99.
The Morning Report That Costs You a Million Dollars
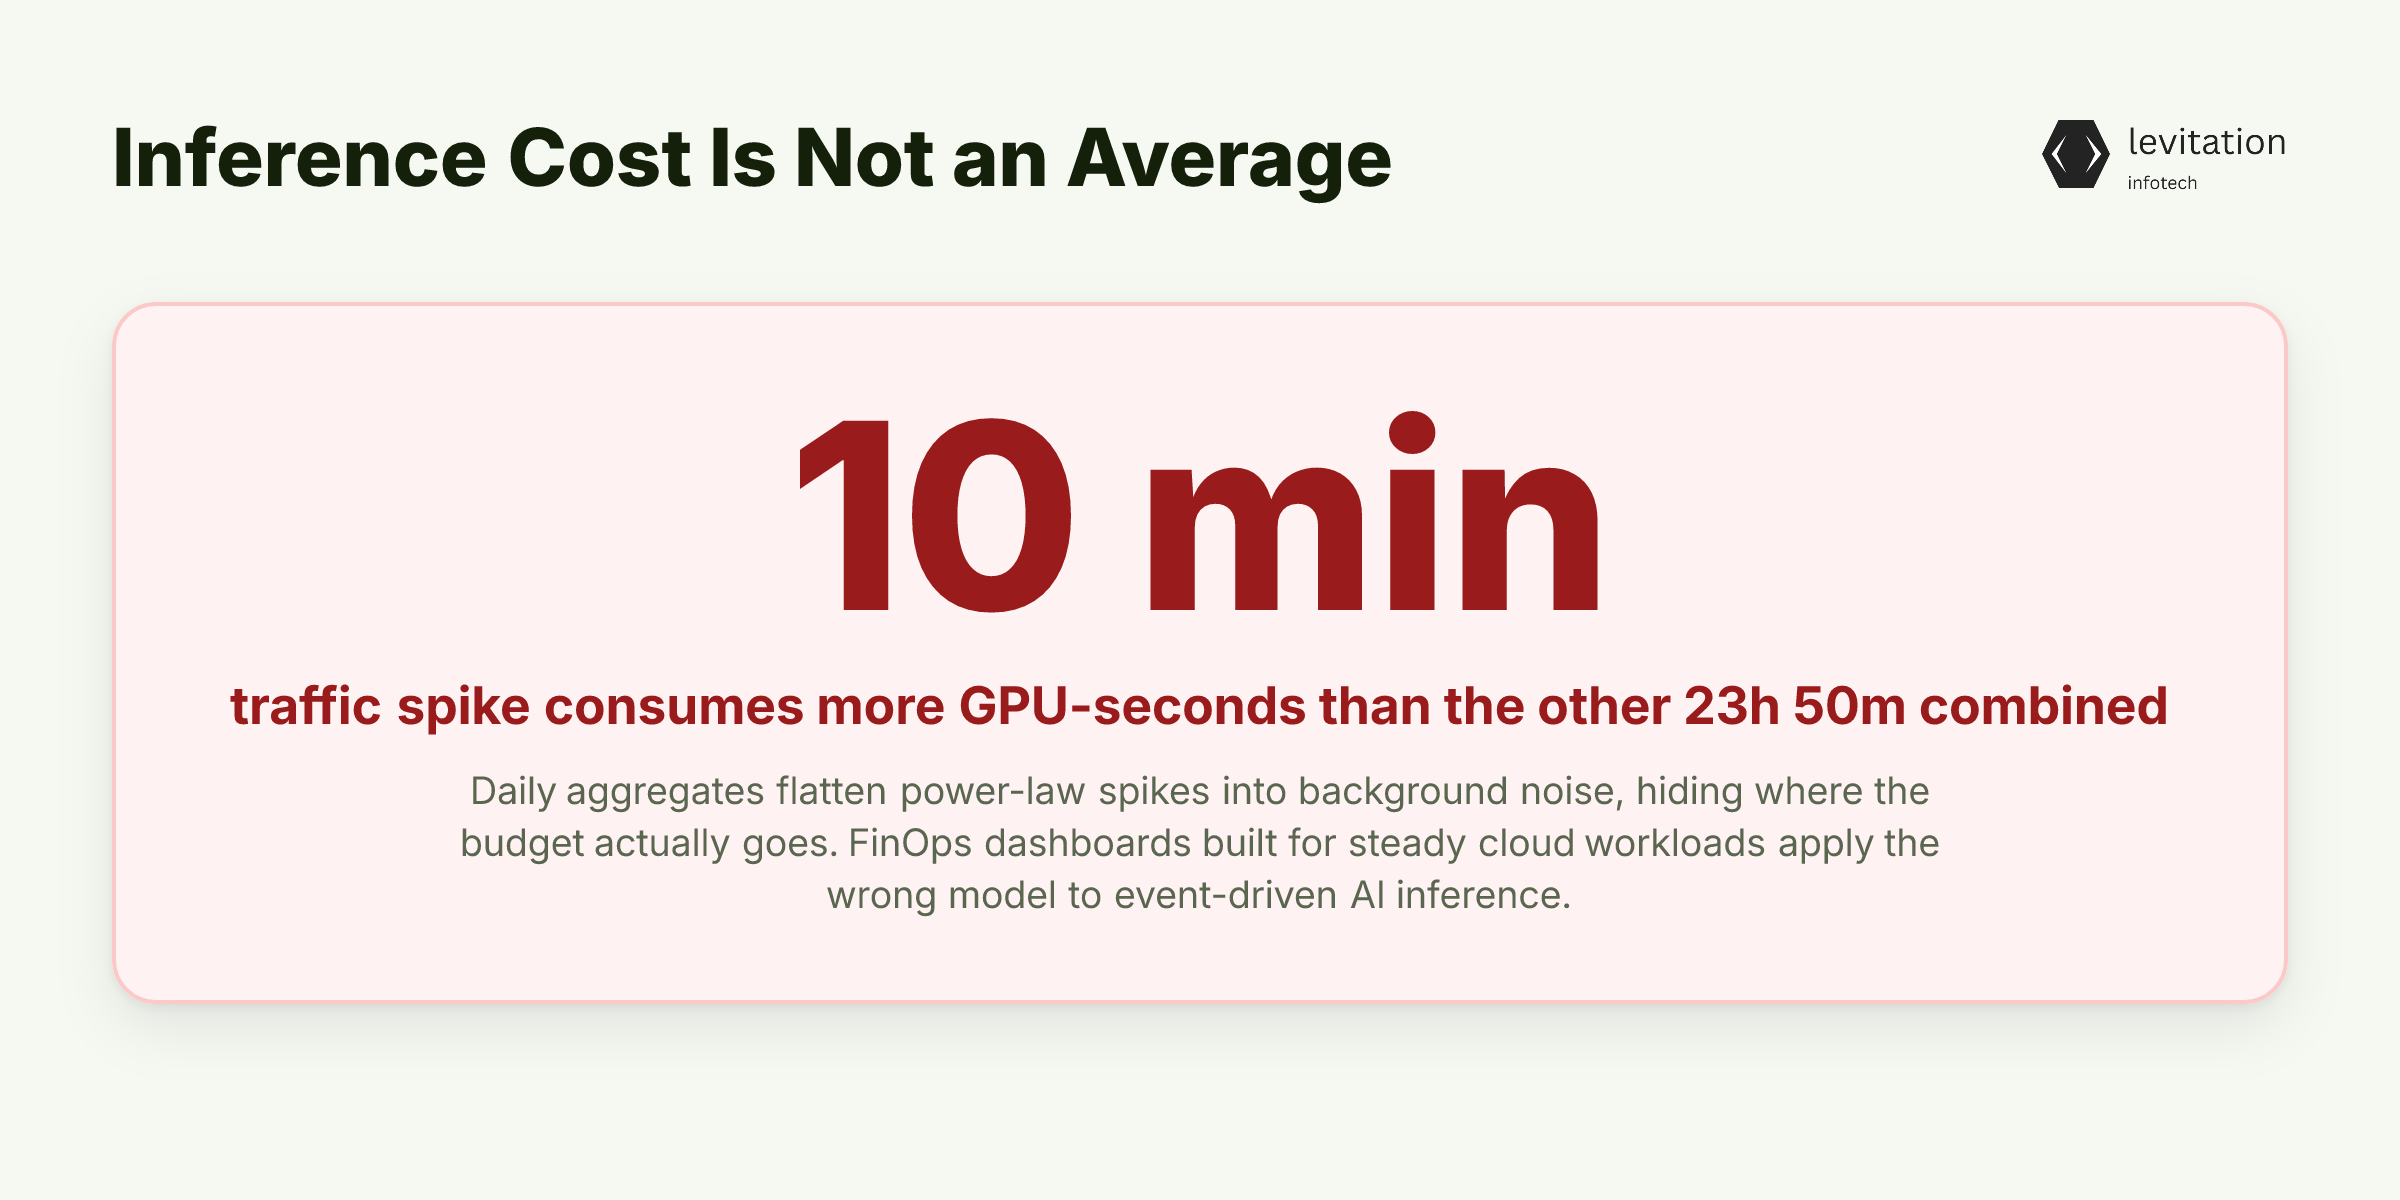
Your morning cost report shows a daily aggregate for inference. That number is a lie, not because someone fabricated it, but because inference does not have an average. It has spikes. The spikes are where your budget actually goes.
Most CTOs see a daily or hourly cost aggregate and treat it as a rate. Inference traffic is not a rate. It is a series of events with power-law tails.
A 10-minute traffic spike can consume more GPU-seconds than the other 23 hours and 50 minutes combined. Yet the daily average flattens it into background noise. The variance is the signal. Averaging kills it.
FinOps dashboards built for steady cloud workloads apply the wrong statistical model to AI workloads. Think S3 storage and always-on VMs. The smoothing is where the money disappears. A report that reads "AI cost is flat at a consistent daily amount" is technically true and operationally useless.
This is not a dashboard bug. It is a category mismatch. A tool designed to bill storage by the gigabyte-month cannot model a transformer context window. That context window costs orders of magnitude more than a short prompt.
The dashboard does what dashboards do. It averages. The underlying inference workload is not an averageable quantity. It is event-driven. Events do not average, and neither does your bill.
Why Averages Are Structurally Wrong for Inference
Cloud cost dashboards sample at fixed intervals. They apply linear interpolation. That math assumes cost is proportional to time. Token-based billing breaks that assumption entirely.
Consider a burst of 10,000 long-context requests in three minutes. That spike can blow through a model's context window. It can trigger KV cache eviction. It can force re-computation on the next request. A cost the daily average cannot see.
A CFO looks at the same invoice and sees a smooth trend line. Engineering sees a jagged sawtooth. Both are right. The gap between them is the FinOps problem nobody is solving.
The opacity gets worse with providers like OpenAI and Anthropic. Token-based billing introduces another layer. The unit of cost, tokens, does not map cleanly to GPU-seconds.
A 2,000-token chat reply is cheap. A 2,000-token request that triggers attention over a 100K-token history is a different beast. The token count on your invoice tells you only what the provider bills you for. The compute behind it tells a different story entirely. Attention cost scales quadratically with context length. Your dashboard reports the former. The cluster pays for the latter.
This is the gap we documented when tracking LLM costs from 100K to 100M tokens across enterprise workloads.
If averages are the wrong lens, what is the right one? You have to look at the actual shape of inference traffic. The shape is sharper than most teams expect.
The Three Faces of an Inference Burst
A burst is not one thing. It is three distinct cost events. They often stack on top of each other inside the same 10-minute window. - Traffic bursts. User-facing chat and RAG pipelines have circadian rhythms. Monday morning, end-of-quarter, product launches. These create request floods with multi-x baseline multipliers. The daily average spreads them across the quiet hours. - Compute bursts. Long-context requests force quadratic attention cost in transformer models. A single 128K-token request can cost orders of magnitude more than a short one. A cluster of them is a burst your dashboard does not price correctly. Each request looks normal in isolation. - Queueing bursts. When GPU capacity is saturated, requests queue, time out, and retry. The retry storm creates a second burst on top of the first. Effective load doubles or triples. The cold-start penalty on idle GPU nodes pays a warm-up tax in throughput-per-watt. It disappears within minutes but inflates per-request cost for the first wave.
Sources consistently show that up to 80% of AI budgets now go to inference. The burst problem is not a corner case. It is the dominant cost surface for production AI. Teams that treat it as an edge condition keep discovering that their edge case is the whole bill.
Now that you can see the shape of a burst, the next question follows. What is your dashboard doing to the cost mechanics underneath it? The answer is worse than you think.
What Your Dashboard Misses: The Hidden Cost Mechanics
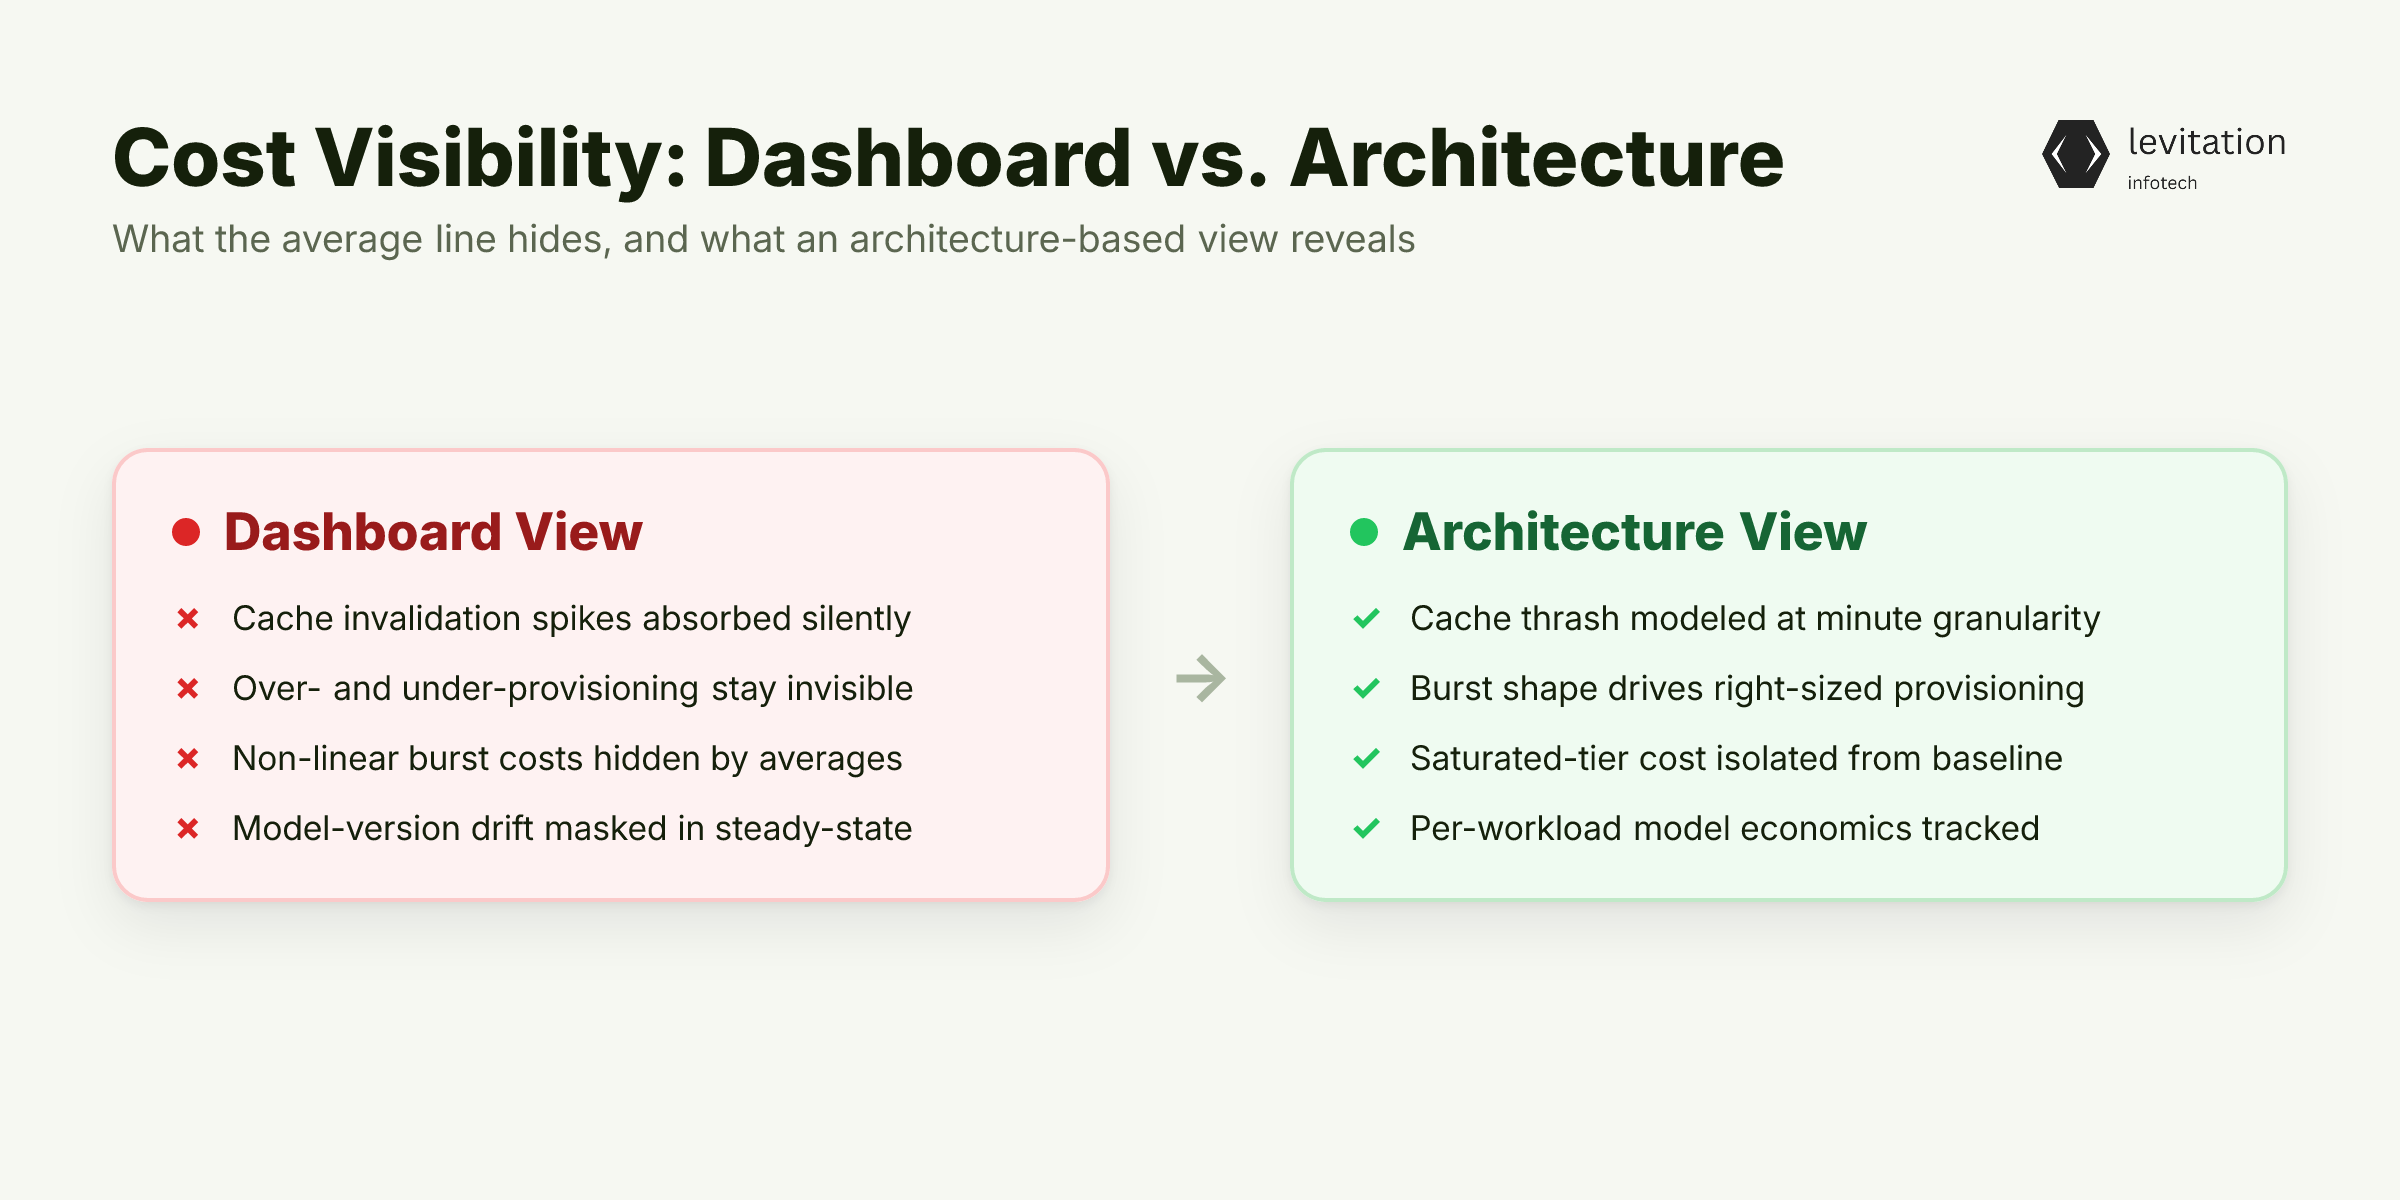
Your average cost line is a straight diagonal. The cost mechanics underneath it are anything but. Here is what the dashboard flattens. - Prompt cache invalidation. Providers now offer prompt caching. A burst that changes context windows or fills cache capacity wipes the savings in seconds. The next several minutes run at full list price. Your daily average quietly absorbs that spike without flagging it. - Provisioned vs. pay-as-you-go mismatches. Teams that buy provisioned throughput to handle bursts often over-provision. They cannot predict burst shape. Teams on pay-as-you-go get throttled and pay retry-storm penalties. Both outcomes are dashboard-invisible. The auto-scaling trap compounds the problem. - Non-linear scaling. AI costs scale non-linearly with usage. The last 20% of capacity during a burst is the most expensive. Your average cost line is a straight diagonal that hides this entirely. A workload that costs a fraction of a cent at baseline can hit several cents per request during a saturated burst. - Model-version drift. A model upgrade that is cheaper on paper can be more expensive during bursts. The new model may have different context-length economics. The dashboard reports the steady-state win while the bill reveals the burst loss.
These mechanics are why FinOps tooling built for VMs misses AI workloads. The pattern repeats across industries like banking, healthcare, and insurance. The cost is real. The visibility is not. The diagnostic is identical: dashboards built for steady-state cloud spend cannot model event-driven inference cost.
Seeing the mechanics is necessary but not sufficient. The real question is what you build on top of this understanding. Architecture, not another dashboard, is where the durable fix lives.
Building a Burst-Aware Inference Architecture
Architecture is the only durable fix. The dashboard tells you after the money is gone. The architecture tells you before. Here is the sequence that works in practice. - Step 1: Instrument per-request cost, not per-hour cost. Tag every request with token count, context length, model version, and queue wait time. You need to replay bursts from the data, not infer them from the invoice. If you cannot reconstruct a burst after the fact, you cannot prevent the next one. - Step 2: Separate steady-state and burst budgets. Provision baseline capacity on committed-use discounts where unit economics are predictable. Route overflow to spot or serverless GPU pools where burst pricing is granular. The two budgets need separate line items, separate owners, and separate forecasts. - Step 3: Pre-warm before predictable bursts. The cold-start penalty is avoidable if you know the burst is coming. End-of-month reports, product launches, batch jobs. Schedule scale-up several minutes ahead so the GPU warm-up window has already passed when traffic lands. - Step 4: Cap context length during bursts. A hard ceiling on tokens-per-request during peak windows prevents the quadratic attention cost from compounding the traffic spike. This is the single most powerful knob in burst-aware design. - Step 5: Route by latency tier. Not every request needs a frontier model. A burst-aware router sends simple queries to smaller models. It reserves the expensive ones for requests that actually need them. This is how multi-model routing cuts GPU costs in real deployments, even after accounting for the audit-surface tradeoff.
The teams that win at AI cost management treat inference like a queueing problem, not a procurement problem. The difference is pattern recognition. Encode knowledge about burst shapes into the architecture from day one. Discover them in the invoice later and you are already bleeding.
Architecture without measurement is still a guess. The metrics you track determine whether you are managing bursts or just hoping they go away.
The FinOps Metrics That Actually Catch Bursts
The right metrics survive bursty traffic. The wrong ones get buried by it. Here is what to track. - Cost per successful request at P99. The tail latency request is where your burst cost lives. P50 averages hide it. P99 exposes it. This single metric is the difference between forecasting that holds and forecasting that breaks at scale. - Burst budget vs. steady-state budget as separate line items. If you cannot tell finance which dollars paid for the baseline and which paid for the spike, you cannot optimize either. This is also the lever that fixes the CFO's GPU autoscaling blind spot. - Queue depth and retry rate as leading indicators. These spike before the cost spike. They give you a window to throttle, route, or scale. Your model training pipeline does not need this. Your inference layer does. - Cost per completed business outcome. Measure proposals generated, tickets resolved, documents summarized. This is the unit economics that survives bursty traffic. The outcome count is stable even when the request count is not.
The CTOs who keep AI cost under control instrumented burst-specific metrics early. They did it before the dashboard told them they had a problem. The common thread is measurement discipline, not cheaper models. The model is rarely the answer. The machine learning architecture and the metrics around it are.
With the right architecture and the right metrics, the picture changes. Most teams still track the wrong ones.
What Changes When You Stop Trusting the Average
When the average stops being your reference point, four things change for the better. - Predictable monthly AI bills. Burst cost is allocated, not absorbed. You can forecast within a tight band because the spike and the baseline are tracked separately. The cost forecasting problem stops being a problem. - Better user experience during peaks. A burst-aware architecture degrades gracefully. Smaller models, shorter contexts, smarter routing. Instead of timing out and triggering retry storms, the system bends without breaking. - Faster capacity planning with finance. When you can show cost-per-outcome during a burst versus a quiet period, the budget conversation becomes a unit economics conversation, not a complaint. Finance stops asking "why is the bill bigger?" and starts asking "which outcome drove the spike?" - A defensible AI roadmap. If you can prove that the next ml training cycle or model upgrade reduces cost-per-completed-task during bursts, the build-vs-buy decision gets easier. You are not chasing a lower average rate. You are optimizing the unit that actually matters to the business.
This is a CTO-level problem, not a procurement-level one. Teams that treat inference as a system-design problem ship faster. They spend less, too. The leaders invest in burst-aware architecture once. Then they stop having AI cost conversations entirely. The laggards keep having them every quarter. The bill keeps getting bigger.
Frequently Asked Questions
Why does inference cost more than training in production AI systems?
Training is a one-time capital expense paid by the model provider or during initial build. Inference runs continuously for every user request. Research consistently shows that up to 80% of AI budgets go to inference at scale.
Inference costs compound with usage, context length, and traffic bursts in a way training costs do not. That is the asymmetry, and it grows with scale.
How do you calculate the cost of an inference burst?
You cannot calculate it from hourly averages. You need per-request instrumentation that captures token count, context length, queue wait time, and model version. Multiply per-request cost by the burst's request volume.
Then add cold-start and retry-storm penalties. These can compound on top of steady-state pricing and inflate the total well above what the baseline rate would suggest.
What is the difference between provisioned throughput and pay-as-you-go for inference?
Provisioned throughput commits you to a capacity reservation at a discount. It works well for predictable load but punishes you during actual bursts because you over-provision.
Pay-as-you-go is flexible but gets throttled at scale. It also incurs retry-storm costs when traffic spikes. Both are dashboard-invisible failure modes that a burst-aware architecture addresses.
How do prompt caches affect inference cost during traffic spikes?
Prompt caches reduce per-token cost for repeated prefixes. A burst that changes context windows or fills cache capacity will invalidate the cache instantly.
Every request that follows pays full price until the cache warms again. Your averaged dashboard cannot distinguish this from normal traffic, so the spike passes without a flag.
What FinOps metrics should a CTO track for AI workloads?
Track cost-per-completed-business-outcome at P99 latency. Separate burst budget from steady-state budget. Monitor queue depth and retry rate as leading indicators. Measure cost per request by context length tier.
These metrics survive bursty traffic patterns in a way that hourly cost-per-model aggregates do not.
Instrument one request and replay your last spike. The shape of the burst is rarely what the average suggested.
About the author
Mayank Singh is a software developer at Levitation Infotech, where he builds web and AI-powered applications across the company’s fintech, healthcare, and enterprise projects.