


TL;DR: Seventy percent of enterprises have adopted MLOps, but the median team in our 23-team profile cut production model outages by just 3%. The top quartile's outage reductions reflected the compounding effect of disciplined operating practices, using the same vendor stack. The differentiator is operating discipline, not tooling. The four practices that close the gap are concrete, repeatable, and ship inside 3-6 months.
Key Takeaways: - Adoption metrics measure licenses deployed, not behavior change. That gap is where the 3% median comes from. - Top-quartile teams cut outages at a rate the median never approached by owning deployment cadence, pre-aggregation, monitoring depth, and on-call rotation. - Outage reduction is the lagging metric. Time-to-market, productivity, and governance move first.
70% Adopted MLOps. The Median Team Cut Outages by 3%.
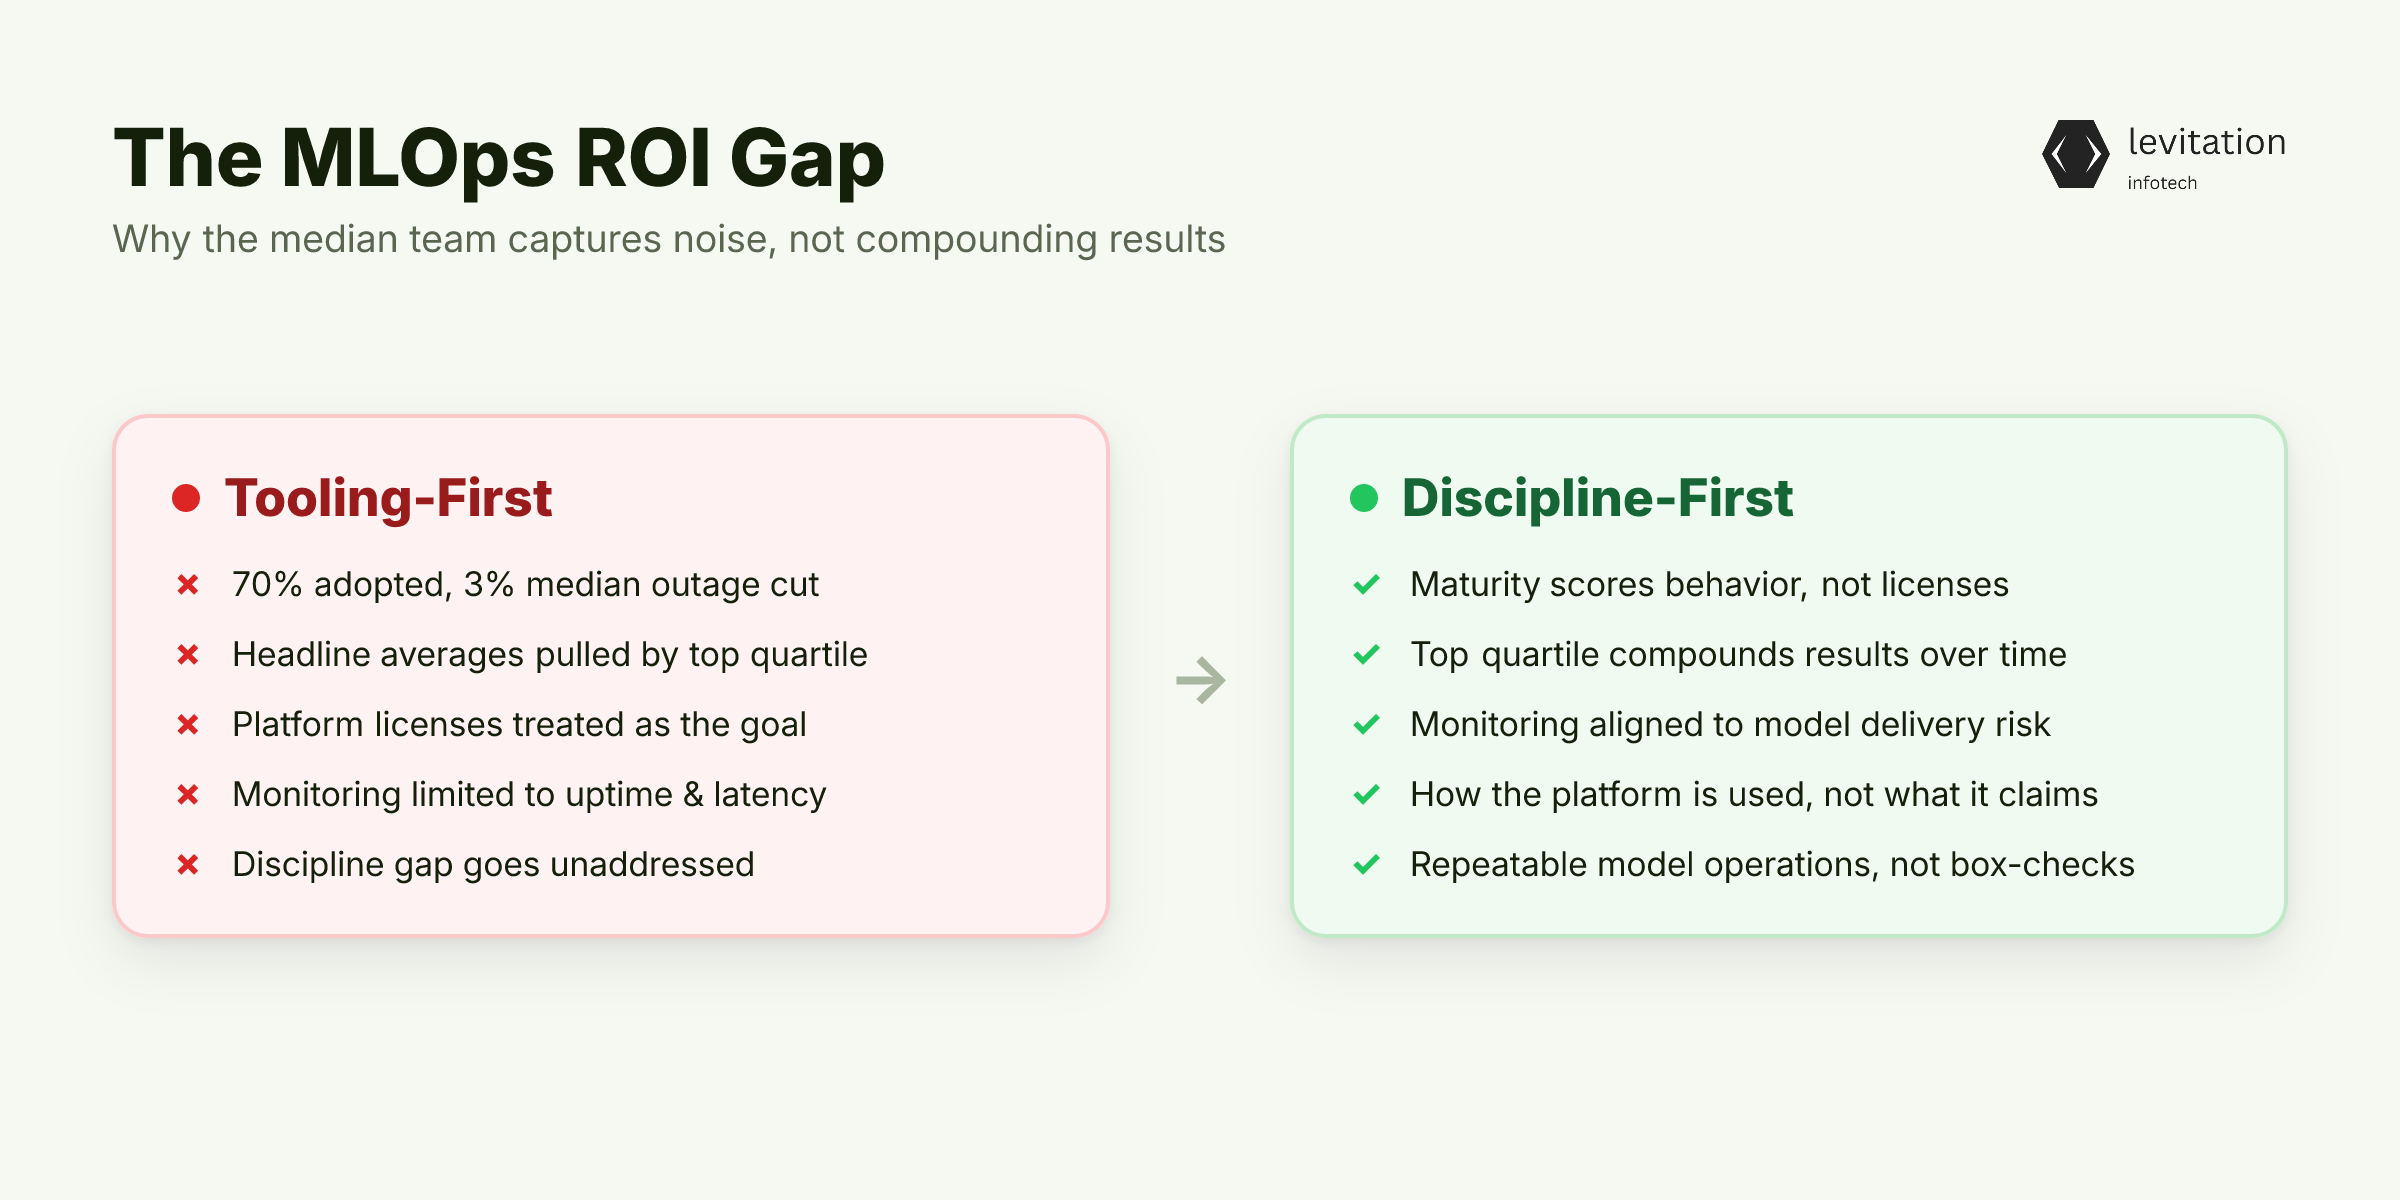
Seventy percent of teams have adopted MLOps. The median outage reduction across 23 teams we profiled was 3%. The same tools, the same vendors, wildly different outcomes. Something in the middle is being skipped.
Average ROI figures from industry research mask the median story. Averages get pulled up by the top quartile. The typical team is not capturing the return that headline numbers suggest. They are capturing something closer to noise.
So the headline "70% have adopted MLOps" answers a different question than executives actually ask. Leaders do not buy MLOps to check a tooling box. They buy it to cut outages, shorten time-to-market, and turn model delivery into a repeatable operation. The adoption number does not tell you whether any of that happened.
That gap is not a tooling problem. It is a discipline problem, and it shows up the moment you compare the median to the top quartile. The teams that move from near-zero impact to compounding results did not buy a better platform. They changed how the platform gets used.
A structured MLOps maturity assessment that scores behavior, not licenses will show you where you stand. If your monitoring covers only uptime and latency, the discipline gap will show up. It does not matter what your platform vendor claims.
Why MLOps Adoption Doesn't Equal MLOps Effectiveness
The disconnect is simple. Adoption measures whether CI/CD pipelines, model registries, and monitoring tools are deployed. Effectiveness measures whether data, ML, and ops teams actually change behavior around them.
Consider the difference. A team with MLOps adoption ships a quarterly model release behind a manual approval gate. When drift looks bad, that team pages a separate ops group.
A team practicing MLOps ships behind feature flags with automated rollback. The model author owns the pager for 30 days post-deploy.
Both teams have "MLOps" on a slide. Only one of them has shorter outages.
The market is not the bottleneck. The market for MLOps platforms has expanded as vendors compete and platforms mature. Investment is flowing. What is missing is the operating model that turns those tools into outcomes.
Most teams bolt MLOps onto existing workflows instead of redesigning them. The data team still hands off a notebook while the ML team ships on a quarterly cadence. The ops team still owns the pager.
The platform sits on top, looking healthy on dashboards while outages continue at the same rate. This pattern shows up across enterprise deployments in regulated industries. Tooling without workflow change produces tooling-shaped results.
The fix is not a bigger platform. The fix is an enterprise MLOps implementation that rewires who owns what, when releases ship, and how feedback loops close. Behavior change, not license count, drives the step-change from near-zero impact to compounding results.
What Separated the Top Quartile in Our 23-Team Profile
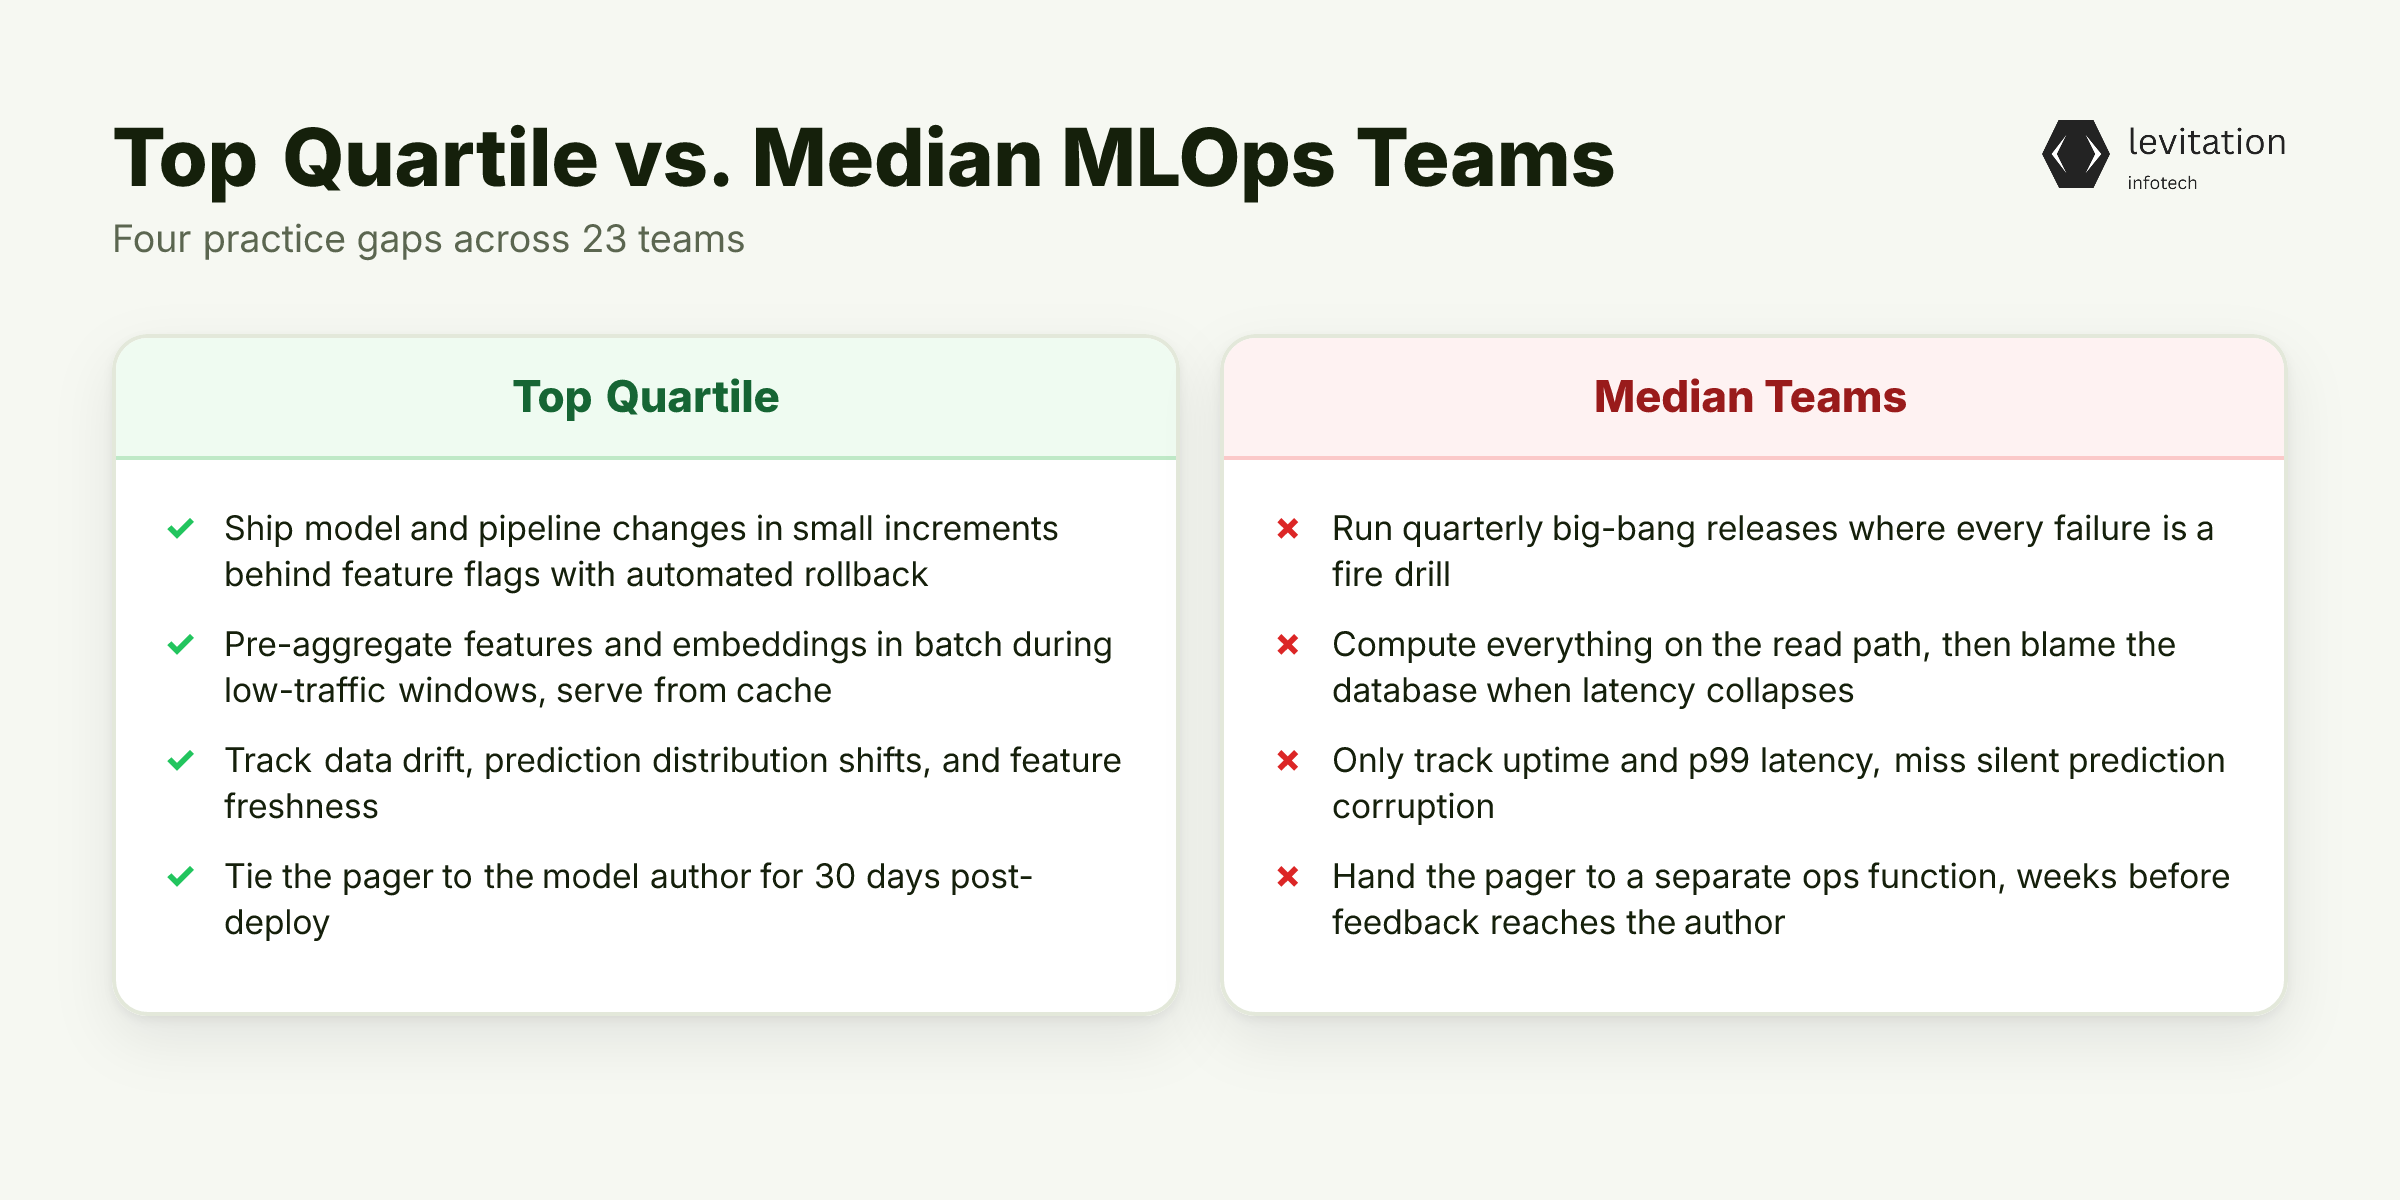
The top quartile in our profile achieved compounding outage reductions using the same vendor stack as the median teams. They did not buy fancier monitoring. They changed four things about how the platform gets used every day.
The first separator was deployment cadence. Top teams shipped model and pipeline changes behind feature flags, in small increments, with automated rollback. Median teams still ran quarterly big-bang releases where every change hit production at once and every failure was a fire drill.
The second separator was pre-aggregation. Top teams schedule batch feature computation and embedding refreshes during low-traffic windows, then serve from cache when traffic spikes. This pre-processing pattern, working verticals before serving horizontals, was common across the top quartile. Median teams tried to compute everything on the read path, then blamed the database when latency collapsed.
The third separator was monitoring depth. Top teams tracked data drift, prediction distribution shifts, and feature freshness. Median teams tracked uptime and p99 latency. Uptime dashboards stayed green across both groups, but only one group caught silent prediction corruption before it cost revenue.
The fourth separator was on-call ownership. Top teams tied the pager to the model author for 30 days post-deploy. The person who shipped the model also got woken up at 3 AM. Median teams handed the pager to a separate ops function and waited weeks for feedback to loop back to the author.
The result is durable. Systems running in production years after deployment only survive because these four practices were institutionalized, not improvised. If your team's MLOps deployment patterns depend on one or two heroic engineers, you do not have a top-quartile operation. You have a bus factor problem.
The Four Practices That Moved Teams From 3% to a Step-Change in Outage Reduction
Knowing what works is one thing. Building it inside a live org is another. Here is the four-step sequence that moved teams from 3% to compounding results.
Practice 1: Deployment cadence. Ship model and pipeline changes behind feature flags. Automate rollback on guardrail violation. Kill the quarterly release train. Small, frequent, reversible releases turn production incidents into routine rollbacks instead of executive war rooms. Teams that adopted this practice saw a measurable drop in mean time to recovery within the first quarter.
Practice 2: Pre-aggregation during off-peak. Schedule batch feature computation and embedding refreshes during low-traffic windows, then serve from cache. Pre-process verticals before you are asked for a horizontal feature. It also dovetails with MLOps implementation roadmap guidance. The roadmap separates training, serving, and refresh paths so they do not compete for the same compute budget.
Practice 3: Monitoring depth. Track data drift, prediction distribution, and feature freshness, not just uptime and latency. A green uptime dashboard while predictions silently drift toward garbage is worse than an outage. Nobody wakes up to fix it. Your MLOps monitoring stack should answer the question "is this model still correct" alongside "is this service still up."
Practice 4: On-call rotation that includes the model author. The person who shipped the model owns the pager for 30 days post-deploy. Feedback loops that took six weeks under a separate ops team now close in hours. Behavior changes fast when the author feels the cost of the change.
The gap between this and the median shows up in the timeline. A focused rollout lands in 3-6 months. In-house teams without prior production MLOps experience usually take 18-24 months. They rebuild the platform, the feedback loops, and the operating model in parallel. The cost difference is not in the license, it is in the months.
The Real MLOps ROI Isn't the Outage Number
Outage reduction is downstream. Time-to-market, developer productivity, and governance move first. The top quartile's outage cuts are the proof, but the ROI shows up in three other places before the outage number moves.
Average ROI figures from industry research track with teams that practiced the four steps above. The 3% median maps to teams that adopted the platform without them. Average and median tell different stories for a reason.
In practice, the savings show up in inference-stage defect interception, where ML error-detection systems catch problems before they cascade into downstream processes. The savings come from catching defects at inference, not from reducing outages. The outage reduction follows.
Productivity data points the same way. MLOps-driven automation produces productivity gains and retention improvements in repetitive-task roles by reducing manual handoffs and surfacing model feedback faster. The savings do not show up in uptime dashboards. They show up in headcount you did not have to hire and in retention you did not have to fight for.
The executive takeaway: outage reduction is the proof, but ROI is the payoff. Budget for the full sequence, not just the tool license. If you want to model this for your own org, the MLOps ROI calculator will surface the gap between platform cost and behavior-driven return. Platform spend is the visible line, behavior change is the invisible multiplier.
Frequently Asked Questions
What is the average ROI of MLOps according to recent research?
Industry research on MLOps ROI shows wide variation between average and median outcomes. Top performers report returns well above average, while median teams capture far less. Our 23-team profile found the median outage reduction was only 3%. This suggests most teams capture far less than the average. They stay there until they fix operating discipline.
How much can MLOps realistically reduce model outages?
The median team in our profile cut outages by 3%. The top quartile achieved compounding reductions using the same tool stack. The differentiator was not the platform. It was deployment cadence, monitoring depth, and on-call ownership tied to model authors.
How long does an enterprise MLOps implementation actually take?
A focused MLOps rollout with a partner typically lands in 3-6 months. In-house teams without prior production MLOps experience usually take 18-24 months. They rebuild the platform, the feedback loops, and the operating model in parallel. The gap is almost entirely organizational, not technical.
What is the current MLOps adoption rate?
MLOps adoption has reached roughly 70% across enterprises with active ML programs. That figure measures tool deployment, not operational maturity. That is why median effectiveness numbers trail adoption so sharply. A 70% adoption rate with a 3% median outcome means most teams are running platforms they are not actually using.
Why do most MLOps implementations fail to deliver expected results?
They are scoped as a tooling rollout rather than an operating-model change. Teams buy the platform, wire up CI/CD, and stop. Without deployment cadence discipline, drift monitoring, pre-aggregation, and author-owned on-call, the tools layer over the old workflow. The old results persist: high adoption, low impact. The pattern is similar to what we have seen in broader AI deployment data. The platform ships, the behavior never changes, and the dashboard lies.
Start with a structured maturity assessment that scores behavior, not licenses. The rest of the picture follows.
About the author
Mayank Singh is a software developer at Levitation Infotech, where he builds web and AI-powered applications across the company’s fintech, healthcare, and enterprise projects.