


TL;DR: Nearly 90% of executives report zero productivity impact from AI. This is despite $250 billion in corporate spending. The gap between adoption and value is a structural engineering problem. The fix is not more pilots, more training, or more adoption metrics. It is a set of specific production deployment practices. These compress in-house build timelines by reusing hardened infrastructure. They also force measurement of workflow displacement, not login counts.
Key Takeaways: - The 90% paradox is an engineering problem, not a measurement or training problem. - Pilots and production systems are separated by a threshold, not a continuum. Crossing it requires engineering work that almost no pilot budget accounts for. - Tier 2 metrics (workflow displacement) predict AI ROI. Tier 1 metrics (adoption proxies) predict pilot volume.
NBER Data: $250B in AI Spend, 90% Report Zero Productivity Impact
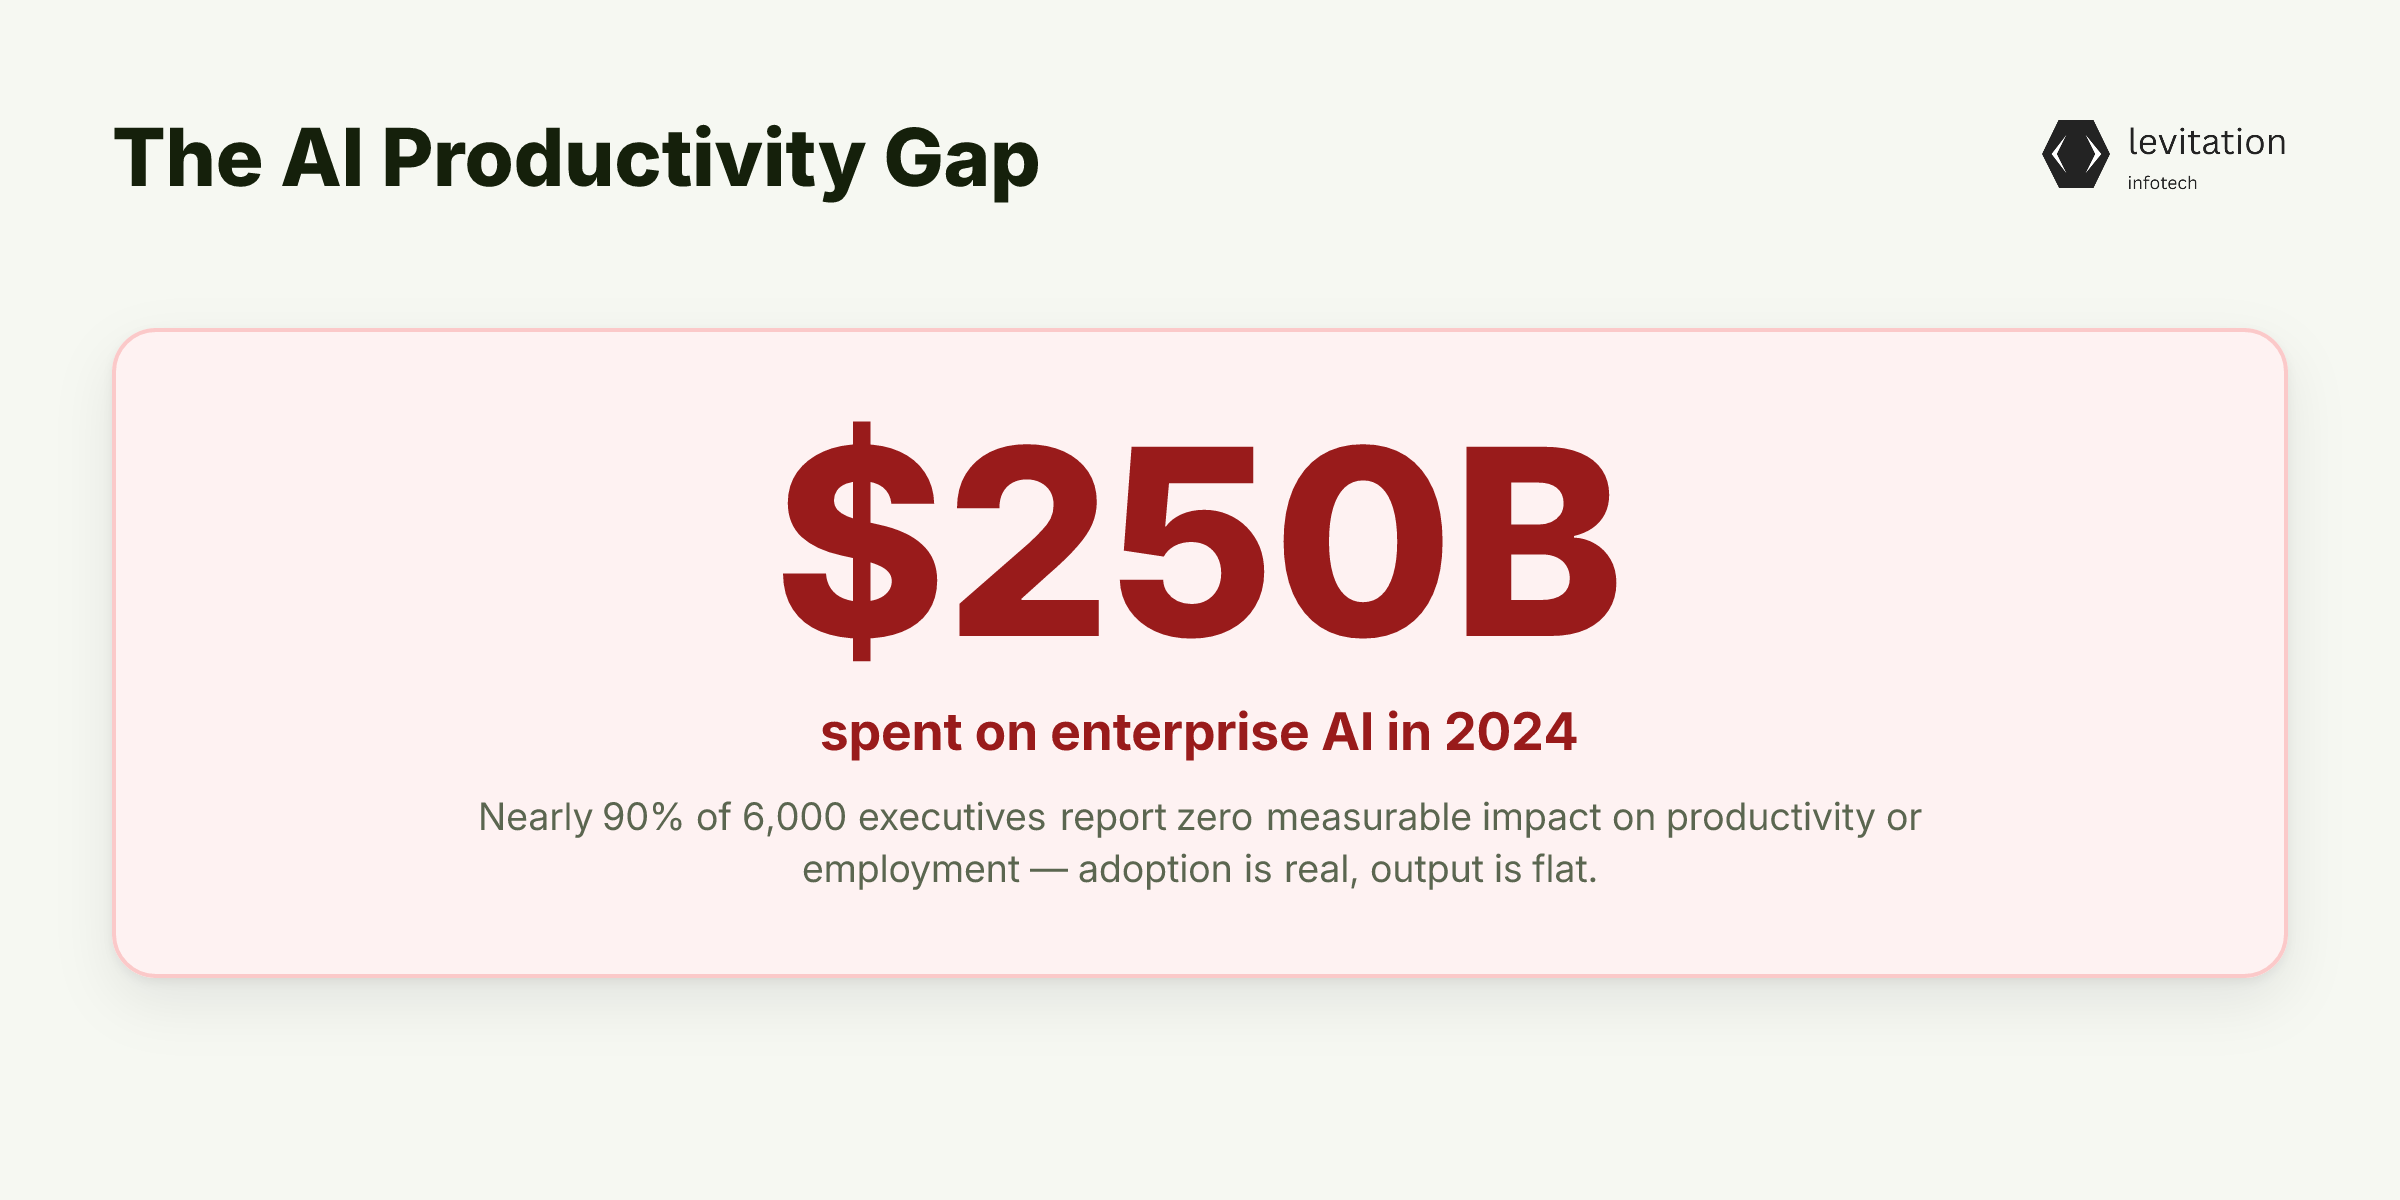
Corporate AI spending hit $250 billion in 2024. Nearly 90% of 6,000 executives surveyed say it produced no measurable impact. This impact covers both productivity and employment.
The gap between adoption and value is not a measurement problem. It is a structural engineering problem hiding in plain sight. It blocks every enterprise AI program. Such programs look healthy on paper but produce nothing on the P&L.
A study published by the National Bureau of Economic Research surveyed 6,000 executives. The survey covered the U.S., U.K., Germany, and Australia. About two-thirds reported using AI.
Average usage came to 1.5 hours per week. A full 25% reported not using AI at all in their workplace. Nearly 90% of firms said AI has had no impact. This covers employment and productivity over the last three years.
These are not companies that rejected AI. They are companies that bought it, logged in, and saw nothing change.
Adoption metrics climbed. Operational impact stayed flat.
Economists including Mohamed El-Erian connect this to the productivity paradox. This paradox came from earlier technology cycles. The pattern repeats. Capital pours in. Adoption metrics rise. Output stays flat.
If spending is real and adoption is real, something between them must be broken. More training and more pilots will not fix it. Running more experiments will make the gap worse, not better.
The Pilot Volume Trap: Why Running More Experiments Makes It Worse
Boards see dozens of pilots, infer progress, and approve more spend. This creates a feedback loop that rewards experimentation over production. Every demo on a quarterly review slides the needle on "AI activity." However, it changes nothing in any production workflow.
The 1.5-hour-per-week usage figure exposes the real signal. Most AI interactions never reach the core workflows where productivity compounds. People are using AI in side windows. They are not using it in the systems that move money, approve loans, process claims, or fulfill orders.
Here is the trap. Pilot environments operate on curated data with hand-tuned prompts. Production environments break on data drift, latency budgets, and unstructured inputs. A model that performs strongly on a test set can perform poorly on real traffic. This can happen within months of deployment.
Accumulating more pilots increases technical debt faster than it generates evidence. Each one builds a custom integration that must later be rebuilt for scale. A team that runs multiple pilots in a year accumulates fragile point solutions. They end up with no unified enterprise AI system. They build no reusable foundation for AI implementation at scale.
The difference between a pilot and a production system is not a continuum. It is a threshold. Crossing it requires work that almost no pilot budget accounts for.
What 'In Production' Actually Means for Enterprise AI
Production AI means a system runs continuously against live traffic. It has defined SLOs, observability, rollback capability, and on-call ownership. That single sentence hides at least six engineering disciplines. Each of these is skipped by most pilots entirely: - Inference infrastructure that handles tail latency, not just benchmarks on curated test sets. - Data pipelines that account for schema drift, PII handling, and lineage. None of these appear in a demo. - Governance, audit trails, and model versioning that become mandatory. This happens once a foundation model output reaches a customer or regulated workflow. - Observability that can distinguish a model regression from a traffic anomaly in real time. - Rollback paths that do not require a redeploy and a change advisory board meeting. - On-call rotations staffed by people who understand the system, not just the demo.
Teams that confuse a working demo with a production AI platform end up in the 90%. They are the ones reporting no impact. They are not failing at AI. They are failing at production engineering.
The companies that have AI systems still running in production for years after deployment share one trait. They treated the production layer as the product from day one, not as a future concern.
Knowing the threshold is one thing. Most CTOs who see this pattern know it already. What is missing is the specific list of engineering failure modes that block the crossing.
Four Engineering Failure Modes That Kill AI ROI
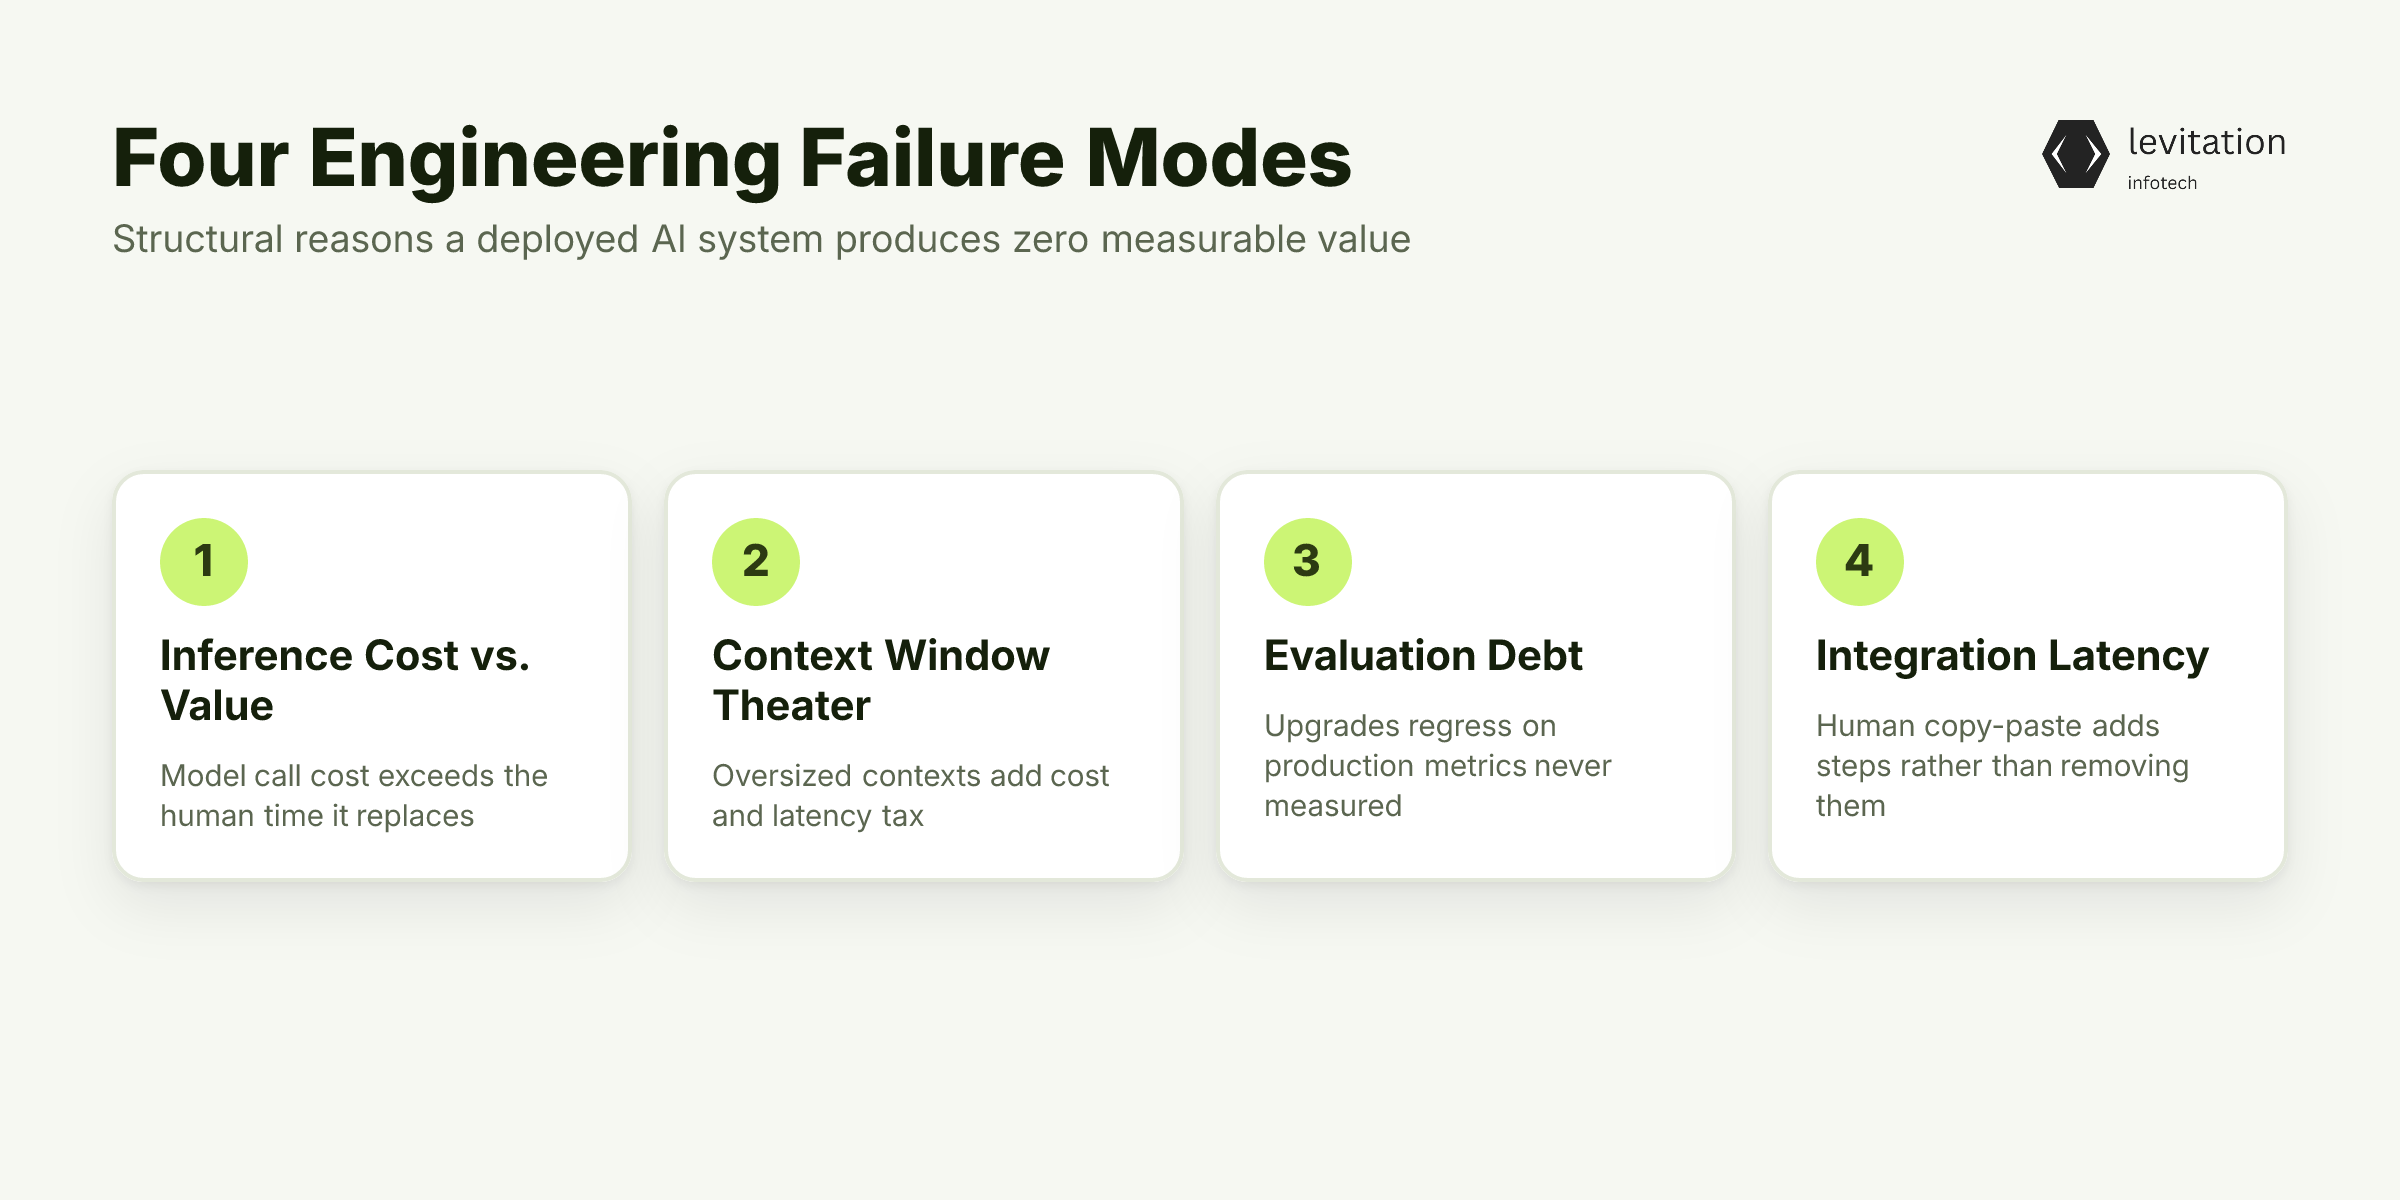
Each failure mode below is a structural reason. A deployed generative AI system produces zero measurable value. This happens even when usage looks healthy.
Failure Mode 1: Inference Cost vs. Business Value. When the cost of a model call exceeds the value of the human time it replaces, the use case breaks even. This only happens at massive scale. Many use cases never reach that volume. The math turns negative long before the dashboard turns green.
Failure Mode 2: Context Window Theater. Teams feed oversized contexts to a model. Structured retrieval would answer the same query with lower cost and lower latency. Bigger contexts feel like progress. They are usually a cost and latency tax dressed as intelligence.
Failure Mode 3: Evaluation Debt. Without a held-out evaluation set tied to business outcomes, teams ship model upgrades. These upgrades regress on production metrics that were never measured. The new model wins the benchmark and loses the customer. We have written about this trap before in our coverage of LLM evals that approve failing models. The same dynamic shows up in inference cost optimization. The cheapest-looking model turns out to be the most expensive in production.
Failure Mode 4: Integration Latency. An AI solution that requires human copy-paste between systems adds steps rather than removing them. The productivity math goes negative. A model that returns a perfect answer, followed by lengthy human data entry, is a slower workflow than the one it replaced.
The Latency Cliff: Where Good Models Become Bad Products
There is a specific failure shape worth naming. A model works well in testing. It is deployed. Latency grows as traffic scales. It eventually crosses the threshold where users stop waiting.
They revert to the old workflow. The system is technically running, but no one is using it.
This is the latency cliff, and it is where most "successful" pilots die.
Once you can name the failure modes, the measurement question becomes concrete. The right metrics predict production value. The wrong ones predict pilot count.
The Metric Hierarchy That Predicts AI ROI
Most AI dashboards are built on the wrong tier. Here is the hierarchy that actually predicts ROI. - Tier 1: Adoption proxies. Logins, prompt count, active users. These correlate weakly with business value. They are the metrics driving the 90% paradox. They measure activity, not impact. - Tier 2: Workflow displacement. Hours of human work eliminated per week. Cycle time reduction on a specific process. Error rate change on a specific decision. These are the metrics a COO would defend. - Tier 3: Outcome metrics. Revenue per transaction, cost-to-serve, customer retention, compliance defect rate. These are the metrics a CFO would defend.
CTOs who instrument Tier 2 before scaling pilots avoid a trap. They avoid celebrating adoption that never moved Tier 3. They establish a baseline for at least one quarter before any model ships. This makes the delta attributable, not anecdotal.
Replacing adoption dashboards with workflow-displacement dashboards typically reveals a fact. Most pilots contributed zero. The remaining minority become the only candidates worth scaling. This is the moment when an AI system stops being a science project and starts being infrastructure.
Knowing what to measure is necessary but not enough. The harder question is how to reach production faster than an in-house build cycle allows.
The Production Fast Path: Reuse Over Reinvention
In-house teams that build inference, observability, and governance from scratch face a lengthy path to production. Teams that reuse a hardened AI platform can reach production sooner. They skip the reinvention of the surrounding engineering layer.
Here is the fast path.
- Pick the use case by value density, not novelty. The triangle that produces measurable ROI is high transaction volume, high error cost, and accessible data. Novelty does not enter the formula.
- Reuse a hardened AI platform instead of building inference, observability, and governance from scratch. This is where the compressed timeline comes from.
- Instrument the workflow before the model ships. You cannot improve a metric you have not been measuring for at least one baseline quarter.
- Run a 30-day shadow deployment where the model scores in parallel with the human decision-maker. This validates Tier 2 metrics before any human is removed from the loop.
- Promote to production only when the shadow data crosses a pre-set threshold. This single rule eliminates most of the failure modes listed above.
When this path is followed correctly, the result is not a flashy pilot. It is an enterprise AI system that quietly runs in production for years. That is the only durable proof of value.
What Changes When AI Actually Runs in Production for Multi-Year Horizons
A production AI system that survives years of model upgrades, regulatory changes, and data drift is rare. It is the only artifact that compounds ROI across budget cycles. Most AI investments depreciate on a standard timeline. The system that was deployed is no longer the system running.
Long-running production AI systems expose the real cost model. They reveal inference at scale, retraining cadence, and the human review surface area. A pilot-phase system never reveals these costs. These are the costs that decide whether AI is a capital line item or an operating expense.
The differentiator is not the model choice. It is the production engineering surrounding it. The 10% of executives who report impact share one trait. They measure Tier 3 outcomes against a baseline set before any AI was deployed. Everything else is theater.
Frequently Asked Questions
Q: Why do 90% of CEOs report no productivity impact from AI?
A: The NBER study of 6,000 executives found that about two-thirds report using AI. Average usage is only 1.5 hours per week. A full 25% of respondents do not use AI at all in their workplace. The gap exists because most AI activity happens in isolated pilots. It does not happen inside production workflows where productivity actually compounds.
Q: What is the difference between AI adoption and AI production deployment?
A: AI adoption measures whether people are logging in and using tools. AI production deployment means a system runs continuously against live traffic. It has defined SLOs, observability, rollback capability, and on-call ownership. The two are commonly conflated. This is why adoption metrics are a poor predictor of business value.
Q: How long does enterprise AI production deployment actually take?
A: In-house teams that build inference, observability, and governance from scratch face a lengthy path to production. Teams using a hardened AI platform can reach production sooner. The platform offers reusable inference, observability, and governance components. They skip the reinvention of the surrounding engineering layer.
Q: What metrics should replace adoption dashboards for measuring AI ROI?
A: Replace Tier 1 adoption proxies like logins and prompt count. Replace them with Tier 2 workflow displacement metrics. These include hours of human work eliminated, cycle time reduction, and error rate change. Also use Tier 3 outcome metrics. These include revenue per transaction, cost-to-serve, and compliance defect rate. Tier 2 should be instrumented for at least one baseline quarter before any model is deployed.
Q: What is the enterprise AI value gap?
A: The enterprise AI value gap is the structural disconnect between corporate AI investment and measurable business outcomes. It persists because organizations invest in pilots and adoption metrics. The underlying production engineering stays underfunded. This includes data pipelines, inference cost control, evaluation, and integration latency. Value never materializes at scale.
The first conversation should be about production engineering, not model selection.
About the author
Mayank Singh is a software developer at Levitation Infotech, where he builds web and AI-powered applications across the company’s fintech, healthcare, and enterprise projects.