


TL;DR: Tokenmaxxing, the practice of treating AI token consumption as a productivity proxy, inflates engineering dashboards. It also quietly drives real-world code acceptance as low as 10% of generated code. The fix is not more AI. It is measuring output, including true code acceptance, time-to-commit, defect escape, and release frequency, instead of input. CTOs who run a 90-day audit using these four metrics recover predictable velocity within a quarter.
Key Takeaways: - Token budgets are an input metric. They measure AI usage, not shipped software. This is why they correlate inversely with real engineering velocity. - Initial code acceptance rates of 80-90% collapse to 10-30% after 30 days of revision churn. This exposes the gap between "approved at PR" and "still in production." - Industry research confirms that coding activity rises much faster than shipped releases. The bottleneck shifts from typing to integration, review, and rework. - Anything above realistic output-measured gains on your dashboard is fiction.
The Tokenmaxxing Delusion: When Bigger Budgets Mean Worse Outcomes
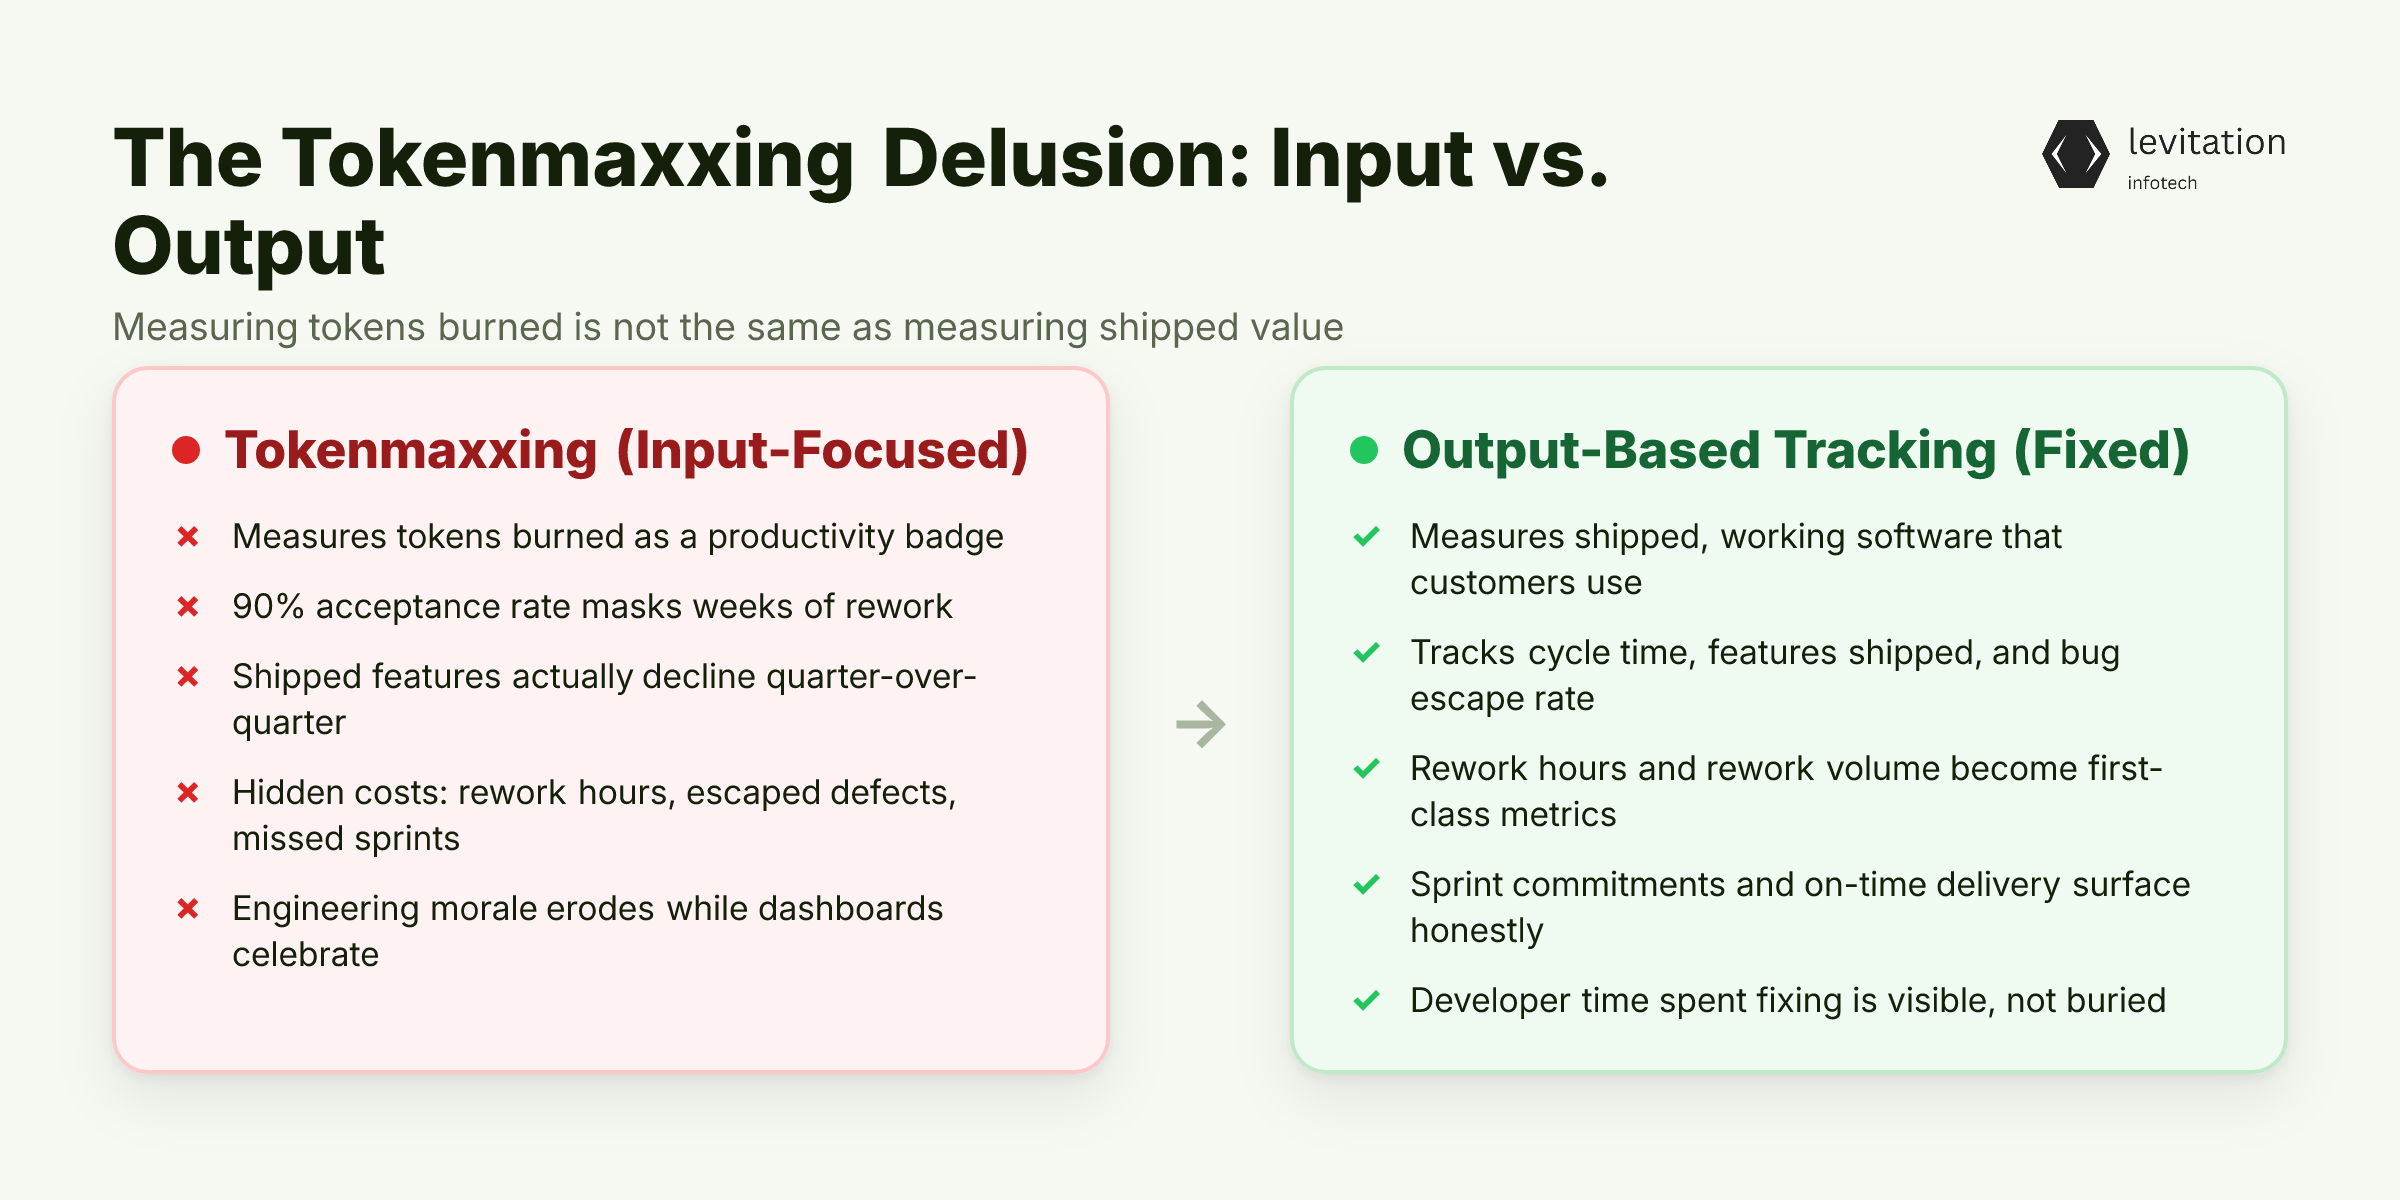
Your engineering dashboard shows 90% AI code acceptance. Your CTO is giving conference talks about "AI-native velocity." And your last three sprints shipped fewer features than the quarter before you rolled out those coding agents. Something is broken in the way you are measuring this.
The practice has a name now: tokenmaxxing. It means treating large AI token consumption as a status symbol, a productivity proxy, and a competitive moat. In some engineering organizations, especially in Silicon Valley, the size of a developer's token budget has become a badge of honor. Bigger budget means bigger respect. More tokens burned means more productive the team.
The problem is that token consumption is an input. It measures the AI processing power a developer has been allowed to burn. What you actually care about is the output. That is shipped, working software that customers can use.
Measuring the input while claiming to optimize the output is a category error. Category errors, left unfixed, compound into shipping slowdowns that nobody on the leadership team can explain.
There is an old management saw: what you measure matters, and you get more of whatever you measure. If you measure tokens burned, you get more tokens burned. You do not get more shipped features, fewer bugs, or faster cycle time. You get a dashboard that celebrates the wrong thing.
The deeper damage shows up in numbers your dashboard is not capturing. Those numbers include rework hours, escaped defects, and missed sprint commitments. Engineering morale bleeds slowly. Developers spend their days fixing AI code they "accepted" three weeks ago. The first place to see this damage clearly is the acceptance rate metric, where most of the deception starts.
Read our [AI developer productivity measurement framework for the full architecture behind output-based tracking.]
Why 80% Code Acceptance Rates Are Lying to Your CTO Dashboard
A recent TechCrunch report surfaced a number that should change how every engineering leader reads their AI dashboard. Engineering managers were seeing initial code acceptance rates of 80% to 90%. That is the share of AI-generated code that developers approve at PR time.
The same data, measured weeks later, showed real-world acceptance falling to between 10% and 30%. The gap is the story.
Developers approve AI code quickly because the code "looks right." Then the next two to four weeks reveal new problems. Those problems include integration bugs, edge-case failures, security smells, and architectural mismatches. The initial review missed all of them. Every fix is rework. Every rework hour is an hour not spent on the next feature.
The management principle is older than AI: what you measure is what you get. Optimizing on initial acceptance trains your team to ship code that passes the first look. It does not train them to ship code that survives the next quarter. If your dashboard tracks the moment of approval, you will get more approvals. You will not get more durable software.
This is why initial acceptance is the wrong leading indicator for engineering velocity. It is a vanity metric dressed as a quality metric. A senior engineer accepting a PR in three minutes tells you nothing. It tells you nothing about whether that code will still be in production six months from now. Velocity is measured at the point of stable delivery, not the point of initial review.
This is the same trap documented in our analysis of why AI coding assistants are quietly breaking your engineering metrics. The acceptance-rate gap is just one symptom. The deeper problem is that almost every AI productivity metric on the market is measuring the wrong thing entirely.
For a deeper dive into [engineering velocity metrics that actually matter, see the companion guide.]
The Input-vs-Output Measurement Trap in AI Coding ROI
Software organizations have made this mistake before. In the 1980s and 1990s, lines of code (LOC) was the dominant productivity metric. It rewarded verbose code, copy-paste, and developers who generated the most files. It punished concise architecture, reuse, and senior engineers. Those senior engineers shipped less code because they shipped better code. LOC failed as a productivity measure. It failed for the same reason token consumption is failing now: it measured an input, not an output.
The research confirms the parallel. Coding activity increases sharply with AI tool adoption, often several times over. Actual releases grow at a small share of that rate. The headline looked very high. The output number was a fraction of the input.
The mechanism is splitting. AI accelerates the production of code, but it does not accelerate the production of working software. The bottleneck shifts from typing to integration, review, testing, and rework. A large gain at the keyboard can become a small gain at the release boundary. Everything in between gets consumed by hidden rework the dashboard never sees.
We have seen this pattern across teams that measure themselves before and after AI rollouts. Output-focused metrics often decline in the first months of uncritical AI adoption. That insight reframes the entire question. AI coding ROI must be measured at the output boundary, where the customer gets value. It must not be measured at the input boundary where tokens are burned.
Our [AI coding ROI calculation walkthrough shows how to build the output-side math.]
The Four Metrics That Actually Move AI Developer Productivity
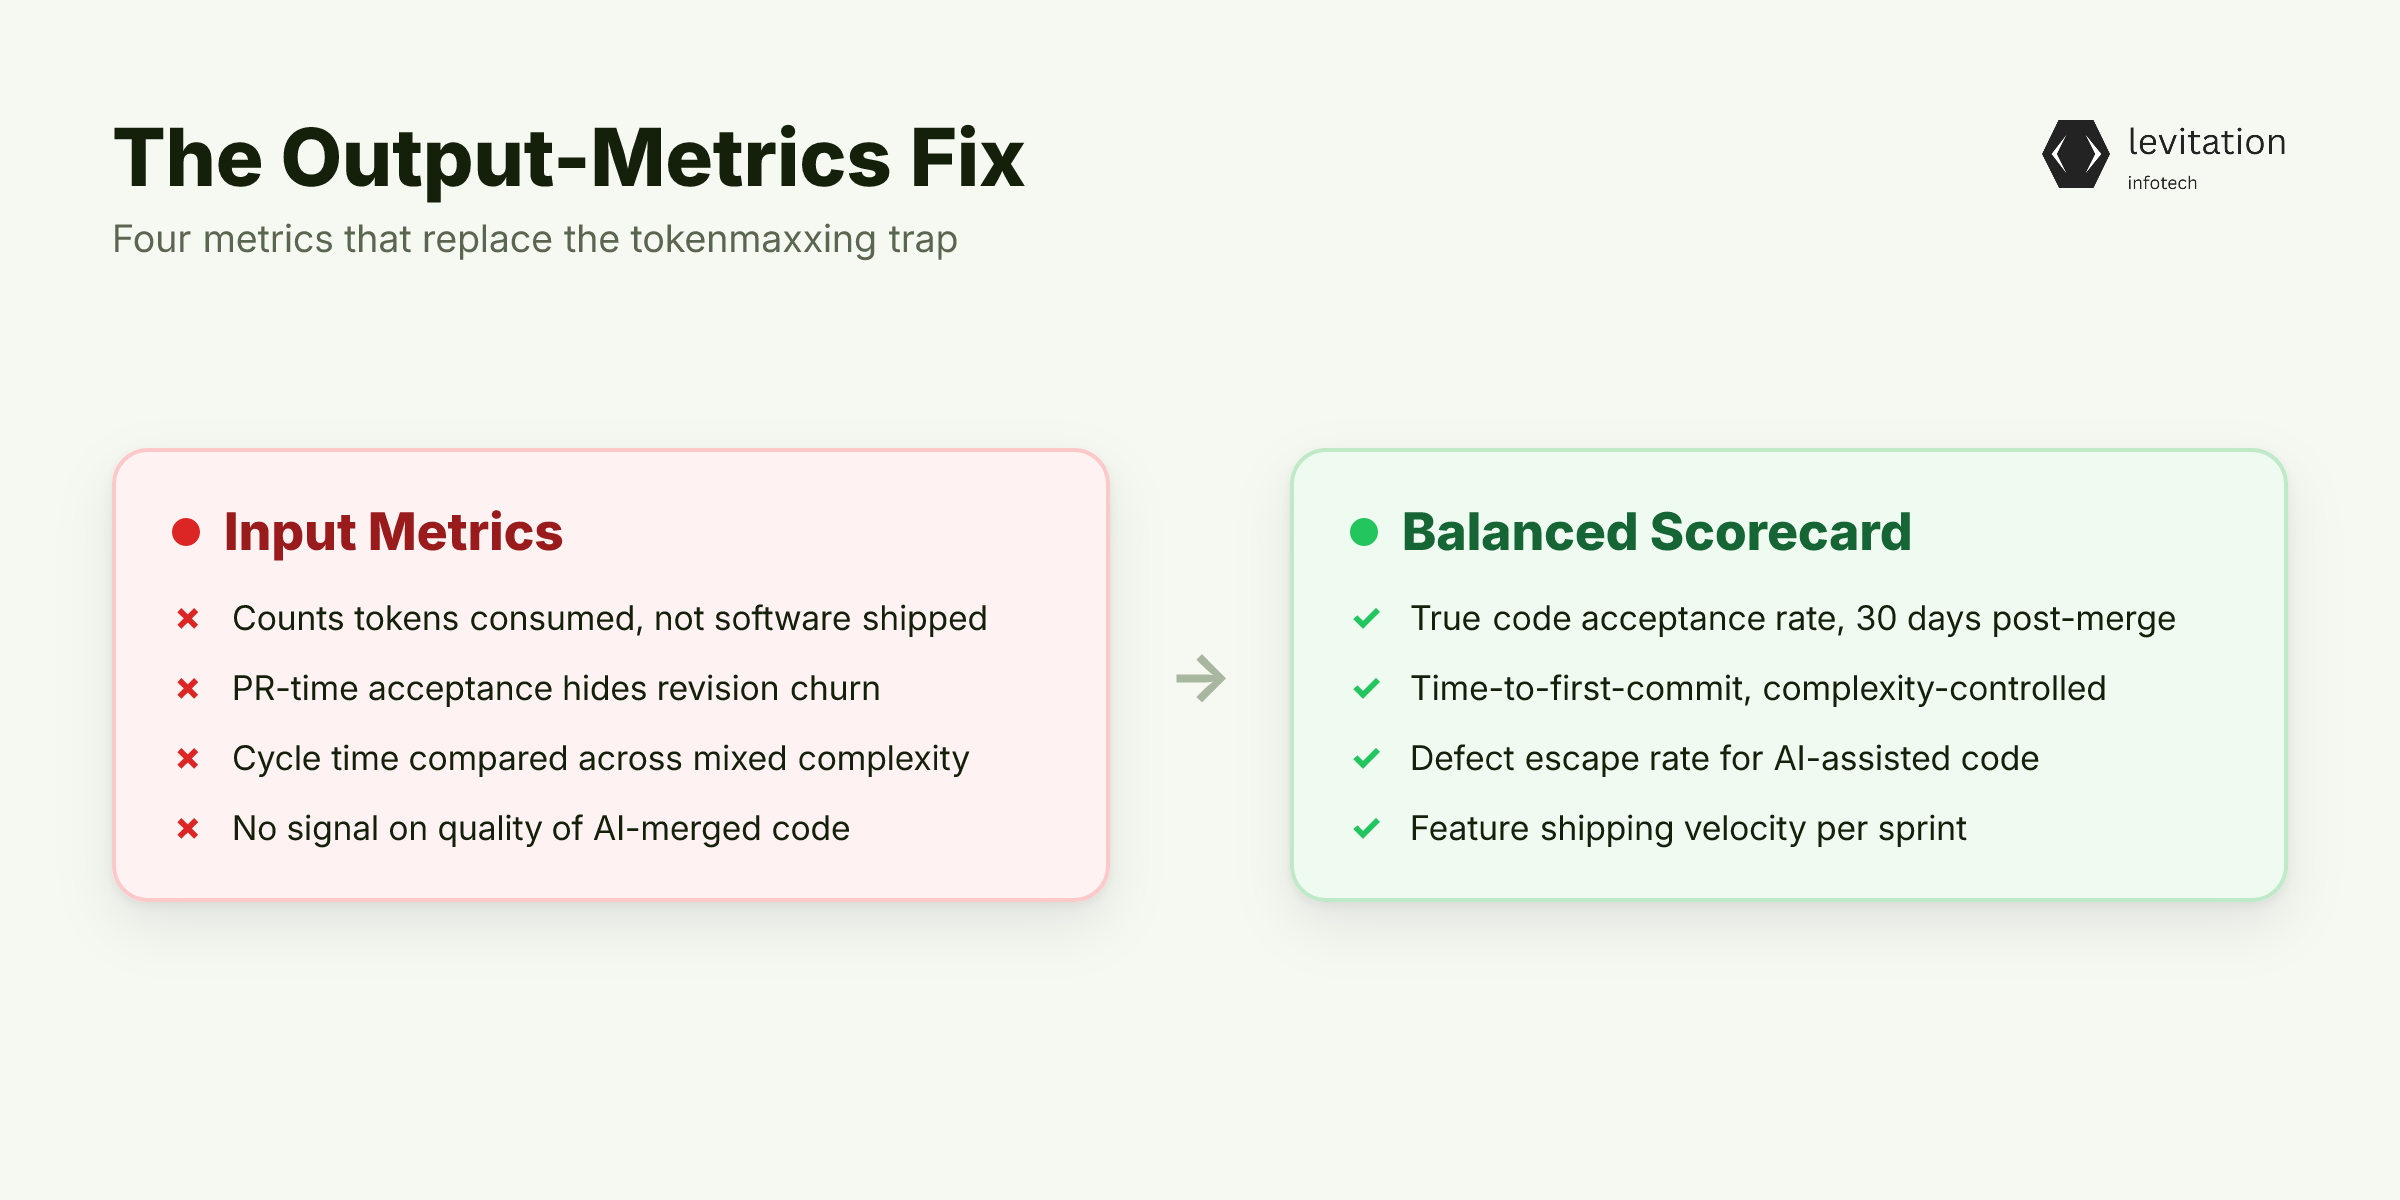
The fix is a balanced scorecard of four output-based metrics. None of them measure tokens. All of them measure whether software shipped and survived. - True code acceptance rate, measured 30 days post-merge. Not at PR time. The 30-day window captures the revision churn that the TechCrunch data exposed. A line of code that survives 30 days in production is, by definition, code that worked. Anything rewritten within that window is rework cost, not productivity. - Time-to-first-commit per feature, controlled for complexity. A simple bug fix and a new payment flow should not be compared. Normalize by complexity bucket. Measure how long it takes from "ticket opened" to "first commit on the feature branch." AI's strongest claim is cycle-time compression. This metric tests it. - Defect escape rate for AI-assisted code. Track which production incidents and bug reports trace back to code merged with heavy AI involvement. The escape rate is the proof that your team is capturing any quality upside. - Feature shipping velocity, measured as releases per sprint per team. This mirrors the standard output measure of feature delivery. It counts what reached customers, not what looked promising at PR time. Use it as the tiebreaker when the other three metrics are noisy.
Together these four metrics form a balanced scorecard. They prevent the input-measurement trap by forcing every signal through an output filter.
A team that looks productive on all four is genuinely productive. A team that looks great on tokens but mediocre on these four is a tokenmaxxing team hiding in plain sight.
Knowing the right metrics is half the battle. The other half is putting them to use without creating a measurement bureaucracy that slows teams further.
How to Audit Your Tokenmaxxing Problem This Quarter
The audit is a four-step exercise you can run inside a single quarter. It does not need new tooling, a vendor procurement cycle, or a reorg. It needs ninety days of data and a few hours of analysis per team. - Step 1: Pull the last 90 days of AI usage data and map token consumption per developer against the four output metrics. Plot the two. Teams where token consumption rises while output metrics stay flat or decline are the tokenmaxxing cohort. The pattern is usually visible within a week of analysis. - Step 2: Calculate your team's true acceptance gap (initial vs. 30-day stable). This is the rework cost your dashboard has been hiding. The wider the gap, the more sprint capacity gets consumed by hidden rework. A wide gap is the signal. It signals that initial-acceptance metrics are masking real productivity loss. - Step 3: Identify the small share of high-token users whose shipping velocity has not improved. They are your tokenmaxxing cohort. They feel productive because their dashboards light up with AI activity. Their actual output tells a different story. The user count matters less than the input-output splitting itself. - Step 4: Reset token budgets based on output-per-token, not absolute consumption. A developer who ships three features and burns 2 million tokens is more efficient. They are more efficient than a developer who ships zero features and burns 5 million tokens. Budget for output, not for input.
A structured audit of this shape, run by a team with production-grade AI engineering experience, typically completes within a quarter. The same pattern repeats across enterprise deployments in regulated industries. In those industries, teams that commit to output-based measurement recover predictable velocity.
Teams that make this shift don't just get cleaner dashboards. They unlock a different kind of engineering performance entirely. The highest-spend developers almost never appear on the output leaderboards when the data lands.
An [AI engineering audit is the fastest way to run these four steps without building the measurement stack from scratch.]
What Changes When You Measure Output Instead of Input
Engineering velocity becomes predictable. The metrics track shipped value, not AI tool usage, so sprint planning gets sharper. Capacity estimates align with actual delivery. The product roadmap stops sliding quarter over quarter.
Code quality stabilizes. The team optimizes for acceptance after 30 days, not initial approval. Reviews get more rigorous at the front door. The team knows the metric will hold them accountable at the back door. Defect escape rates drop because the rework loop is now visible to leadership.
Token budgets become a cost-control lever. They stop being a status symbol. The conversation shifts. It shifts from "who got the biggest budget" to "who produced the most output per token." Spend per feature becomes a trackable line item, not an empty chart.
This is the difference between teams that survive AI disruption and teams that thrive through it. The systems that run this way are the ones still in production years after deployment. They are backed by long-running client partnerships. Enterprise AI systems in production today got there by treating shipping output as the only metric that matters. That is the shift Levitation has spent years helping enterprise engineering teams make. The production systems built that way are still running.
Our [engineering velocity case studies show the pattern across regulated industries.]
Frequently Asked Questions
What is tokenmaxxing in AI development?
Tokenmaxxing is treating AI token consumption as a proxy for developer productivity. Engineering leaders turn large token budgets into a status symbol. But the metric measures an input (AI processing used), not the output (shipped software). This flip is why teams can show high token use while real-world code acceptance drops to between 10% and 30%.
How do you measure AI developer productivity accurately?
Accurate measurement needs output-based metrics. They include: true code acceptance rate 30 days post-merge. Time-to-first-commit per feature. Defect escape rate for AI-assisted code. Feature shipping velocity. Industry research confirms that measuring only coding activity inflates perceived productivity far more than actual releases grow.
Does AI coding actually improve productivity?
Yes, but less than token-based dashboards suggest. Coding activity can spike several times over. Shipping gains stay a fraction of that. The pattern is consistent with the acceptance-rate gap documented in TechCrunch reporting.
How do you calculate ROI on AI coding tools?
ROI is calculated by comparing the cost of tokens, licenses, and integration against output gains. Those gains include: incremental releases shipped. Reduction in defect escape rate. Compressed time-to-first-commit per feature. Token spend alone is an input cost, not an ROI signal. It must be normalized against shipping output to produce a useful ratio.
What are the best engineering velocity metrics for AI-assisted teams?
The four most reliable metrics are: true code acceptance rate after stabilization, not initial PR approval. Time-to-first-commit per feature, controlled for complexity. Defect escape rate for AI-generated code. Release frequency per sprint per team. Together they prevent the input-measurement trap that tokenmaxxing creates.
About the author
Mayank Singh is a software developer at Levitation Infotech, where he builds web and AI-powered applications across the company’s fintech, healthcare, and enterprise projects.