


TL;DR: vLLM pre-allocates the maximum possible KV cache at startup. A 7B model that needs 14GB of weights shows 23GB consumed on every dashboard before the first request. That reserved memory is the price of PagedAttention, which is the mechanism behind vLLM's throughput advantages over naive allocators. The fix is right-sizing `gpu_memory_utilization` and re-architecting the audit conversation around cost-per-token, not memory-per-model.
Key Takeaways: - vLLM's "extra" memory is reserved KV cache block address space, not active data or waste. - PagedAttention's up-front reservation eliminates internal fragmentation. It removes per-request allocator calls from the hot path. That removal unlocks higher concurrent request density per GPU. - A Prometheus plus Grafana dashboard showing reserved-vs-active cache is what turns the audit conversation from defense to sales.
The 23GB Ghost: Why vLLM Always Looks Expensive on Paper
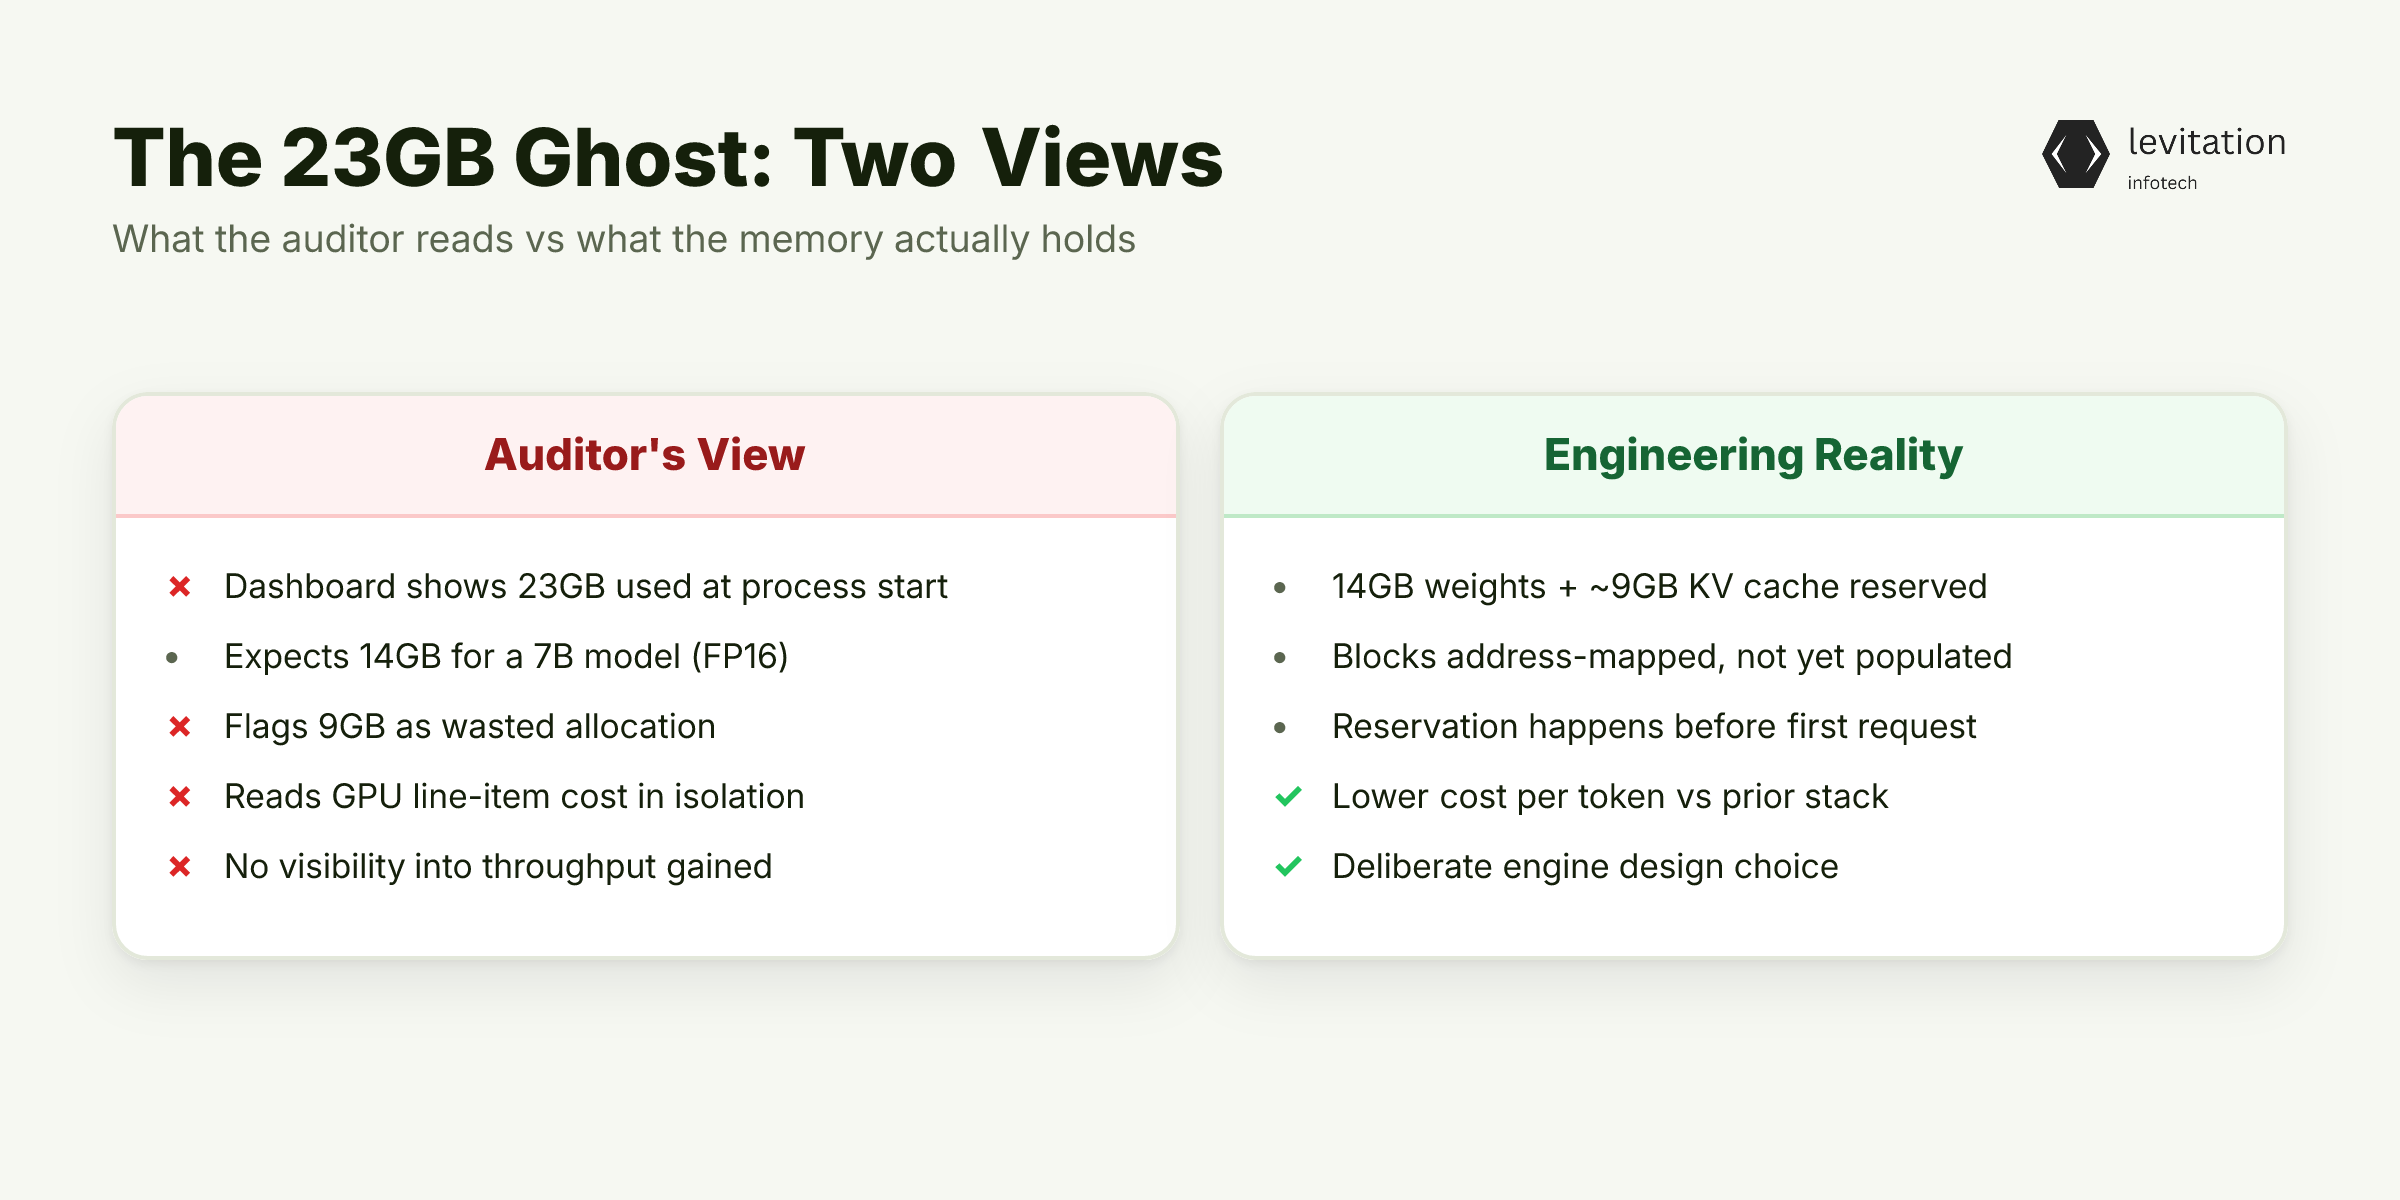
A 7B model should occupy 14GB. Your vLLM deployment shows 23GB.
The auditor is convinced you're wasting 9GB on nothing. She's not wrong about the gap, but she's also not seeing the throughput that memory bought you.
This is the moment every FinOps leader dreads. You migrated to vLLM to cut inference cost. The benchmark deck promised real savings.
The GPUs are objectively cheaper per token than the old FastChat stack. Yet the first thing the audit committee sees is a memory spike on a dashboard nobody can explain.
The "doubling" is real, consistent, and visible on every dashboard before the first request lands. It is not a bug. It is not a leak.
It is also not the auditor's misunderstanding. It is a deliberate engine design choice, and it shows up in production the same way every time: - A 7B model at default config reserves ~9GB of KV cache blocks on top of the 14GB of weights. - The reservation happens at process start, not at first request. - The reserved blocks are address-mapped, not populated. - `nvidia-smi`, Prometheus `node_exporter`, and the cloud provider's GPU console all report the full reserved number as "used."
That is the credibility problem. The system is cheaper per token but looks more expensive on the GPU line item.
The auditor is reading the wrong metric. The engineering team is reading the right one. Neither side can see the other's view.
The extra memory isn't phantom. It is deliberately reserved. Understanding why is the only way to defend the architecture in front of an auditor.
The underlying mechanism is part of the broader AI/ML training story. The inference side starts with what the engine reserves before any request lands.
What KV Cache Pre-Allocation Is Actually Doing at Startup
Every token in every request writes key-value pairs to a growing cache. That cache is what lets attention avoid recomputation.
Without it, every new token would force the model to redo math over the entire prior conversation. With it, the model only touches the new entries.
vLLM reserves the maximum possible KV cache block space the moment the engine boots. Before any traffic arrives. The math runs like this: - The engine knows your `gpu_memory_utilization` target (default 0.9). - It knows your `max-model-len` (default varies by model). - It computes the worst-case cache footprint at that sequence length. - It maps that footprint into fixed-size blocks and reserves them at boot.
This is why the 7B model shows 23GB at t=0 with zero requests. The blocks are mapped, not populated. Each block holds space for future KV pairs that may never arrive.
`nvidia-smi` cannot tell the difference between a block holding real KV data and a block holding zero bytes of address space.
Traditional serving stacks allocate KV cache per-request. They ask the allocator for memory when a new sequence starts. They free it when the sequence ends.
They hope nothing fragments. This avoids the reserved memory number in the dashboard. It also causes: - Latency spikes the first time a long sequence lands. - OOM crashes under burst load when the allocator runs out of contiguous free space. - Internal fragmentation as sequences of different lengths leave holes.
The reservation strategy is the price of admission for a specific engine design. That design is called PagedAttention, and it is where the savings live. The transformer attention and KV cache fundamentals cover the math your auditor's team will need first. Understanding it turns the cost line item from suspect into defensible.
PagedAttention: The Trade-Off Hidden Inside the GPU Bill
PagedAttention borrows virtual-memory paging from operating systems. The KV cache lives in fixed-size blocks mapped through a page table, the same way x86 maps 4KB pages.
Each block holds a fixed number of tokens. The engine keeps a lookup table that says "for sequence X, block Y holds tokens Z to W."
The win is structural. PagedAttention eliminates internal fragmentation, which is where the cost reduction comes from.
Not from using less memory. From wasting less of it.
A naive allocator has to round every sequence up to the nearest power of two. A paged allocator hands out fixed blocks on demand and never has padding inside a block.
The up-front reservation is what makes paging work at all. Blocks must be addressable before requests arrive so the engine can map them in O(1).
If the engine waited to allocate until the first token landed, every request would pay an allocator call on the hot path. PagedAttention removes that call by reserving the maximum possible block pool at boot.
This pattern is the difference between serving tens and serving hundreds of concurrent requests per GPU on the same hardware. The reservation is what unlocks the order-of-magnitude gap.
A related cost trap worth reading is GPU time-slicing saves 60% and mixes your tenants' data. It runs a different mechanism with a similar "cheap on paper, fails in audit" failure mode. Read it before signing off on a multi-tenant GPU plan.
Knowing the mechanism does not satisfy the auditor. She wants a number. Which means the next fight is about configuration, not architecture.
Right-Sizing gpu_memory_utilization Without Hitting the ValueError
The single lever that controls the reservation is `gpu_memory_utilization`. The default is 0.9, meaning vLLM reserves 90% of total GPU memory. The remaining 10% goes to activations and the CUDA workspace.
Set it too low (say 0.8) and the engine raises:
1ValueError: No available memory for the cache blocks.2Try increasing gpu_memory_utilization
That error means the remaining non-reserved memory is smaller than the minimum KV cache the engine needs. That minimum is set by your `max-model-len`.
The engine is not being picky. It fails fast because one request would crash with OOM mid-generation.
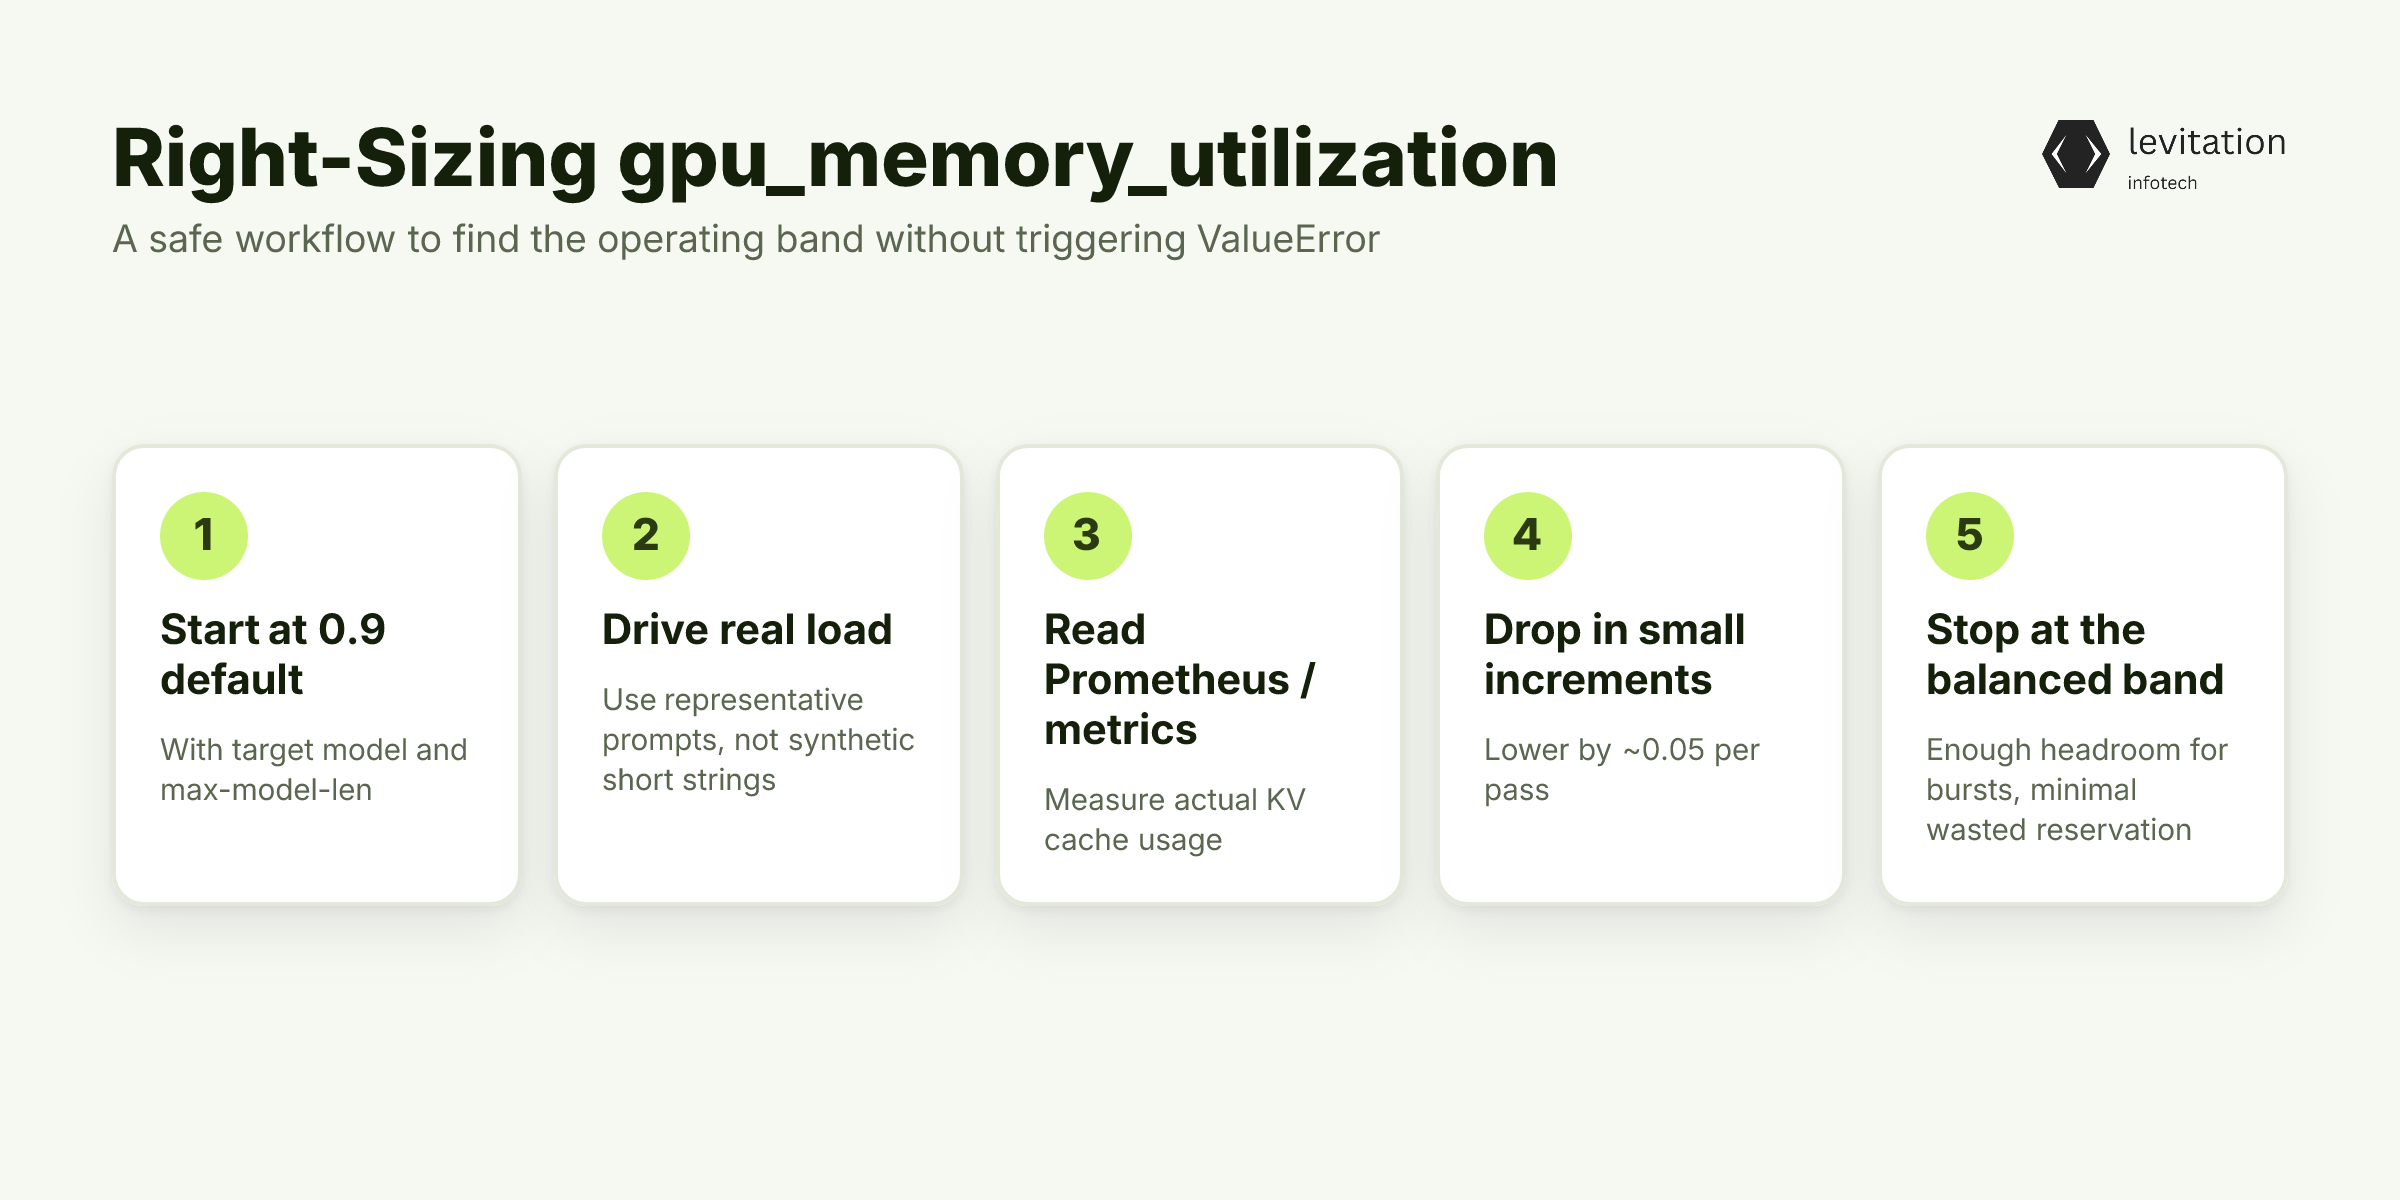
The correct workflow:
- Start at 0.9 with your target model and `max-model-len`.
- Drive representative load through the engine (real prompts, not synthetic short strings).
- Read the Prometheus `/metrics` endpoint for actual cache usage.
- Drop `gpu_memory_utilization` in small increments (for example, 0.05).
- Stop when utilization sits in a band that balances headroom for bursts against wasted reservation.
Below a reasonable threshold and you are over-reserving. Above it and the next traffic spike will OOM.
The band is not a magic number. It is the engineering margin between headroom for bursts and a paid-for GPU sitting half-empty.
A real command looks like:
1vllm serve meta-llama/Llama-3-70B-Instruct \2 --gpu-memory-utilization 0.92 \3 --max-model-len 8192
A slightly elevated value here gives up a small fraction of free memory. It guarantees the engine boots under contention with other CUDA workloads. The same reserve-vs-active tension shows up across every serving stack. See the broader pattern in production inference and GPU memory architecture.
Configuration alone will not pass the audit. You also need the metrics layer that lets an auditor see the difference between reserved and actively-used memory.
Reframing the Audit Around Cost-Per-Token, Not Memory-Per-Model
Three metrics turn the audit conversation around: `vllm:gpu_cache_usage_perc`, `vllm:prompt_tokens_total`, and `vllm:generation_tokens_total`. The first reports the fraction of reserved blocks that hold data. The second and third let you compute total tokens served.
Wire these into Prometheus. Build a Grafana panel that shows "reserved vs active" as a stacked area.
The 9GB "ghost" resolves into a much smaller active working set sitting on top of the reserved block pool. The auditor's memory spike is now broken into "reserved but empty" and "actively serving" components. The interpretation flips: - Before the dashboard: "You reserved 9GB for no reason." - After the dashboard: "You reserved 9GB to serve many times the concurrent load a naive allocator could handle on the same hardware."
This single dashboard is what the auditor needs. It shows you are not wasting memory. You are paying for headroom that buys higher throughput than a naive allocator on the same hardware.
Pair the inference dashboard with the AI/ML training cost model. Leadership sees inference efficiency against retraining cost when SLAs slip. The two views close the loop: cheap inference per token plus a clear retraining budget.
Auditors stop asking "why is memory high" and start asking "what is the cost-per-million-tokens trend."
When the metrics line up, the conversation changes. You are no longer defending waste. You are selling headroom. But what does the GPU invoice actually look like once this is in place?
What the GPU Line Item Actually Looks Like When You Get This Right
Inference cost drops to a fraction of the previous serving stack per million tokens. The GPU invoice line item looks unchanged. That is the part that confuses CFOs.
The right comparison is not GPU month-over-month. It is tokens-per-dollar, week-over-week.
This is the kind of work that looks simple after the fact. It is not simple to get right the first time, and the first attempt is usually the audit that ends with a "show me again next quarter" note.
The 23GB ghost is the symptom. The cure is a metrics layer, configuration discipline, and an audit conversation on cost-per-token. Teams serious about production-grade AI systems treat the FinOps layer as a first-class deliverable, not an afterthought.
Frequently Asked Questions
Q: Why does vLLM use more GPU memory than the model size?
A: vLLM pre-allocates the maximum possible KV cache block space at startup so it can map new tokens in O(1) during serving. For a 7B model that needs 14GB of weights, this reservation can push total GPU usage to ~23GB. The memory is not wasted. It is reserved address space, not active data.
Q: What does gpu_memory_utilization actually control?
A: It sets the fraction of total GPU memory vLLM may reserve for the engine (weights + KV cache blocks + activation workspace). The default of 0.9 leaves 10% for CUDA kernels and PyTorch overhead. Lowering it shrinks the maximum KV cache the engine can map, which directly caps concurrent request capacity.
Q: How do I fix "No available memory for the cache blocks" in vLLM?
A: Raise `gpu_memory_utilization` incrementally (for example, from 0.9 toward 0.95) until the engine boots. The error means the remaining non-reserved memory is smaller than the minimum KV cache the engine needs. That minimum is set by your `max-model-len`.
Q: Does KV cache pre-allocation reduce throughput?
A: No. It is what enables high throughput. By reserving the full block space up front, vLLM avoids per-request allocator calls. It also avoids internal fragmentation, which is the mechanism behind PagedAttention's continuous batching. The reserved memory is the cost of running many more concurrent requests per GPU.
Q: How do I prove to a FinOps team that vLLM is cheaper than the old stack?
A: Export `vllm:gpu_cache_usage_perc` and `vllm:prompt_tokens_total` / `vllm:generation_tokens_total` to Prometheus. The first metric shows that reserved memory is mostly empty at any given moment. The second lets you compute cost-per-million-tokens against the GPU invoice. That comparison is what reframes the audit.
About the author
Mayank Singh is a software developer at Levitation Infotech, where he builds web and AI-powered applications across the company’s fintech, healthcare, and enterprise projects.