


TL;DR: AI dashboards become dangerous when visual polish outruns data provenance, especially when models infer values from screenshots. Make AI the renderer, not the source: retrieve governed data, validate its meaning, and block publication until every release passes.
Key Takeaways: - Separate visual authority from data authority; polish cannot prove provenance. - Keep metric values out of model authorship through canonical sources, contracts, and validation gates. - Promote dashboards through a release pipeline with lineage, ownership, approval records, and rollback.
A Polished Dashboard Can Hide a Fabricated Metric
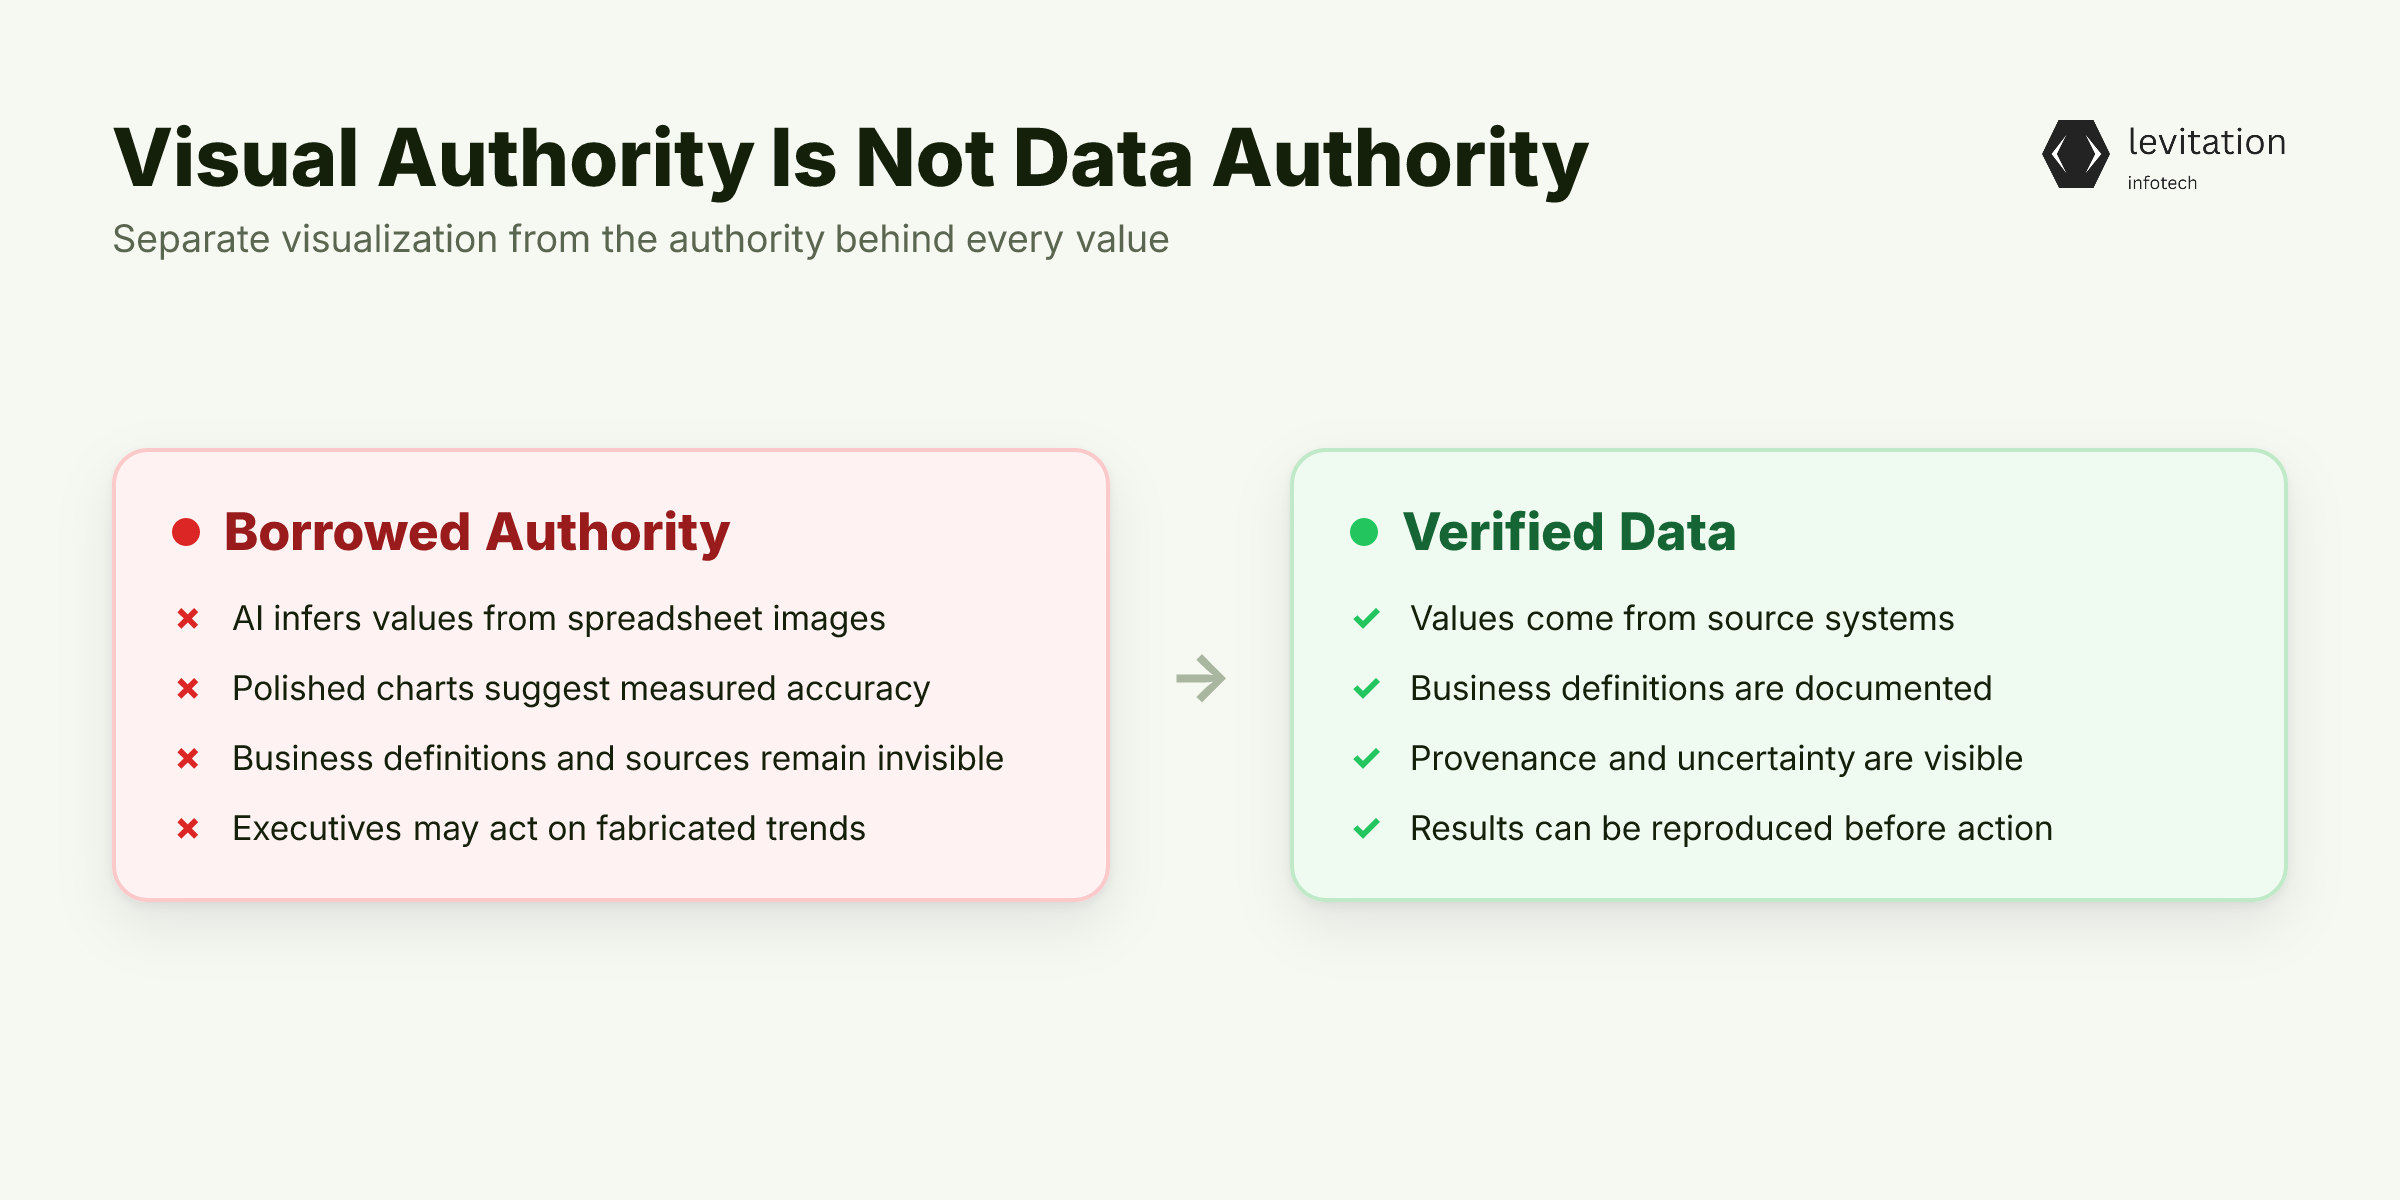
An AI data visualization can turn a guessed spreadsheet value into a boardroom-ready chart. The number can be wrong. Yet the polished design makes everyone assume it is right.
The boardroom failure mode
Imagine a CFO seeing a clean conversion trend and moving budget. The value behind that point was inferred rather than retrieved from a source of truth. Nothing on the screen says so.
Clean axes and familiar colors carry borrowed authority. They make an estimate feel like a measured result.
This is an AI dashboard governance issue. The dashboard can shape budget, staffing, risk, or executive action without an error state. How can a team spot that borrowed authority before action follows?
Visual authority is not data authority
Labels can also be wrong. A series called recognized revenue can include refunds. A weekly total can sit beside monthly totals. The render remains elegant while business truth drifts.
A documented failure mode begins when someone pastes a spreadsheet screenshot into a model. The model guesses a few cell values, then charts them confidently. The failure occurs before styling begins.
CTOs should therefore separate two jobs. AI can choose and format a visualization. It must never become the authority for the values it displays.
Before trusting any AI-generated dashboard, ask: - Where did each value come from? - What business definition does it represent? - Can someone reproduce it from the source system?
If the error is already inside the rendered chart, where did the workflow let a model become a data source?
Where Wrong Numbers Enter the Dashboard Pipeline
The screenshot is only one door into the failure.
The screenshot-to-chart path
Image and spreadsheet extraction can guess cells, infer missing values, or mistranscribe one digit. Those errors become chart inputs before a chart engine sees them.
Suppose one cell is misread. The engine trusts the extracted table, so it cannot detect the extraction error. The chart inherits the extractor's uncertainty without showing which cells were uncertain.
Generic AI dashboard templates can hide problems. Their polished defaults can disguise an unusual dataset, sparse history, or a flat line that deserves suspicion. Which other entry points can carry the same error?
The semantic drift path
A field can be real and still be wrong for the claim. It can represent another metric, period, unit, filter, segment, or definition. The chart looks plausible because the number itself exists.
These errors fall within the broader LLM data hallucination risks, but semantic drift poses a harder problem. Every value exists somewhere. It simply answers a different business question. How can a reviewer catch a valid number attached to the wrong question?
The narrative amplification path
Automatic titles and summaries add another layer. Generic language turns a nonsensical series into an apparently intentional trend. Reviewers focus on the story instead of tracing every point.
The effect compounds. A hallucinated point becomes a chart. The chart becomes a narrative.
The narrative becomes settled evidence. Each handoff makes the original uncertainty harder to see. The AI-generated dashboard failure patterns reinforce one another in exactly this way.
Some models can catch inconsistencies and help validate data, but they cannot decide what your business metric means. A larger model does not solve this problem. Where should the boundary sit?
Make AI the Renderer, Not the Source
The fix is architectural, and it is blunt. AI must never be the source of dashboard numbers. It can help fetch, clean, select, and chart values only when those values originate in governed systems.
The target flow is straightforward:
- Retrieve data from governed source systems.
- Resolve it through a canonical semantic layer.
- Apply schema, semantic, reconciliation, and business-rule checks.
- Freeze the approved dataset as a release snapshot.
- Let AI assist with rendering and explanation.
A semantic layer for enterprise AI resolves source fields into named business metrics. The validation gate decides whether a release is fit for use. Only an approved dataset reaches rendering or explanation.
Without that boundary, the model becomes a convenient but unauditable ledger.
Define the metric before the chart
A metric contract turns business meaning into release requirements. It should identify: - Metric name, identifier, and definition - Source of record and accountable owner - Approved calculation - Unit and currency - Time grain - Required filters and dimensions - Freshness requirement - Reconciliation target
Contract fields are not documentation. They are executable constraints.
Pasted screenshots and loosely structured exports should not be production sources. If extraction is unavoidable, treat each value as an untrusted proposal until it matches the source record.
A Microsoft Data Formulator workflow can speed up exploration and chart construction. Place it downstream of semantic validation for production work.
Its rendered output must stay linked to the approved dataset. It cannot become its own ledger.
Here is the useful design test: can the model alter a metric value without a traceable source change? If yes, the architecture still allows AI to author facts.
The boundary prevents invented values, but it cannot guarantee that a correctly retrieved field means what the chart claims. Semantic validation has to close that gap. Can it catch the mismatch before styling begins?
Validate Meaning Before You Style the Chart
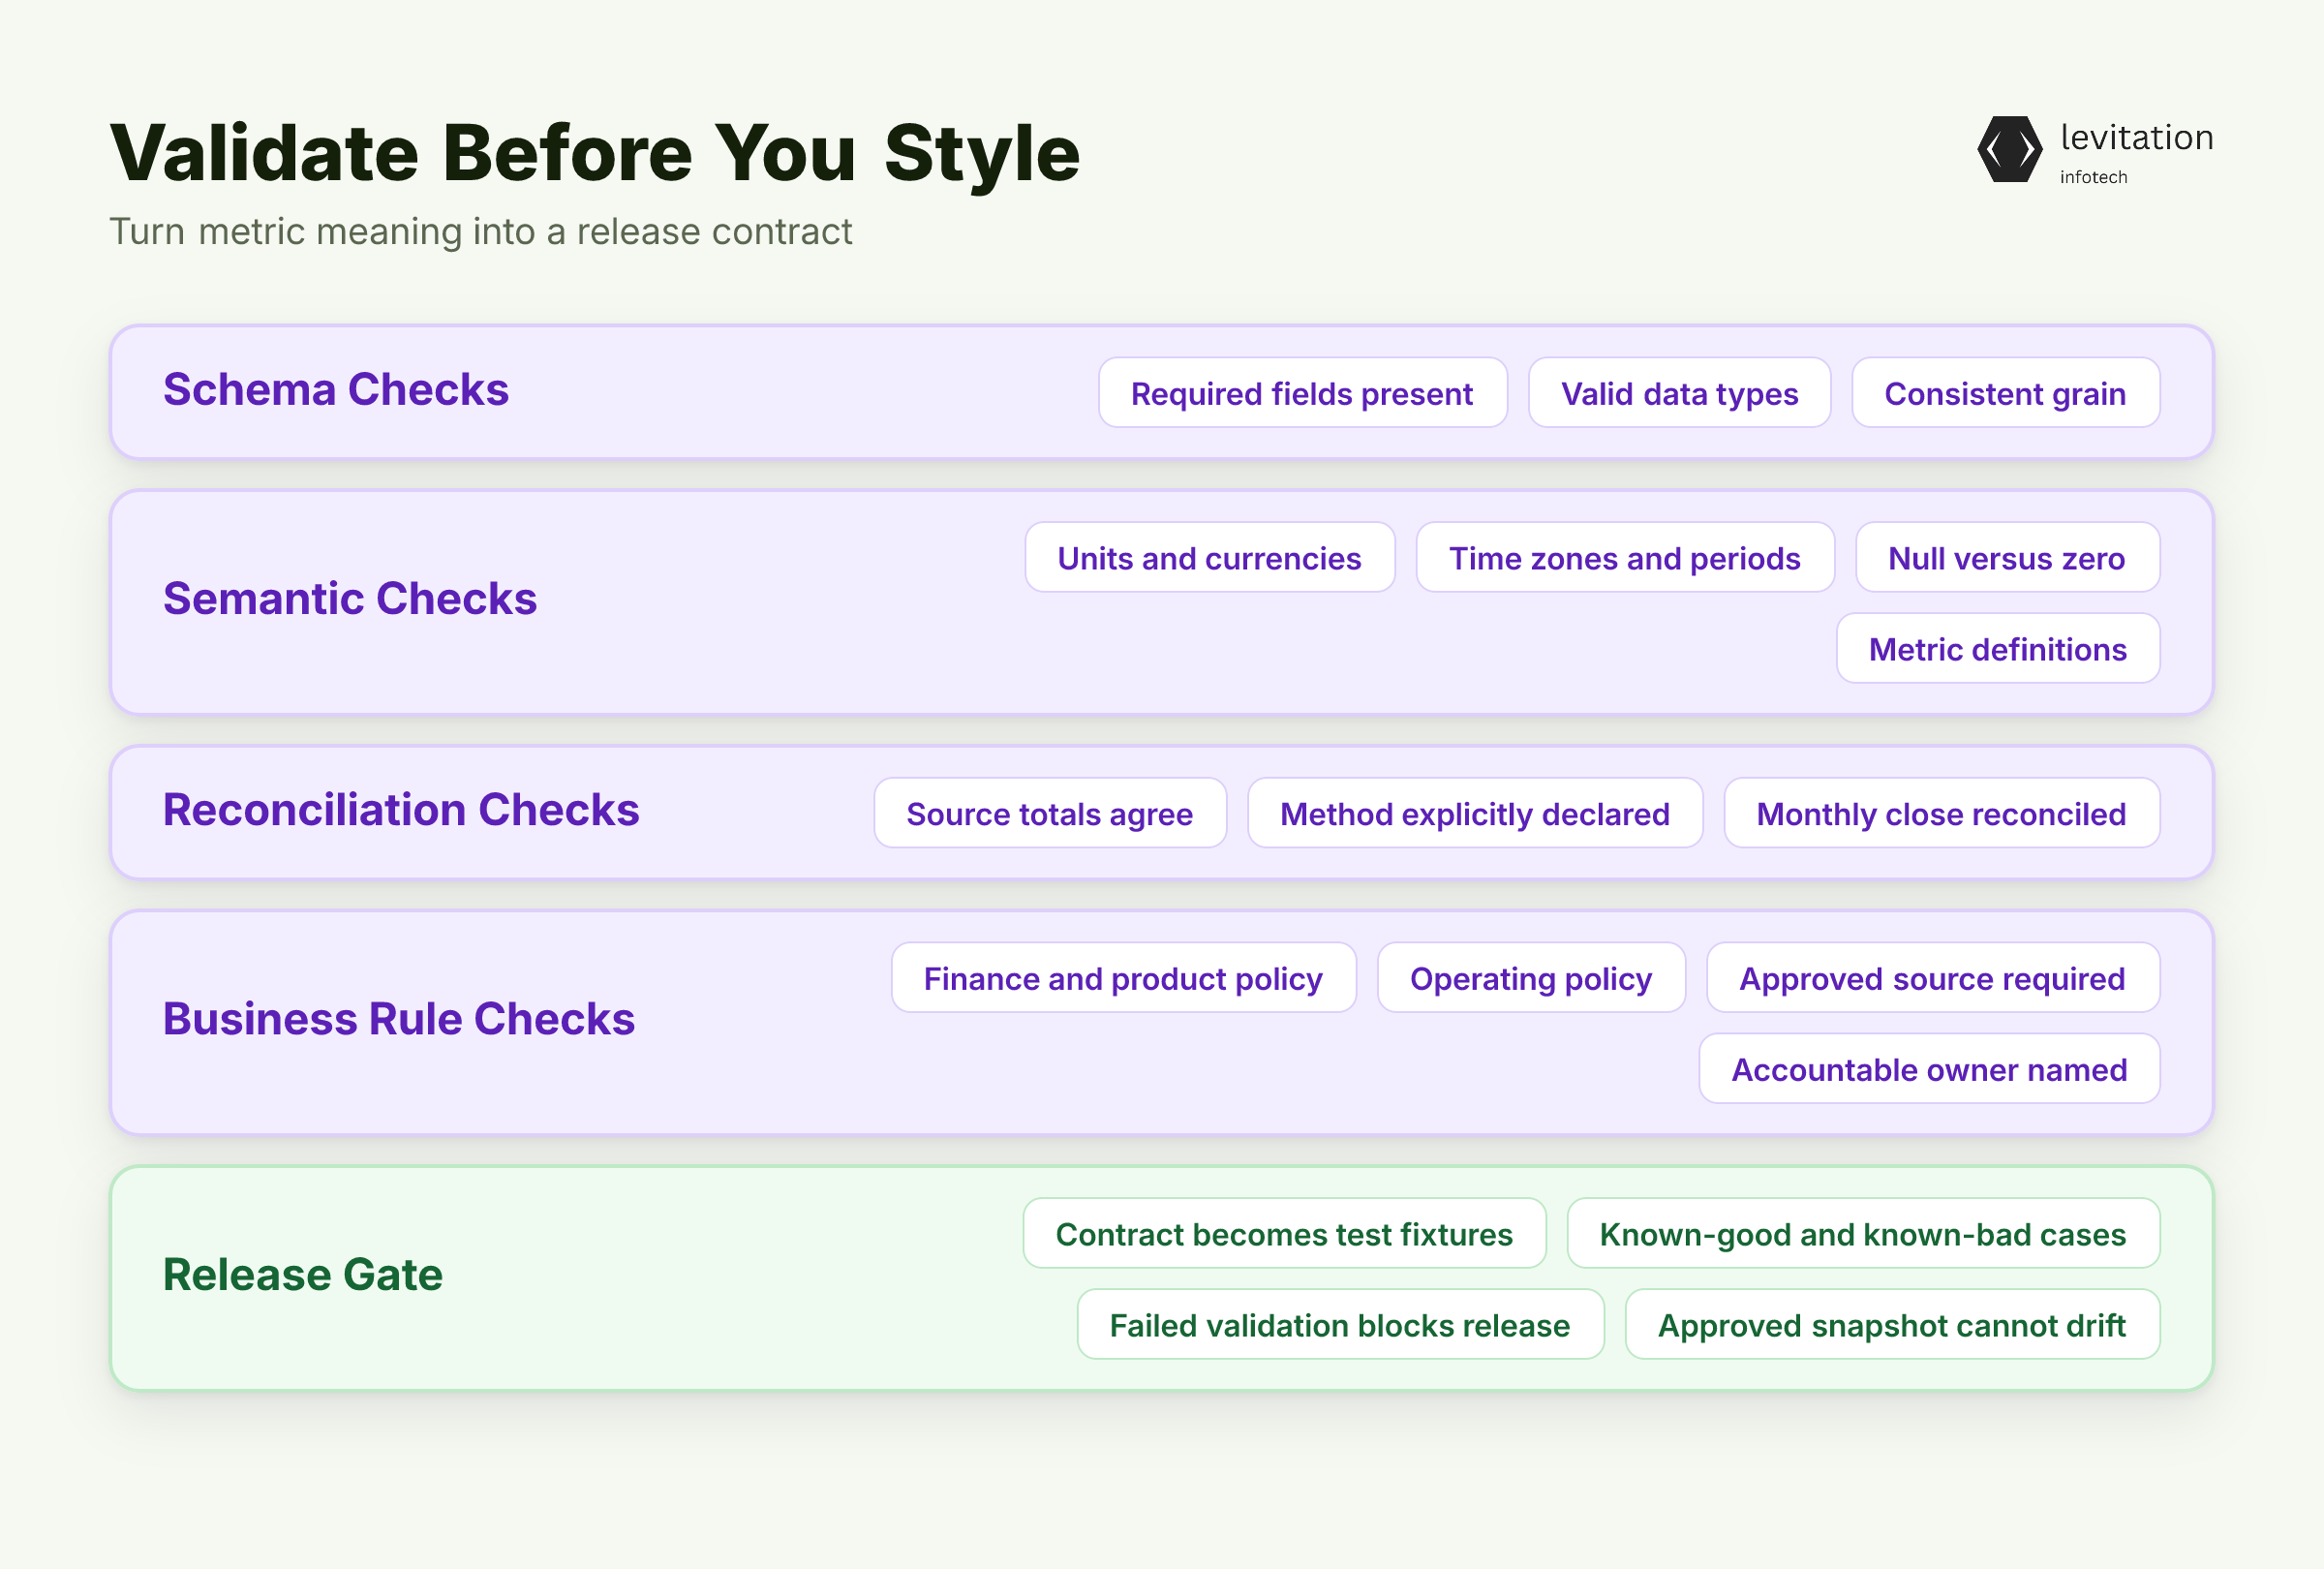
A clean chart can still carry a semantic defect.
Four validation layers
Validation must cover four distinct questions: - Schema: Are the required fields present, with valid data types and grain? - Semantics: Does each field mean what the metric claims? - Reconciliation: Do totals agree with the source of record under the declared method? - Business rules: Does the data satisfy finance, product, or operating policy?
For example, a recognized-revenue release can require an approved finance source. It must use monthly grain and USD, apply recognized-status filters, and name an accountable owner. The release must reconcile against the monthly close.
The contract tells validators what must be true before publication.
Schema validation alone cannot enforce that contract. A numeric field can be perfectly typed while mixing recurring and one-time revenue. It can also compare a monthly total with a weekly total.
Concrete semantic checks should cover: - Units and currencies - Reporting time zones and period boundaries - Null-versus-zero handling - Category and product mappings - Aggregation logic - Metric-version compatibility
These controls belong in semantic data validation and data contracts for analytics systems. They turn a metric label into a testable release condition. Can the same release decision be reproduced later?
Keep the release decision reproducible
Use AI to inspect data, propose mismatches, and explain failures. Keep deterministic reconciliation and business rules outside the model. The release decision must stay reproducible even if model output changes.
Turn each contract into test fixtures and CI checks. Include known-good, known-bad, and definition-change cases. A failed validation must stop publication.
A warning beside a polished chart is not a control.
But validation becomes theater if approved data can drift between review and publication. The release path itself must enforce the gate. What stops an approved snapshot from changing after review?
Govern AI Dashboard Delivery End to End
Validation only works if publication cannot route around it.
Build stage
Start with the decision the dashboard must support. Then define the metric contract, owner, source, validation rules, and intended audience. Do this before asking a model to choose a chart.
This turns chart generation from a creative exercise into a governed deliverable. It also forces teams to resolve disagreement over meaning before publication. What must be settled before chart generation begins?
Promotion stage
Retrieve data directly from governed systems. Run schema, semantic, reconciliation, and business-rule checks. Allow AI-assisted charting only over the approved result.
Keep exploratory, AI-generated dashboards in a sandbox. Executive and production dashboards require passing validation and an accountable owner.
Exploration can create proposals. Promotion creates facts.
A reusable enterprise AI deployment pipeline should include versioned metric contracts, source adapters, automated tests, approval records, and audit logs. Every published chart should point back to that evidence.
A spreadsheet still cannot be your AI control plane. It can hold a checklist, but it cannot enforce the release path. What must travel with every published dashboard?
Operation stage
Attach the source version, metric version, freshness timestamp, validation status, and owner to the published artifact. These fields travel with the dashboard, not inside a separate deployment note.
Monitor source freshness, metric-definition changes, validation failures, unexpected query changes, and stale dependencies. Production dashboard observability should expose those signals before executives see a broken trend.
Natural-language summaries and recommendations must use the same validated dataset snapshot as the chart. An attractive explanation of a bad number increases the risk.
The release checklist should cover: - Canonical source - Accountable metric owner - Versioned metric contract - Defined reconciliation target - Blocking release gate - Complete lineage - Tested rollback path
The payoff is not merely fewer bad charts. It is a repeatable operating model that can deliver faster without asking executives to trust the interface. Can governance create speed rather than friction?
Replace Dashboard Theater With Decision-Grade AI
Once those foundations are reusable, the operational gains include: - Faster decisions because executives can trust the release process. - Traceable metrics with stable definitions. - Controlled releases with recorded approvals. - A reusable path from governed data to executive communication.
Teams then spend less time rebuilding source connections and more time refining decision logic. The model becomes a faster interface to governed data, not an oracle.
Measure trust through operating coverage
Track the share of dashboards that: - Use canonical sources - Pass semantic validation - Carry complete lineage - Name an accountable owner - Refresh within their declared freshness windows
Reusable source connections, metric contracts, and validation checks can reduce repeated setup work. Environment-specific integrations and approvals still affect delivery time. Compare systems on those mechanisms rather than treating deployment claims as proof of sound metric governance.
That distinction matters when evaluating enterprise AI systems built for longevity. The operating goal is decision-grade AI data visualization: trusted decisions, not persuasive pictures.
AI data visualization should be approved only when every number traces to a source and every definition traces to a contract. Every release must also trace to a validation record. Anything less is a persuasive picture, not a decision system.
Can each release clear all three traces?
Frequently Asked Questions
Can AI-generated dashboards contain made-up data?
Yes. A model can extract or infer values from a pasted spreadsheet image. It can guess missing cells and render them in a polished chart. Source fidelity still requires governed data, validation, and a model barred from authoring values.
What is semantic data validation in AI data visualization?
It checks whether a field means what the metric claims, including its definition, unit, time grain, filters, and business rules. Schema validation alone would not catch a chart labeled monthly recurring revenue that actually includes one-time service fees.
Should Microsoft Data Formulator be used for enterprise dashboards?
It can speed up chart generation and exploration. Production metrics should still come from an approved dataset rather than a prompt or rendered image. Place it downstream of semantic validation. Retain the source version and validation status with every published dashboard.
How do you stop an LLM from inventing dashboard numbers?
Remove its permission to define values. Let it interpret questions, choose encodings, and draft summaries only over retrieved, validated records. Fail the release if lineage, reconciliation, or business-rule checks do not pass.
Before the next board chart ships, ask one question: can every number survive its source trail?
About the author
Mayank Singh is a software developer at Levitation Infotech, where he builds web and AI-powered applications across the company’s fintech, healthcare, and enterprise projects.