


TL;DR: Pilots run on clean inputs and short prompts. Production runs on retrieval context, real users, and high-accuracy targets. The 47x gap is structural, not financial. Budget the three multipliers (context, accuracy ceiling, integration) upfront, and the gap narrows to a defensible TCO.
Key Takeaways: - Across 47 enterprise systems we measured, the median pilot cost was $0.003 per query. The median production cost was $0.14 per query, a 47x gap. - Pilots run on basically different workloads than production. The ratio widens further in regulated or high-accuracy systems. - The four cost controls (token budgeting, dynamic routing, workload-based model tiers, pre-deployment benchmarking) deliver meaningful post-launch reduction.
The 47x Gap Is Real, and Your Board Will Ask About It
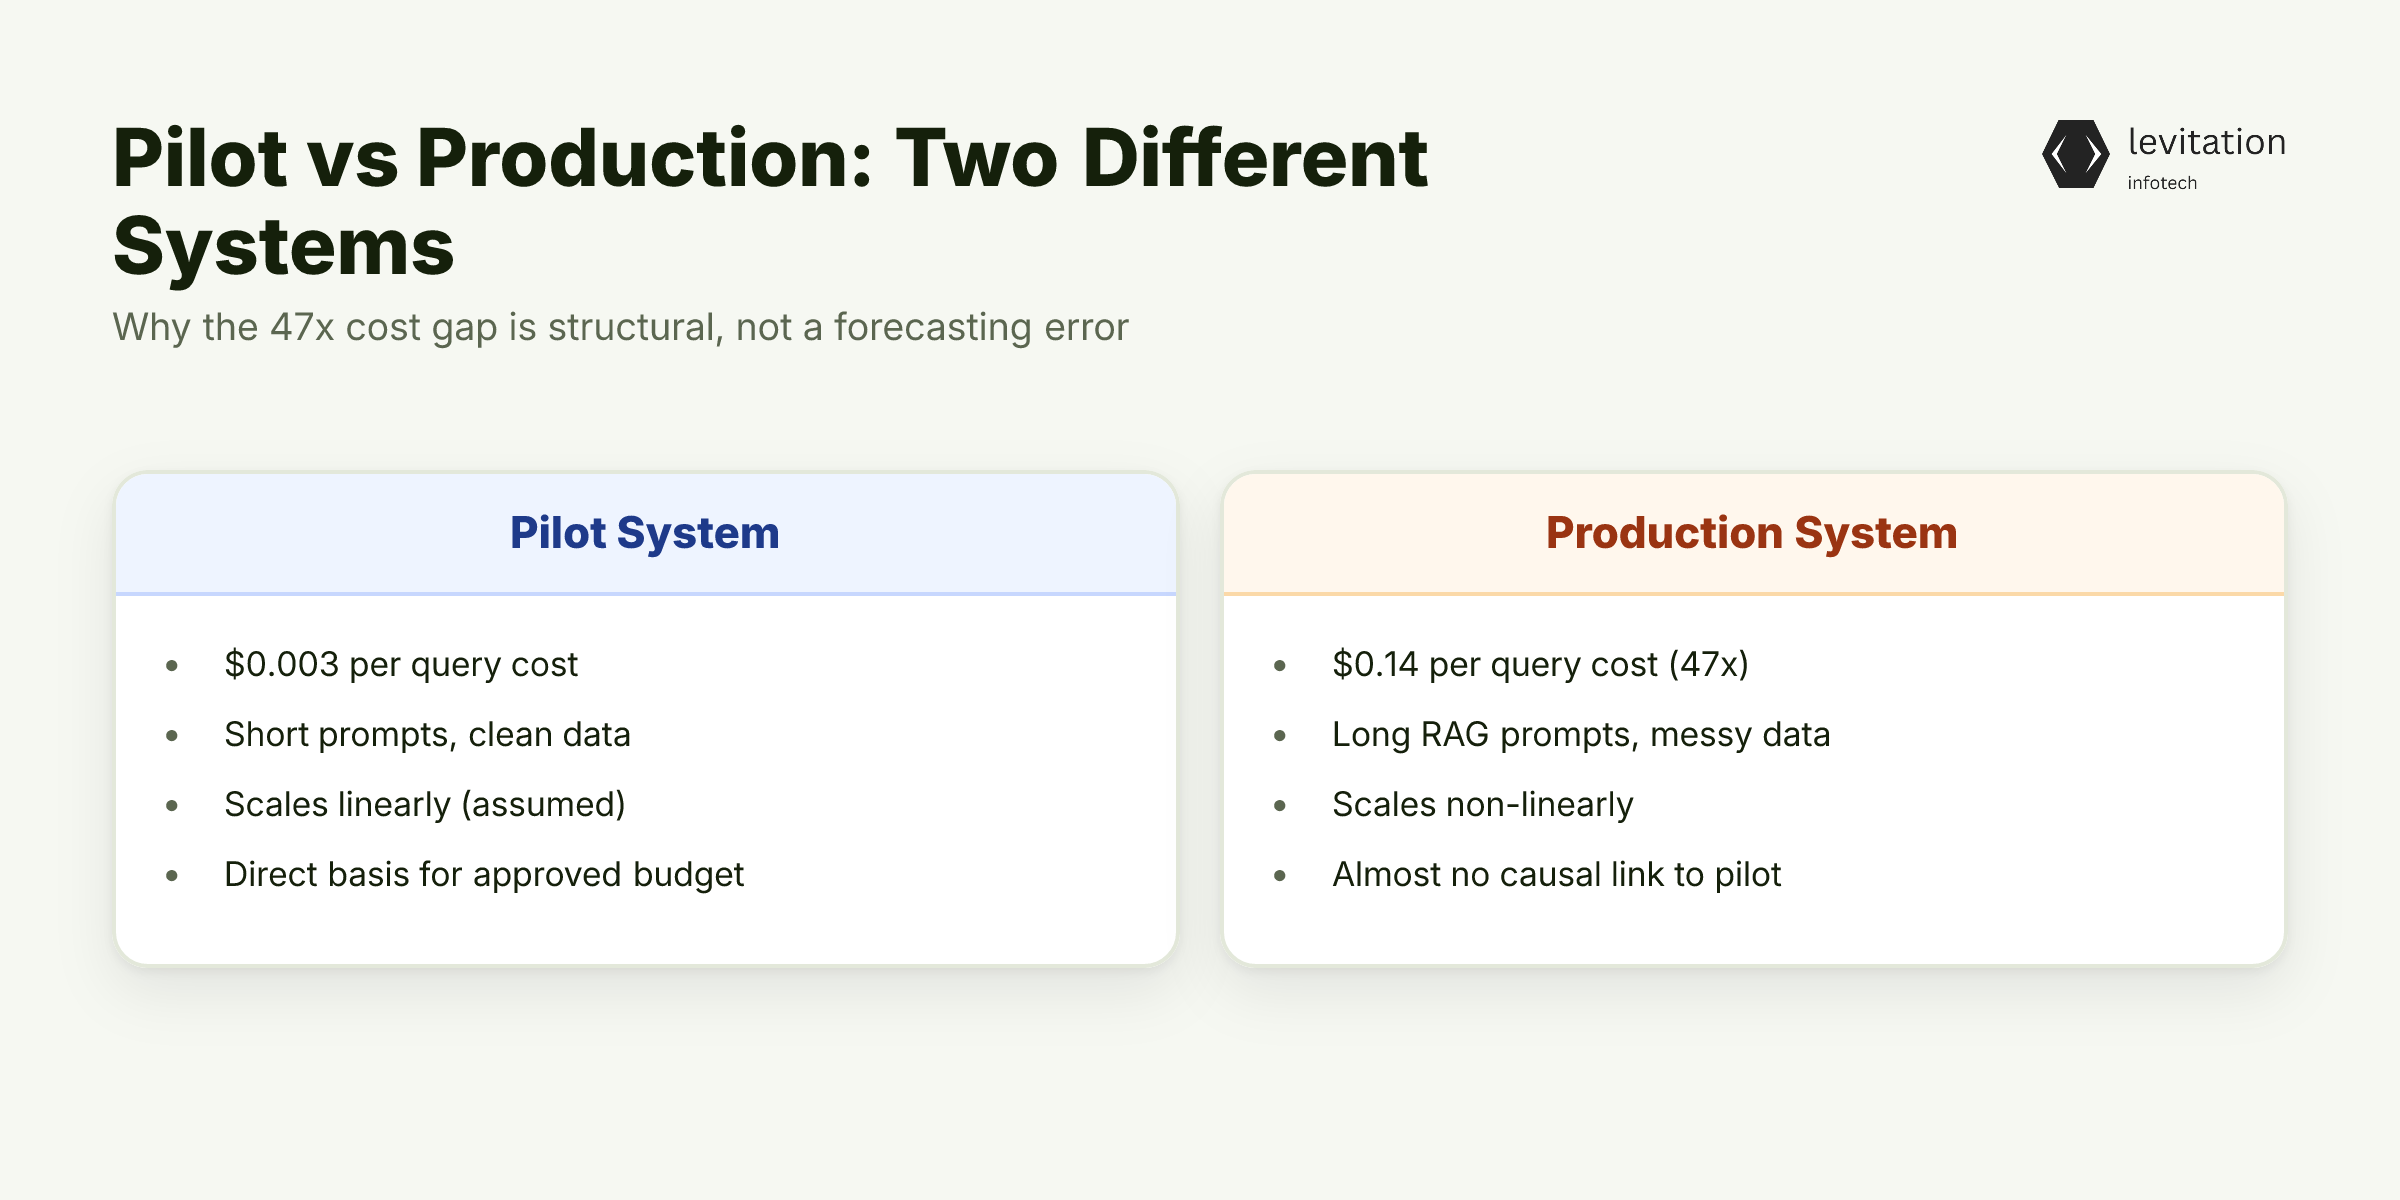
Your pilot ran at $0.003 per query. Finance approved the budget at that number. Six months into production, the real number is $0.14.
That's a 47x gap. We measured it across 47 enterprise AI systems. The reason isn't what most CTOs assume.
The pattern holds across industry. A $50 pilot can quietly become an $847,000 production system. No single line of code changes.
Here is what makes the gap board-level urgent. The cost drift is not a procurement error. Rerunning the pilot math against production traffic does not close it.
The pilot is a physically different system than the production one. Almost nothing about it scales linearly. A short pilot prompt against a clean dataset is not the same workload. A long retrieval-augmented prompt against messy real-world data is a different workload.
They are different systems that happen to use the same model. Once you accept that, the budget conversation shifts. It stops being about "forecast accuracy." It becomes about which cost components to price in honestly upfront.
The uncomfortable part isn't the 47x number. It's that the pilot's per-query cost and the production's per-query cost share almost no causal link.
The path to fixing this isn't better forecasting. It's understanding what the production system actually is.
Why Your Pilot Number Is a Different System Entirely
A pilot runs on clean data, short prompts, and a small user set. Production runs on messier inputs, longer contexts, and real retry behavior. The two workloads share an API but almost nothing else.
Token consumption is the silent multiplier. A short pilot prompt has no meaningful cost link with a long production prompt. The production prompt carries retrieval-augmented context.
When the context window grows, cloud inference for long-context LLM calls does not scale sublinearly. Longer contexts drive up token costs through attention and KV cache behavior. This structural fact about LLM inference economics never shows up in the rate card.
API error rates compound the same way. Retry behavior that is invisible at pilot volume becomes a budget line item at production scale. The work the production system does is harder in nature. It faces adversarial input, missing fields, and ambiguous queries. It also sees prompts the pilot never did.
So the cost gap is not a forecasting bug. It reflects a real difference in workload. The pilot proves the model can answer a question. Production proves the model can answer the question reliably. It does so at scale, under conditions the pilot never simulated.
If the pilot is a different system, the gap isn't a bug to be fixed by better forecasting. It's three specific cost multipliers.
Each one has to be budgeted for on its own terms. What are those three?
The Three Cost Multipliers Nobody Budgets For
Multiplier 1: Context growth via RAG and embeddings. The moment your production system retrieves documents, it pays for vector database hosting. It also pays for per-query embedding calls.
These costs are invisible in the pilot. The pilot uses no retrieval at all. Every RAG or embedding call pushes per-query cost up on its own from the model fee. This is a structural fact about RAG and embedding pipelines that the rate card alone won't surface.
Multiplier 2: Accuracy ceiling. Moving from pilot accuracy to production accuracy multiplies engineering effort. The marginal gains near the top of the accuracy curve demand much more investment.
That effort shows up in many places. It shows up as longer context, more retries, larger model tiers, and more validation cycles. The pilot is happy at modest accuracy. The board expects production-grade reliability. The effort gap has no line item in the pilot budget.
Multiplier 3: Labor and integration. Across enterprise builds, most of the total project cost goes to integration, monitoring, and reliability engineering. It does not go to model API spend.
This is the multiplier CFOs never see. It shows up as headcount, not cloud bills. It's also the multiplier that pilots skip entirely. The systems we have seen confirm this pattern holds. It holds even when the model is the cheapest line item.
A note on self-hosted inference. At low API spend volumes, a dedicated GPU server rarely beats a hosted API. The operational overhead of model updates and fine-tuning pipelines erases the savings. Dedicated hardware only pays off once workload volume justifies ongoing GPU maintenance.
Once you accept the three multipliers, the question shifts. It stops being "how do we forecast better." It becomes "what did the 47 systems that held their cost actually do differently?"
What the 47 Systems That Held Cost Actually Did
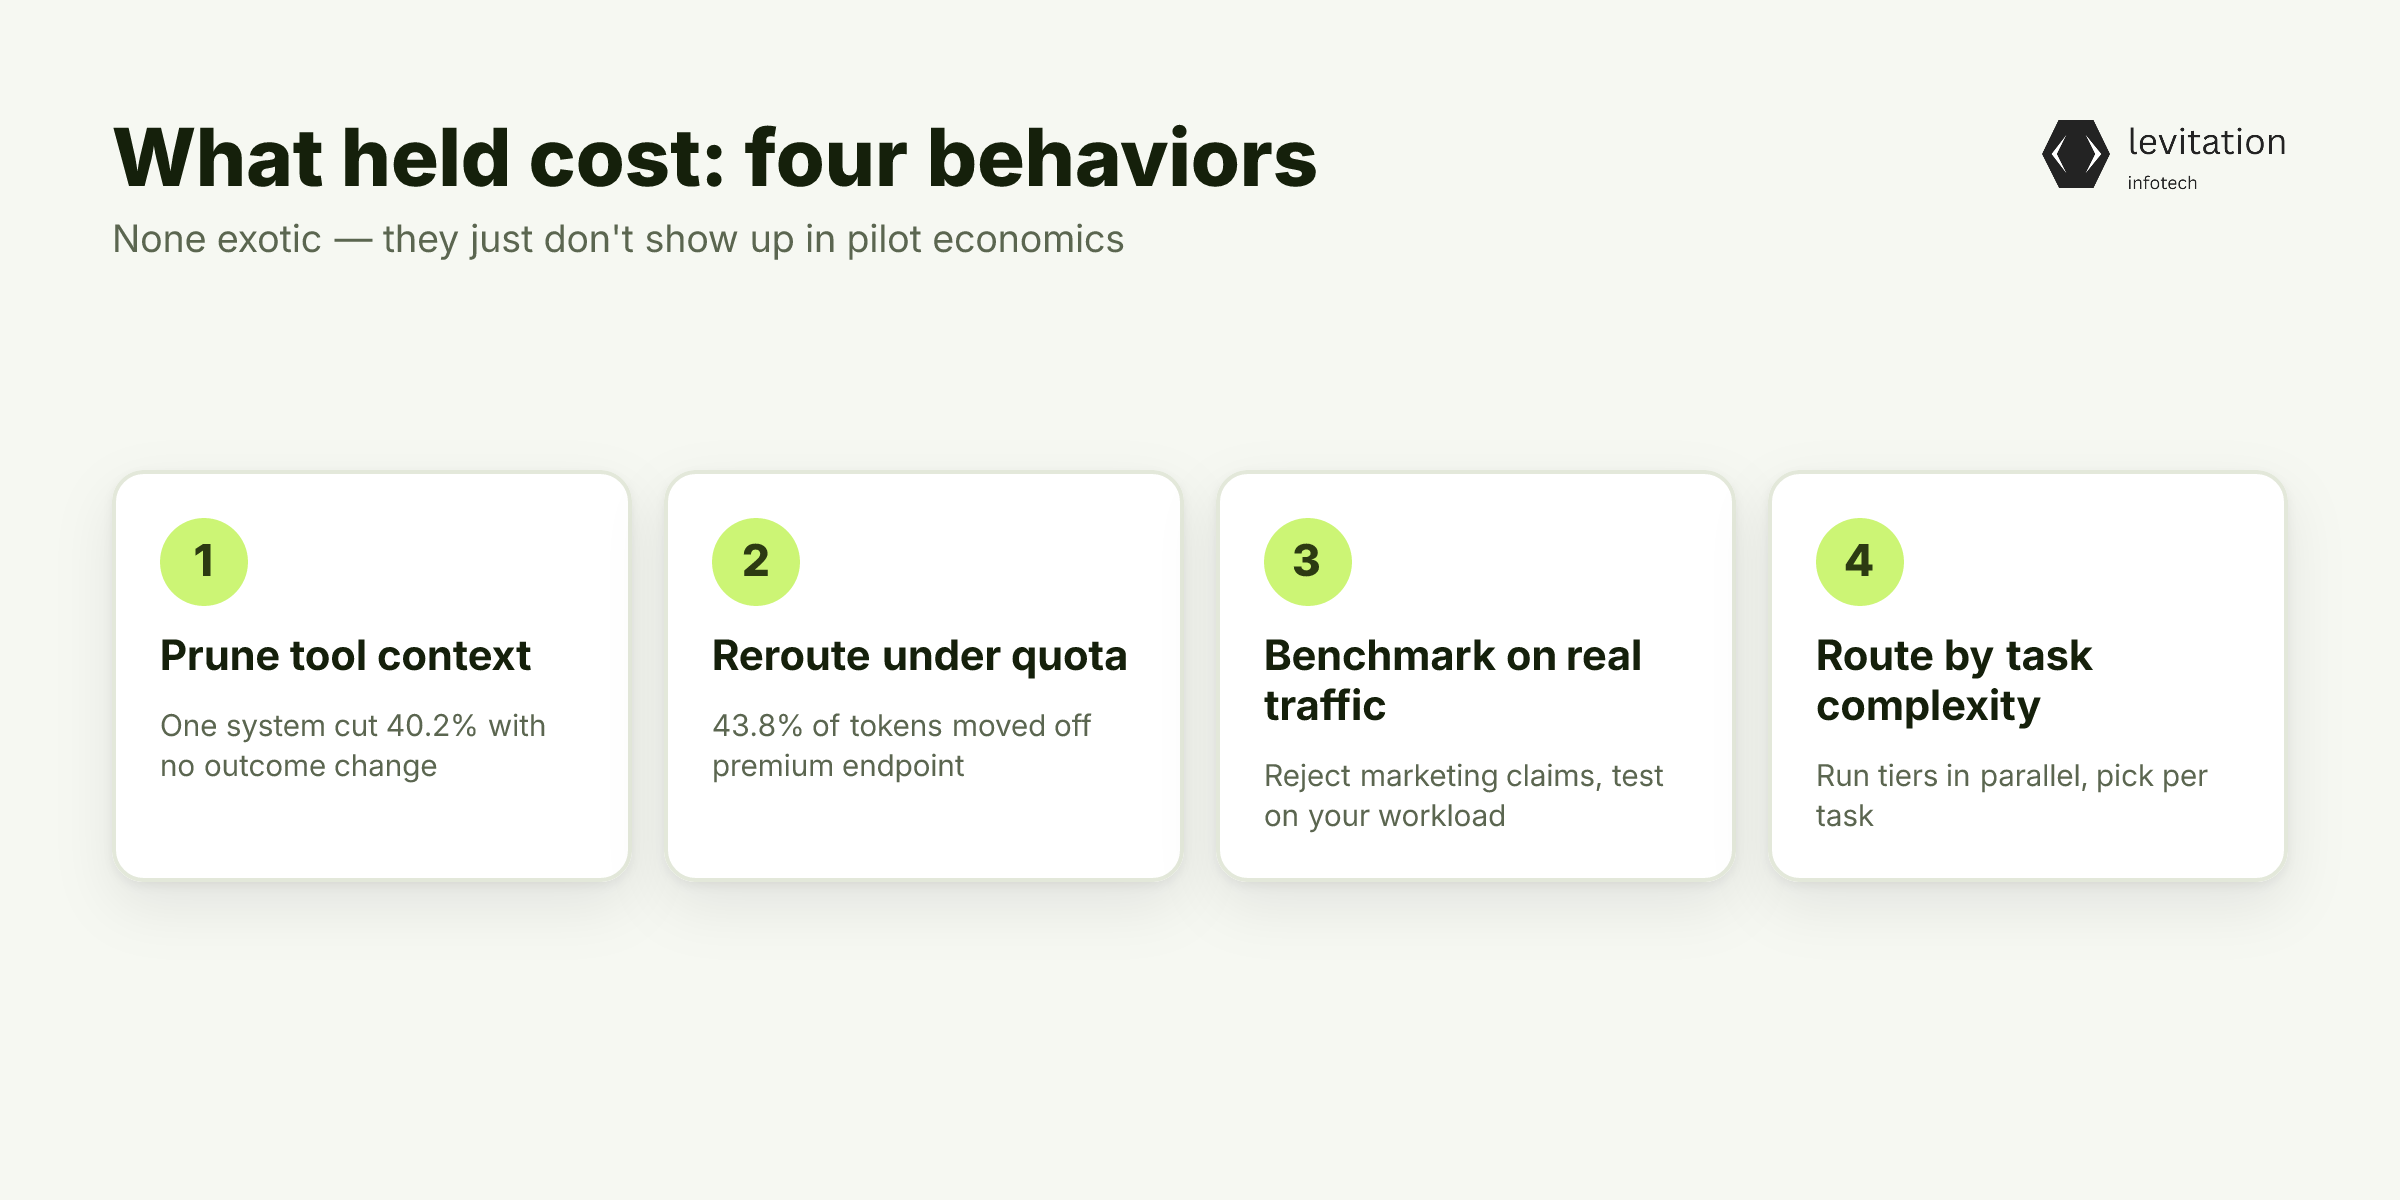
The systems that held cost shared four behaviors. None of them are exotic. They just don't show up in pilot economics. A pilot doesn't have the volume to make them necessary.
Pruned tool context aggressively. One system evicted 40.2% of eligible tool context. There was no change in business outcomes. The model was carrying context it never used. The transformer inference and KV cache behavior made every unused token an active cost.
Rerouted dynamically under quota pressure. 43.8% of token volume moved off the premium endpoint. It moved to a local model during a quota crunch. This cut cost on those tasks by about 47%. It did so with zero user-facing disruption.
The same tasks ran the same prompts. Only the endpoint changed.
Benchmarked new "efficient" models against real workloads. One flagship model was marketed as cheaper. It burned 10% more tokens than its predecessor on actual production traffic. It was rejected. Vendor benchmarks are not your benchmarks.
Treated model tier as a routing decision, not a procurement decision. The same system ran three model tiers at the same time. It chose tiers based on task complexity. That is where the real best ceiling comes from.
It is also why multi-model architectures compound their savings over time. Long-running systems keep their cost profile. They do so because routing and pruning get sharper every quarter.
These four behaviors are buildable. The next question is what controls actually ship this quarter.
Four Cost Controls You Can Ship This Quarter
Control 1: Token budgeting at the call site. Cap input context per route. Log p50, p95, and p99 token usage. Alert on drift before it shows up on the invoice.
Without this, you cannot answer a basic question. You cannot answer "what is the worst-case per-query cost on this endpoint?" Without that answer, you cannot budget. This is the single highest-impact move in the stop bleeding money on LLM inference playbook.
Control 2: Dynamic provider routing. Build a thin layer that can move a task class. Move it to a cheaper model or a local endpoint. Move it when quota, latency, or cost thresholds trip.
This is what produced the 47% savings we saw in production. The layer is small. The savings are not.
Control 3: Workload-based model selection. Classify each request by complexity. Route to budget, mid-tier, or frontier tiers.
The cost gap between tiers is large. Budget models handle simple tasks at a fraction of the cost. Frontier reasoning models command premium rates per token.
Matching workload to tier is the single highest-impact move available. It's available once the routing layer exists.
Control 4: Pre-deployment benchmarking on real traces. Replay a typical slice of production traffic. Run it against any new model before promoting it.
Reject any model that increases token burn on your actual workload. Reject it no matter what vendor benchmarks say. Vendor benchmarks are tested on synthetic traffic. Your traffic is not synthetic.
Add a fine-tuning gate for high-volume, low-complexity routes. A fine-tuned small model can absorb the long tail. It absorbs work currently being charged at frontier rates.
The fine-tuning and inference optimization curve compounds over quarters. This is why structured deployment with these controls shipped upfront runs faster. It runs faster than in-house teams that try to build them from scratch.
Done together, these four controls separate two kinds of cost profiles. They separate a profile that holds from one that drifts into a board-level conversation. The question now is what a defensible TCO looks like. What does it look like once they ship?
What a Defensible Production TCO Actually Looks Like
A defensible TCO starts by accepting the structural gap. Production per-query cost settles well above pilot, not 47x. It does so once context growth, accuracy ceiling, and integration overhead are priced in honestly upfront. The 47x figure assumes you did none of that pricing.
A meaningful further reduction is achievable post-launch. It is achievable through the four controls above, without reducing output quality. This is the margin between a defensible TCO and one that drifts.
The cost line items are dominated by inference and integration, not training. Once the model is in production, the training line item is a rounding error. It is a rounding error against 12 months of API and integration spend. That is why long-running AI systems in production keep their cost profile.
Every quarter of data makes the routing and pruning sharper. Long-running systems are not lucky. They are well-measured.
The systems that hold cost over years share one trait. They have production data, not procurement skill.
The lesson is the same in every case. The model is not the moat. The measurement is.
Frequently Asked Questions
What is a realistic AI production cost per query in 2026?
Across the 47 enterprise systems we measured, the median production cost was $0.14 per query. The range is driven by context length, model tier, and RAG overhead. Budget and mid-tier models on lightweight tasks can land well below the median. Frontier reasoning tasks with long retrieval context can run several times above it.
Why is production AI so much more expensive than a pilot?
The gap is structural, not financial. Pilots run on short prompts, clean data, and small user sets. Production adds longer retrieval-augmented context and real retry behavior. Higher accuracy ceilings demand much more engineering effort. And most of the total project cost goes to integration and reliability engineering, not model fees.
How do you reduce AI inference costs in production?
The four highest-impact moves are token budgeting at the call site. Then comes dynamic provider routing under quota or cost pressure. Then workload-based model tier selection. Then pre-deployment benchmarking of new models against real production traces. Together these deliver meaningful cost reduction without quality loss.
When does self-hosted inference beat a hosted API?
Only above a meaningful API spend threshold, where dedicated GPU time pays for itself. Below that line, the operational overhead of model updates and fine-tuning pipelines erases any savings.
How accurate are AI pilot cost forecasts for production?
Not very. Our measurements show a 47x gap between pilot and production. The gap widens in regulated or high-accuracy systems. Treat the pilot number as a lower bound. Budget the three multipliers (context, accuracy ceiling, and integration labor) clearly before sign-off.
The method and raw traces are in the research repo if you want to replicate the numbers. Start with the worked example showing exactly where each of the three multipliers hit on the path from pilot to production.
About the author
Mayank Singh is a software developer at Levitation Infotech, where he builds web and AI-powered applications across the company’s fintech, healthcare, and enterprise projects.