


TL;DR: A 10M-user PostgreSQL stack typically costs more than an 800M-user one because the bill scales with connection count and unoptimized queries, not user volume. Connection pooling with PgBouncer and disciplined query optimization using EXPLAIN ANALYZE reduce the database line item by collapsing connection overhead and removing compute bottlenecks before any other intervention. OpenAI's choice to stay on PostgreSQL at 800M users proves the engine isn't the problem. The configuration is.
Key Takeaways: - Every PostgreSQL connection costs roughly 10MB of RAM, so 10,000 connections cost 100GB before any query runs. - Connection pooling alone typically reduces the database bill by collapsing per-connection memory overhead, often achievable with a one-day setup. - Query optimization, especially fixing missing composite indexes and N+1 patterns, is cheaper than any hardware upgrade.
The PostgreSQL Cost Paradox at 10M Users
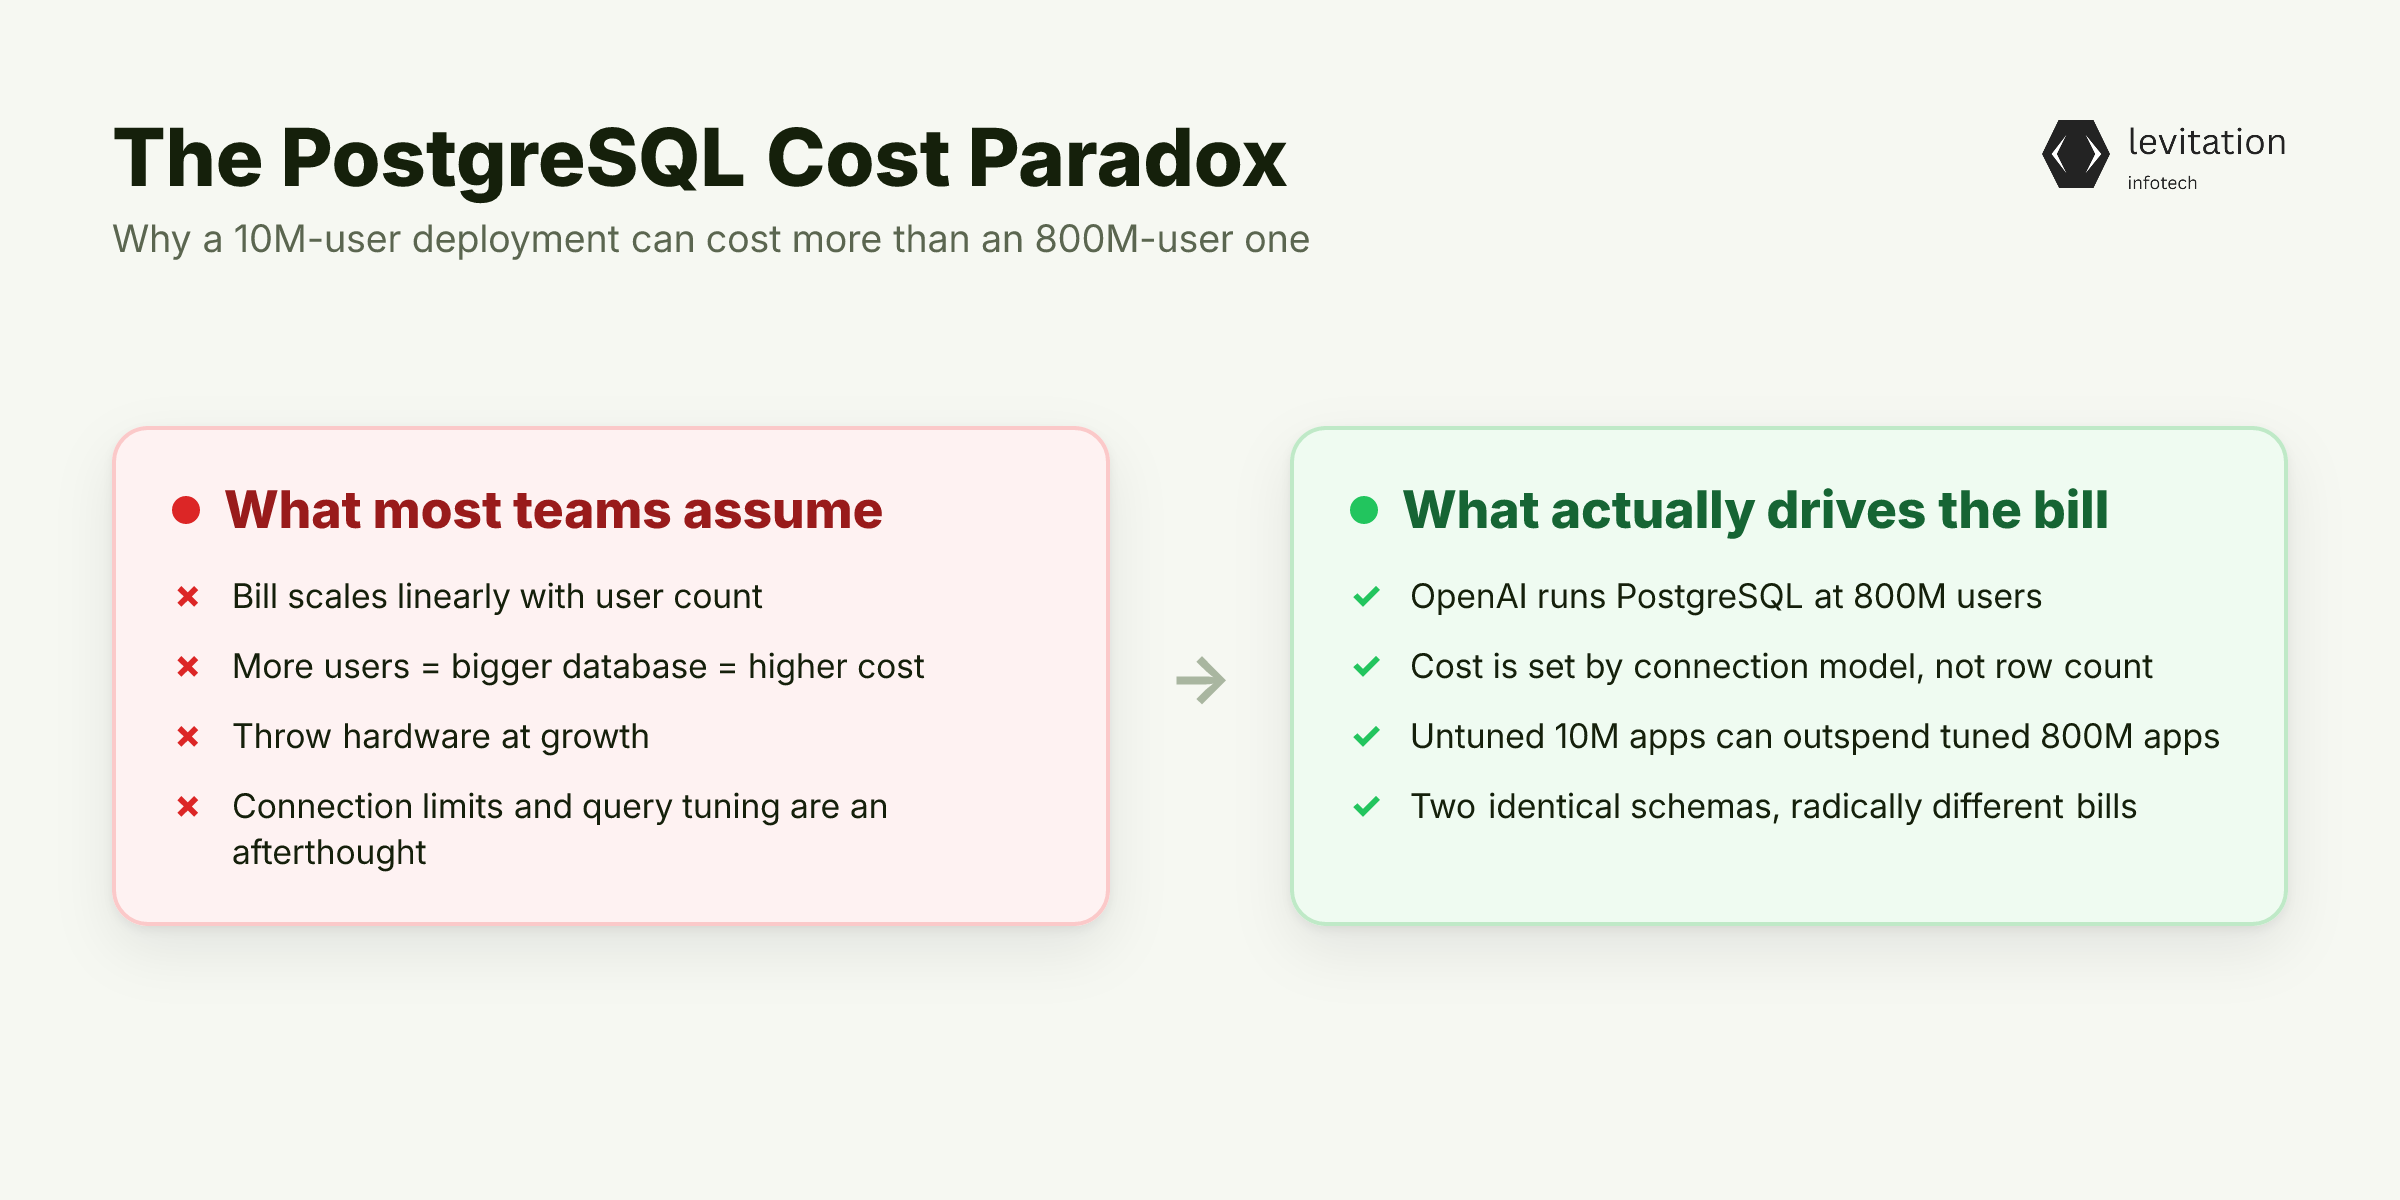
OpenAI runs PostgreSQL at 800 million users. Most teams burning cash at 10 million are about to discover they've been paying for the wrong problem. The database isn't the expense. The configuration is.
Here's the paradox: a 10M-user PostgreSQL deployment often costs more than an 800M-user one running on the same engine. The reason has nothing to do with data volume. It has everything to do with how many connections your application opens and how many queries reach the database unoptimized.
Most CTOs assume a bigger user base means a bigger bill. The intuition feels right. It's wrong. The bill scales with how carelessly the database is configured, not with how many users log in. Two apps with identical schemas and identical row counts can produce radically different monthly bills, because one team tuned their connection model and the other didn't.
The math behind that inversion is ugly. And it starts the moment your app connects.
The Connection Tax You Don't See on Your Invoice
Every PostgreSQL connection costs roughly 10MB of resident memory. That figure is the per-process overhead the OS reserves when a backend process spins up, before any user query runs. It's not the query buffers or the work_mem. It's the baseline footprint of the connection itself.
Run the numbers. Say you have 1,000 app instances. Each opens 10 connections to PostgreSQL. That's 10,000 backend processes consuming about 100GB of RAM, and not a single query has executed yet. You've already paid for 100GB of memory you don't need.
PostgreSQL handles hundreds of connections well. It handles thousands badly. Tens of thousands, it doesn't. The engine was designed in an era when connection counts were modest, and the cost model reflects that.
The bill grows in a way most teams don't model. More app instances, more connections, more RAM provisioned, more replica nodes added to absorb the connection pressure. The cost curve bends upward, not because of data growth, but because of how each instance talks to the database. Vertical scaling hits a ceiling fast because you're paying for memory the queries never use.
The obvious response? Add replicas, shard the database, migrate to NoSQL. That's exactly what most teams do. It's also the most expensive mistake in the playbook.
Why Most Teams Migrate to the Wrong Database
At 10M users, latency spikes. The team declares PostgreSQL "broken." The standard panic response is a multi-year migration to Cassandra, DynamoDB, or ScyllaDB. We've analyzed this migration trap before and the cost math rarely works out.
The fatal flaw in the migration playbook: a bad query on 10 shards is still a bad query. Sharding multiplies the cost of the original mistake. Every wrong index becomes ten wrong indexes. Every missing composite becomes ten missing composites. The team spends a multi-year rewrite of the application for a new data model, and on day one of production the same N+1 query pattern resurfaces in the new engine.
The engineering cost of migration dwarfs the cost of staying and tuning. Meanwhile, the underlying performance problem was never the database. It was a handful of unindexed queries and 10,000 idle connections eating RAM.
OpenAI didn't migrate. They stayed on PostgreSQL and fixed the layers above it, the same engine you already have. Their decision terrified CFOs for a reason: it proved how much cost was avoidable.
So what did they actually fix? The answer is unglamorous. And replicable by any team.
How 800M Users Run on the Same PostgreSQL You Already Have
Seven patterns made it work. None of them are exotic. All of them are standard patterns applied with discipline rather than abandoned at the first sign of latency. - Connection pooling with PgBouncer. Collapse thousands of client connections into a small pool of server connections. - Query optimization before hardware. Run EXPLAIN ANALYZE on every slow path before adding a replica. - Read replicas for read-heavy paths. Not as a band-aid for write contention, which only papers over the real problem. - Index hygiene. Missing indexes remain the single most common cause of "PostgreSQL doesn't scale." - Vacuum and autovacuum tuning. Prevents transaction ID wraparound from killing production at scale. - Partitioning large tables. Split by time or tenant to keep query plans small and hot data in memory. - Connection saturation and lock waits as primary SLO signals. Not just CPU. CPU is the wrong metric to watch when the bottleneck is connection count.
Of those seven, one pattern causes the majority of performance incidents. And it's the easiest to diagnose.
The Three Query Patterns That Kill Performance at Scale
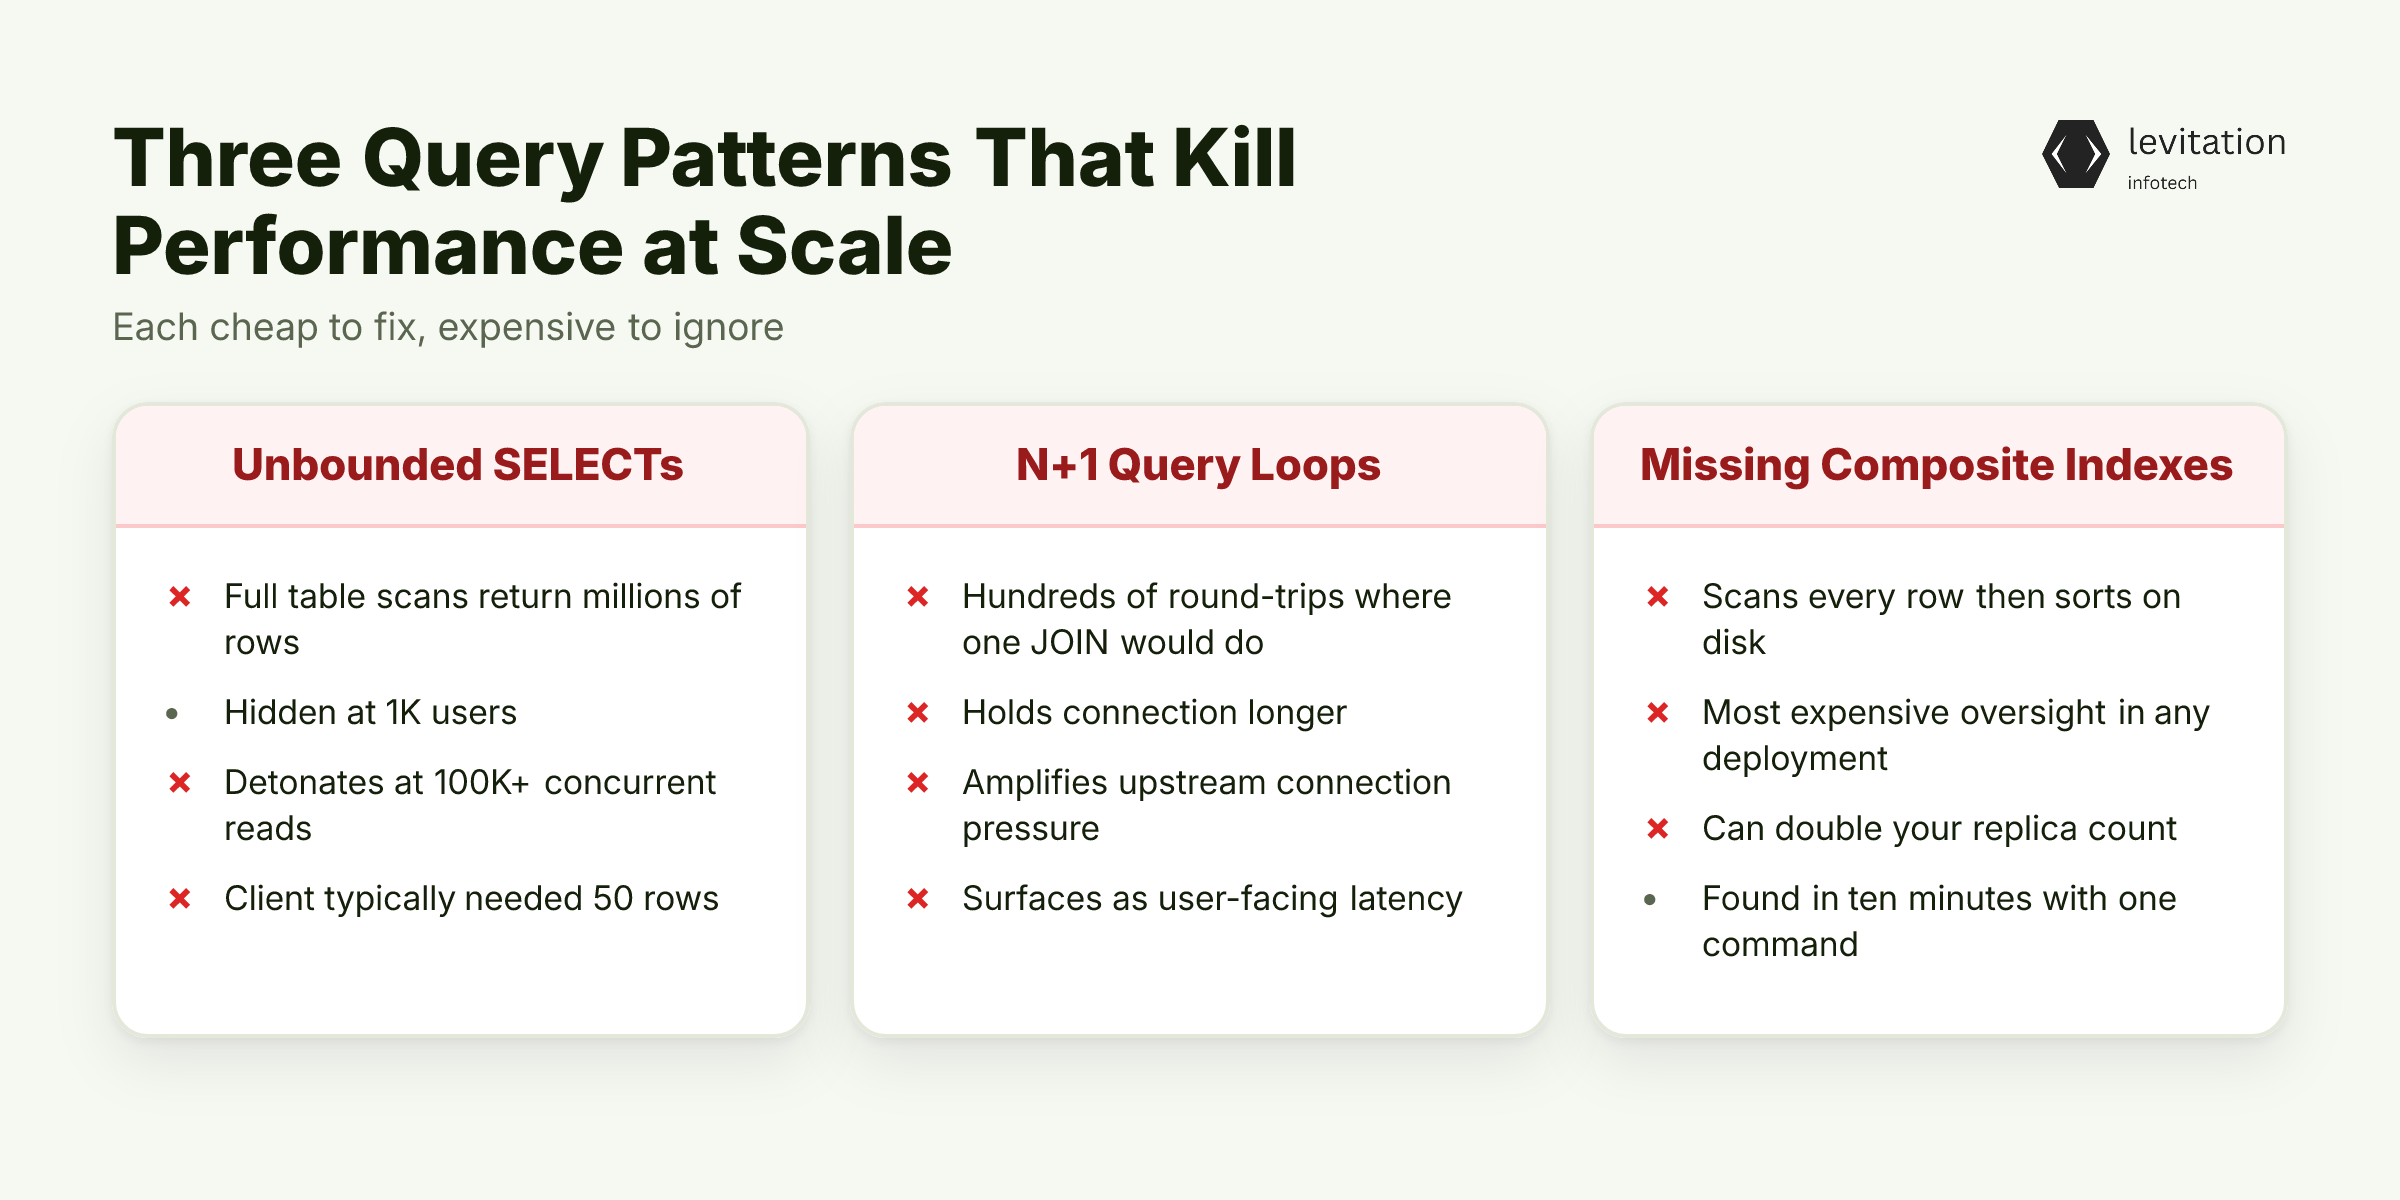
Pattern one: unbounded SELECTs without WHERE clauses or pagination. Full table scans that return millions of rows when the client needed 50. This pattern doesn't appear at 1,000 users. It detonates at 100,000+ concurrent reads because every concurrent request is reading the same millions of rows.
Pattern two: N+1 query loops from ORM code. Hundreds of round-trips where one JOIN would do. Each round-trip adds latency, holds a connection longer, and amplifies connection pressure upstream. The 800M-user stack catches this early. The 10M-user stack catches it when latency finally surfaces as a user-facing complaint.
Pattern three: missing composite indexes on multi-column WHERE and ORDER BY combinations. The single most expensive oversight in any PostgreSQL deployment. A `SELECT ... WHERE user_id = ? AND created_at > ? ORDER BY created_at DESC` without a matching index scans every row for that user, then sorts them on disk. We see this pattern repeated across most database design anti-patterns in the wild.
Each pattern is cheap to fix and expensive to ignore. A single missing index can double your replica count. That's not hyperbole. An unindexed scan forces the database to read millions of rows, which forces the replica to cache them, which forces you to provision more memory, which forces you to add a second replica to handle the query load the first one can no longer absorb.
Finding them takes one command and ten minutes. If you know what to look for.
Diagnosing the Real Problem with EXPLAIN ANALYZE
Run EXPLAIN ANALYZE on your top-10 slowest queries. The output is unambiguous. You don't need a database admin to read it. You need a checklist.
1EXPLAIN ANALYZE2SELECT m.*, u.name3FROM messages m4JOIN users u ON m.user_id = u.id5WHERE m.created_at > '2026-01-01'6ORDER BY m.created_at DESC7LIMIT 100;
Three things to look for: - `Seq Scan` on a table with more than 100,000 rows. You need an index. Full stop. Sequential scans on large tables are the root cause of most "PostgreSQL is slow" tickets. - `rows removed by filter` with a high ratio. Your index doesn't match the query predicate. The index exists, but it's on the wrong column or in the wrong order. This is a column-ordering problem, not a missing-index problem. - `Sort` with an external merge disk method. Your `work_mem` is too low, or your index is missing. The query is spilling to disk because it has no index to walk in sorted order.
For the query above, you need a composite index. Whether it should be `(user_id, created_at)` or `(created_at, user_id)` depends on selectivity, which column filters out more rows. Run both, measure, pick the winner. A common mistake is indexing only `user_id` and expecting the sort to use an existing index on `created_at`. It won't, because PostgreSQL can't combine two single-column indexes for a single multi-column filter.
Before adding any hardware, spend one engineer-week running EXPLAIN ANALYZE across production query logs. Most teams find that the slowest queries dominate database load, the same Pareto pattern we see in incident postmortems across infrastructure work.
Once the queries are clean, the connection overhead becomes the next bottleneck. And that's a one-day fix.
PgBouncer and the Connection Math That Cuts Your Bill
PgBouncer sits between your app instances and PostgreSQL. It multiplexes thousands of client connections into a small pool of real backend connections. The setup is measured in hours, not weeks.
1[databases]2mydb = host=127.0.0.1 port=5432 dbname=mydb34[pgbouncer]5listen_addr = 0.0.0.06listen_port = 64327auth_type = md58auth_file = /etc/pgbouncer/userlist.txt910default_pool_size = 2011max_client_conn = 1000012pool_mode = transaction
Three settings matter most. `max_client_conn = 10000` lets your app open as many connections as it wants. PgBouncer handles them. `default_pool_size = 20` controls how many real backend connections PgBouncer opens against PostgreSQL. `pool_mode = transaction` is the right default for most workloads. Use `session` mode only when you need prepared statements or LISTEN/NOTIFY.
A common starting point for `default_pool_size`: `(CPU cores × 2) + effective_spindle_count`. For a 16-core instance with SSD storage, that lands around 35-50. Rarely more than 100-200 server connections, even at scale.
The result: PostgreSQL memory usage drops from roughly 100GB of connection overhead to a figure determined by your pool size, since only the pooled backend connections consume the per-connection memory. That alone lets you drop an instance class or remove a replica. Connection pooling reduces the database line item by collapsing the largest cost driver before any other optimization. The same cost-collapse pattern shows up in over-replicated Kafka clusters - the wrong scaling choice compounds, then the right one resolves it.
The compound effect of query optimization plus connection pooling is what separates a 10M-user bill from an 800M-user one.
What a Lean PostgreSQL Stack Looks Like at Scale
The outcome isn't subtle. Fewer replicas. Smaller instance classes. Lower egress. An engineering team that ships features instead of running migrations.
The cost shape tells the story. The same engine handles both configurations; only the operational discipline differs. Excessive connections inflate instance memory, missing indexes force replica additions, and unoptimized queries multiply compute costs. The tuned stack wastes nothing; the unoptimized stack pays for memory and replicas the workload never needs.
The deeper measure is longevity. Systems still running in production five years after deployment show engineering quality. They aren't migrations deferred. They're platforms that absorbed growth without re-architecture. That's the real measure of database health: not peak QPS, but how many years the same schema survives traffic, feature changes, and team turnover.
PostgreSQL's ceiling is much higher than vendor marketing suggests. The floor is lower than most teams' configurations allow. The gap between the two is where your database budget goes.
For teams running production systems where uptime and cost discipline matter, the answer is rarely a new database. Levitation's work on production-grade data infrastructure reflects the same philosophy: stay on proven engines, tune them well, avoid migrations you don't need.
Frequently Asked Questions
Can PostgreSQL actually handle 800 million users?
Yes. OpenAI runs PostgreSQL at 800M users, and the techniques that make it work - connection pooling, query optimization, read replicas, and partitioning - are not exotic. They are standard patterns applied with discipline rather than abandoned at the first sign of latency.
How much does a PostgreSQL stack cost at 10 million users?
On managed cloud platforms, configuration rather than database choice drives the cost difference. A well-tuned 10M-user PostgreSQL stack avoids excess instance memory, unnecessary replicas, and wasted compute. The unoptimized version pays for all three, often at multiples of what the workload actually requires.
When should I actually migrate away from PostgreSQL?
Rarely for scale reasons alone. Valid migration triggers include multi-region active-active writes that PostgreSQL cannot handle natively, or document-model workloads with no relational queries. Latency, cost, and connection errors at 10M users are almost always solvable in PostgreSQL before migration becomes necessary.
What is the single biggest PostgreSQL cost mistake?
Failing to deploy a connection pooler. Every PostgreSQL connection consumes roughly 10MB of memory, so 10,000 connections cost 100GB of RAM before any query executes. PgBouncer collapses those 10,000 client connections into a pool of 100-200 server connections, often reducing the database bill by collapsing the largest cost driver, with a one-day setup.
How do I know if my slow queries are a configuration problem or a schema problem?
Run EXPLAIN ANALYZE on your slowest queries. A `Seq Scan` on a large table indicates a missing index, a schema problem. A `rows removed by filter` with a high ratio indicates a mismatch between your index columns and query predicates, also fixable in the schema. A `Sort` node with external disk merge indicates insufficient `work_mem`, a configuration problem. All three are diagnosable in under ten minutes per query.
About the author
Mayank Singh is a software developer at Levitation Infotech, where he builds web and AI-powered applications across the company’s fintech, healthcare, and enterprise projects.