


TL;DR: AI cost forecasts that work at 100K daily inferences collapse at 10M. Three forces warp the cost curve in opposite directions: falling per-token rates, rising per-query compute from reasoning models, and compounding hidden costs. The fix is a per-request attribution pipeline feeding a time-series model, not a quantity-times-rate spreadsheet.
Key Takeaways: - At 10M daily inferences, a 30% efficiency gain is worth about $22M a year, a margin that changes board-level decisions. - Linear quantity-times-rate forecasts fail because per-request rates swing 10x between a short prompt and a deep-reasoning query. - Attributed cost-per-request data behaves as a clean weekly time series, which makes SARIMAX or Prophet the right forecast model.
The $70 Million Threshold Where Forecasts Collapse
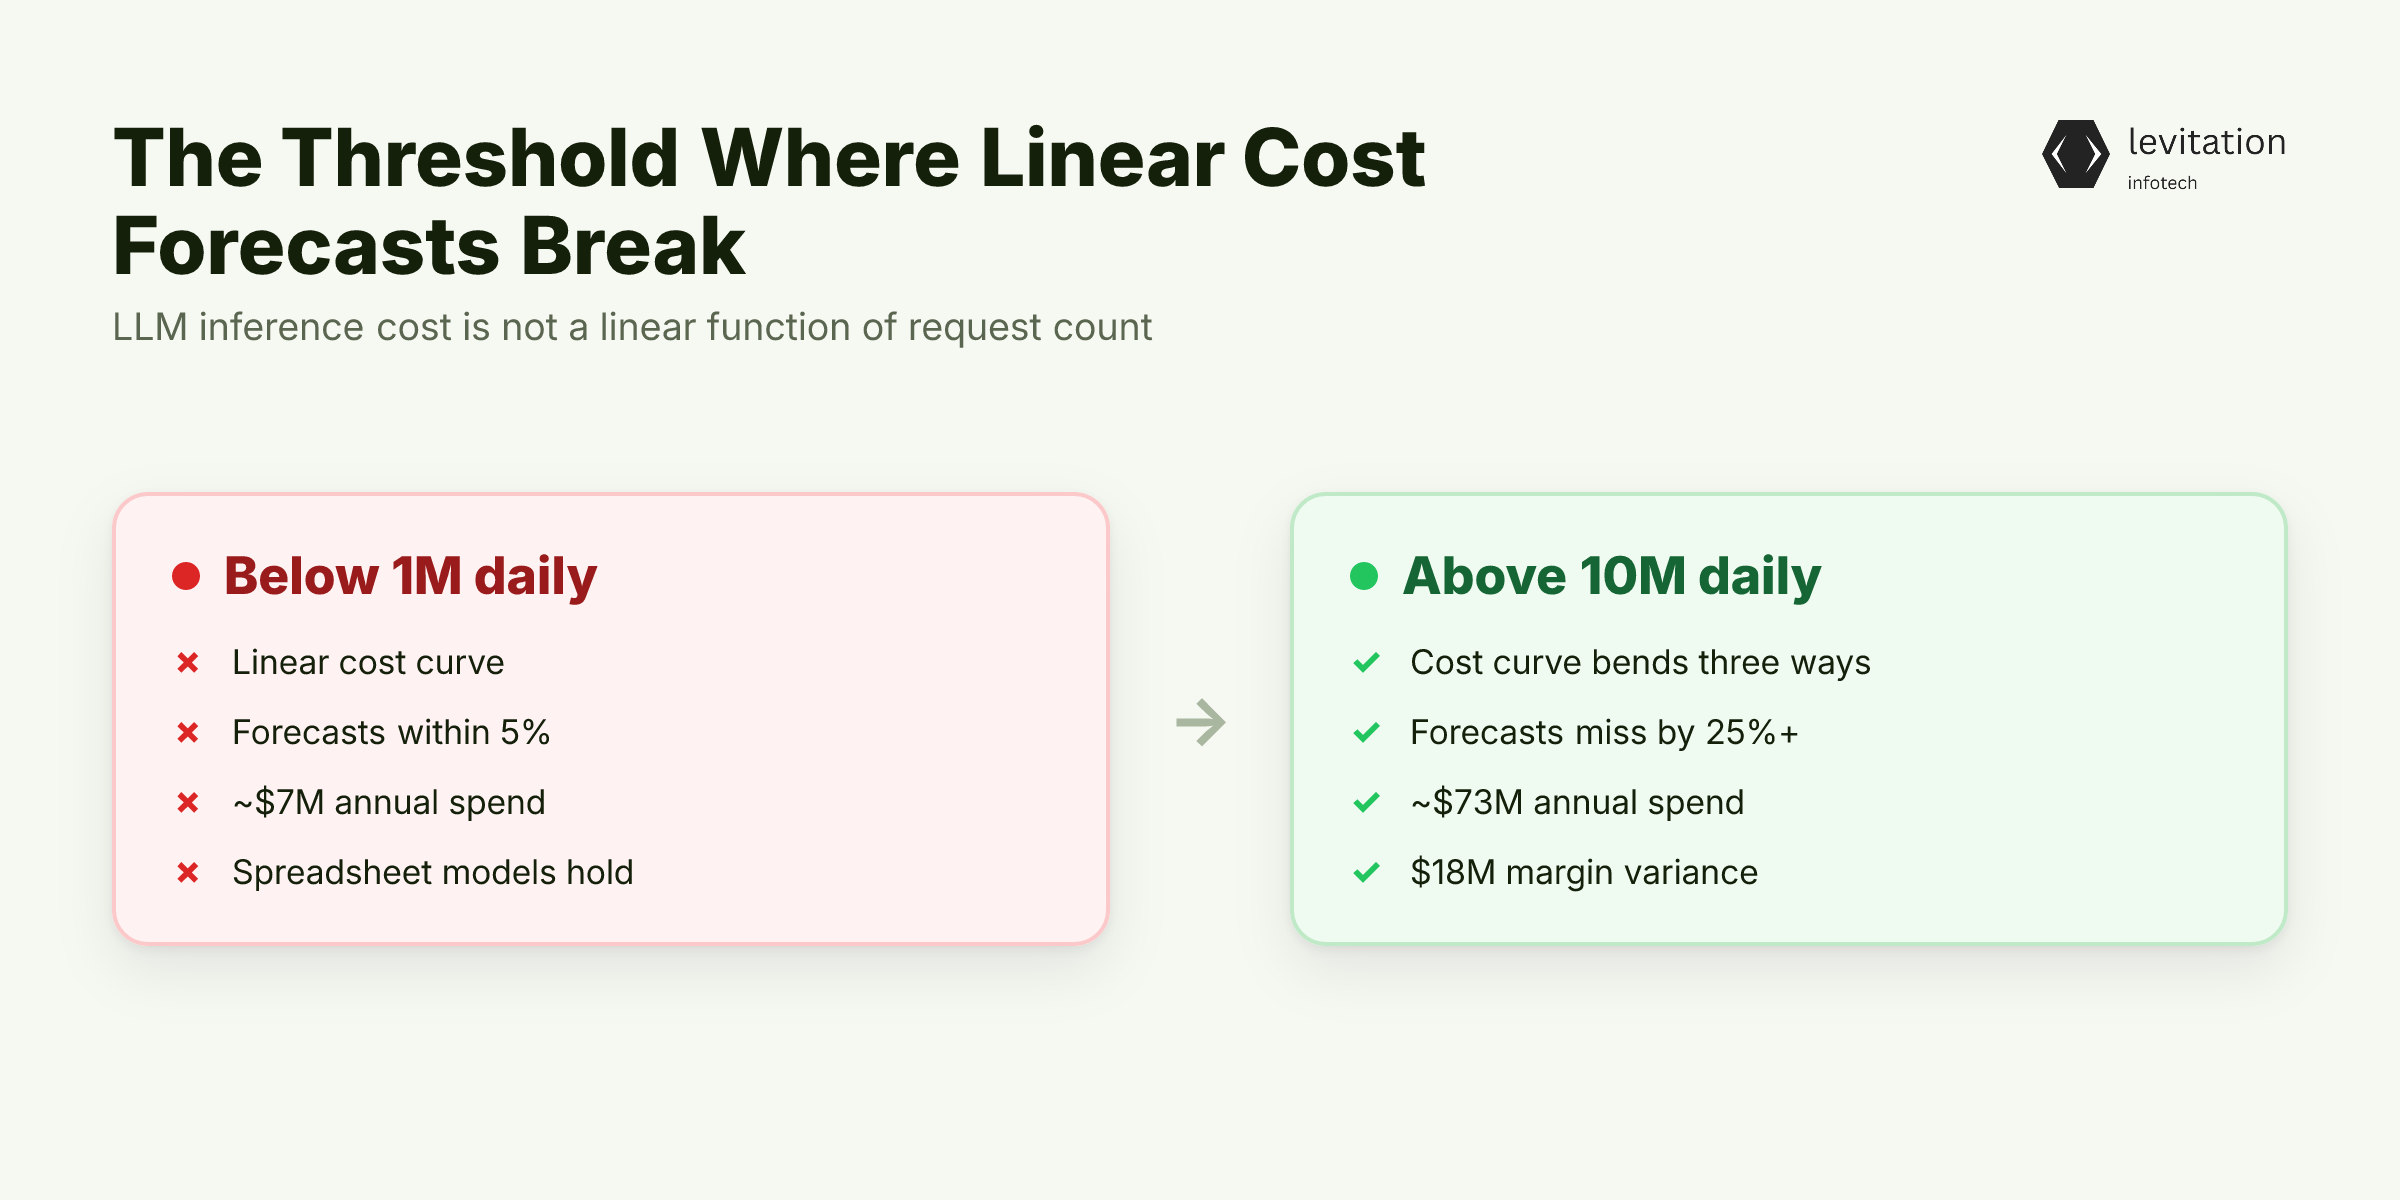
Your cost forecast held at 100,000 daily inferences. At 10 million, it broke. The math explains why.
10M inferences at $0.02 each is over $73M a year. A 30% efficiency gain saves about $22M. A model that was within 5% at 1M daily routinely misses by 25% or more at 10M.
The dollar figure gets the attention. The real damage is the second-order effect. A 25% miss on $73M is about $18M in variance. That is large enough to wipe out a product line's gross margin. Boards notice. CFOs freeze hiring.
Then the engineering team gets blamed for a forecast that was structurally incapable of surviving the threshold. The core problem is that LLM inference cost is not a linear function of request count. Below 1M daily inferences, it looks linear, and your spreadsheet lies convincingly. Above 10M, the curve bends.
The AI infrastructure scaling problem stops being about adding GPUs. It starts being about how the unit economics of every request interact with the billing model. The cost curve warps in three directions at once, and almost no forecast model accounts for all of them.
Three Forces That Warp the Cost Curve at Scale
Three forces pull the cost curve in opposite directions at the 10M threshold. A forecast that ignores any one of them will miss.
Force 1: Per-token costs fall while per-query compute rises. GPU efficiency keeps improving, and per-token rates drop. But reasoning models can consume an order of magnitude more tokens per query than a short completion. In deep-reasoning cases, a single response can burn through what used to be a hundred turns' worth of tokens. The two trends cancel each other in the aggregate, and the inference workloads spreadsheet shows the wrong slope.
Force 2: GPU contention and KV cache eviction inflate tail latency. At scale, requests queue on shared GPUs. When KV cache behavior evicts mid-sequence, the model regenerates tokens, and you pay twice. Tail latency balloons, retries climb, and the cost of "one request" quietly doubles.
Force 3: Hidden costs compound non-linearly. Retries, embedding lookups, RAG pipelines running before each generation, and multi-model orchestration don't show up in the GPU line item. Below 1M daily inferences they are rounding errors. Above 10M, they are a second cloud bill hiding inside the first. The same pattern that makes multi-agent LLM architectures cost 4x more than modeled.
The combined effect is a cost curve that bends in two directions at once and accelerates in the middle. Most teams forecast only the first derivative (cost per request) and miss the second (variance per request class).
It looks like a capacity problem. It isn't. The unit economics flip at a specific point on the cost curve, and that is where the spreadsheet goes blind.
The Unit Economics Inflection Point
At low volume, an AI product looks profitable. The cloud bill is a rounding error against revenue. At 10M daily inferences, the bill rewrites the P&L.
The reason is structural. Usage scales like software, with cheap marginal cost. Infrastructure scales like a data center, with expensive marginal cost. Those two curves cross somewhere around the 10M daily mark. The product flips from "profitable on paper" to "losing money on every request" without anyone changing a line of code.
McKinsey forecasts $6.7T in global data center investment by 2030, with $5.2T tied to AI workloads. Gartner projects $2.5T in AI spending by 2026. These numbers confirm what your CFO already suspects: AI cost is now a board-level line item, not an engineering curiosity.
GPU provisioning decisions and AI cost optimization strategy now sit on the same slide as revenue and headcount. The inflection point is invisible in spreadsheets because spreadsheets average across request types.
A blended "cost per request" hides the fact that reasoning traffic costs an order of magnitude more than a completion. A small share of heavy queries can drive most of the bill. Finance sees one number. Engineering knows the distribution is bimodal.
The disagreement is not a data problem. It is a modeling problem. Teams that have tracked LLM costs from 100K to 100M tokens have seen this curve in the wild.
If the unit economics are the real problem, the spreadsheet model most teams still use to forecast AI spend was designed for the wrong question. Here is where it breaks.
Why the Quantity × Rate Spreadsheet Model Fails
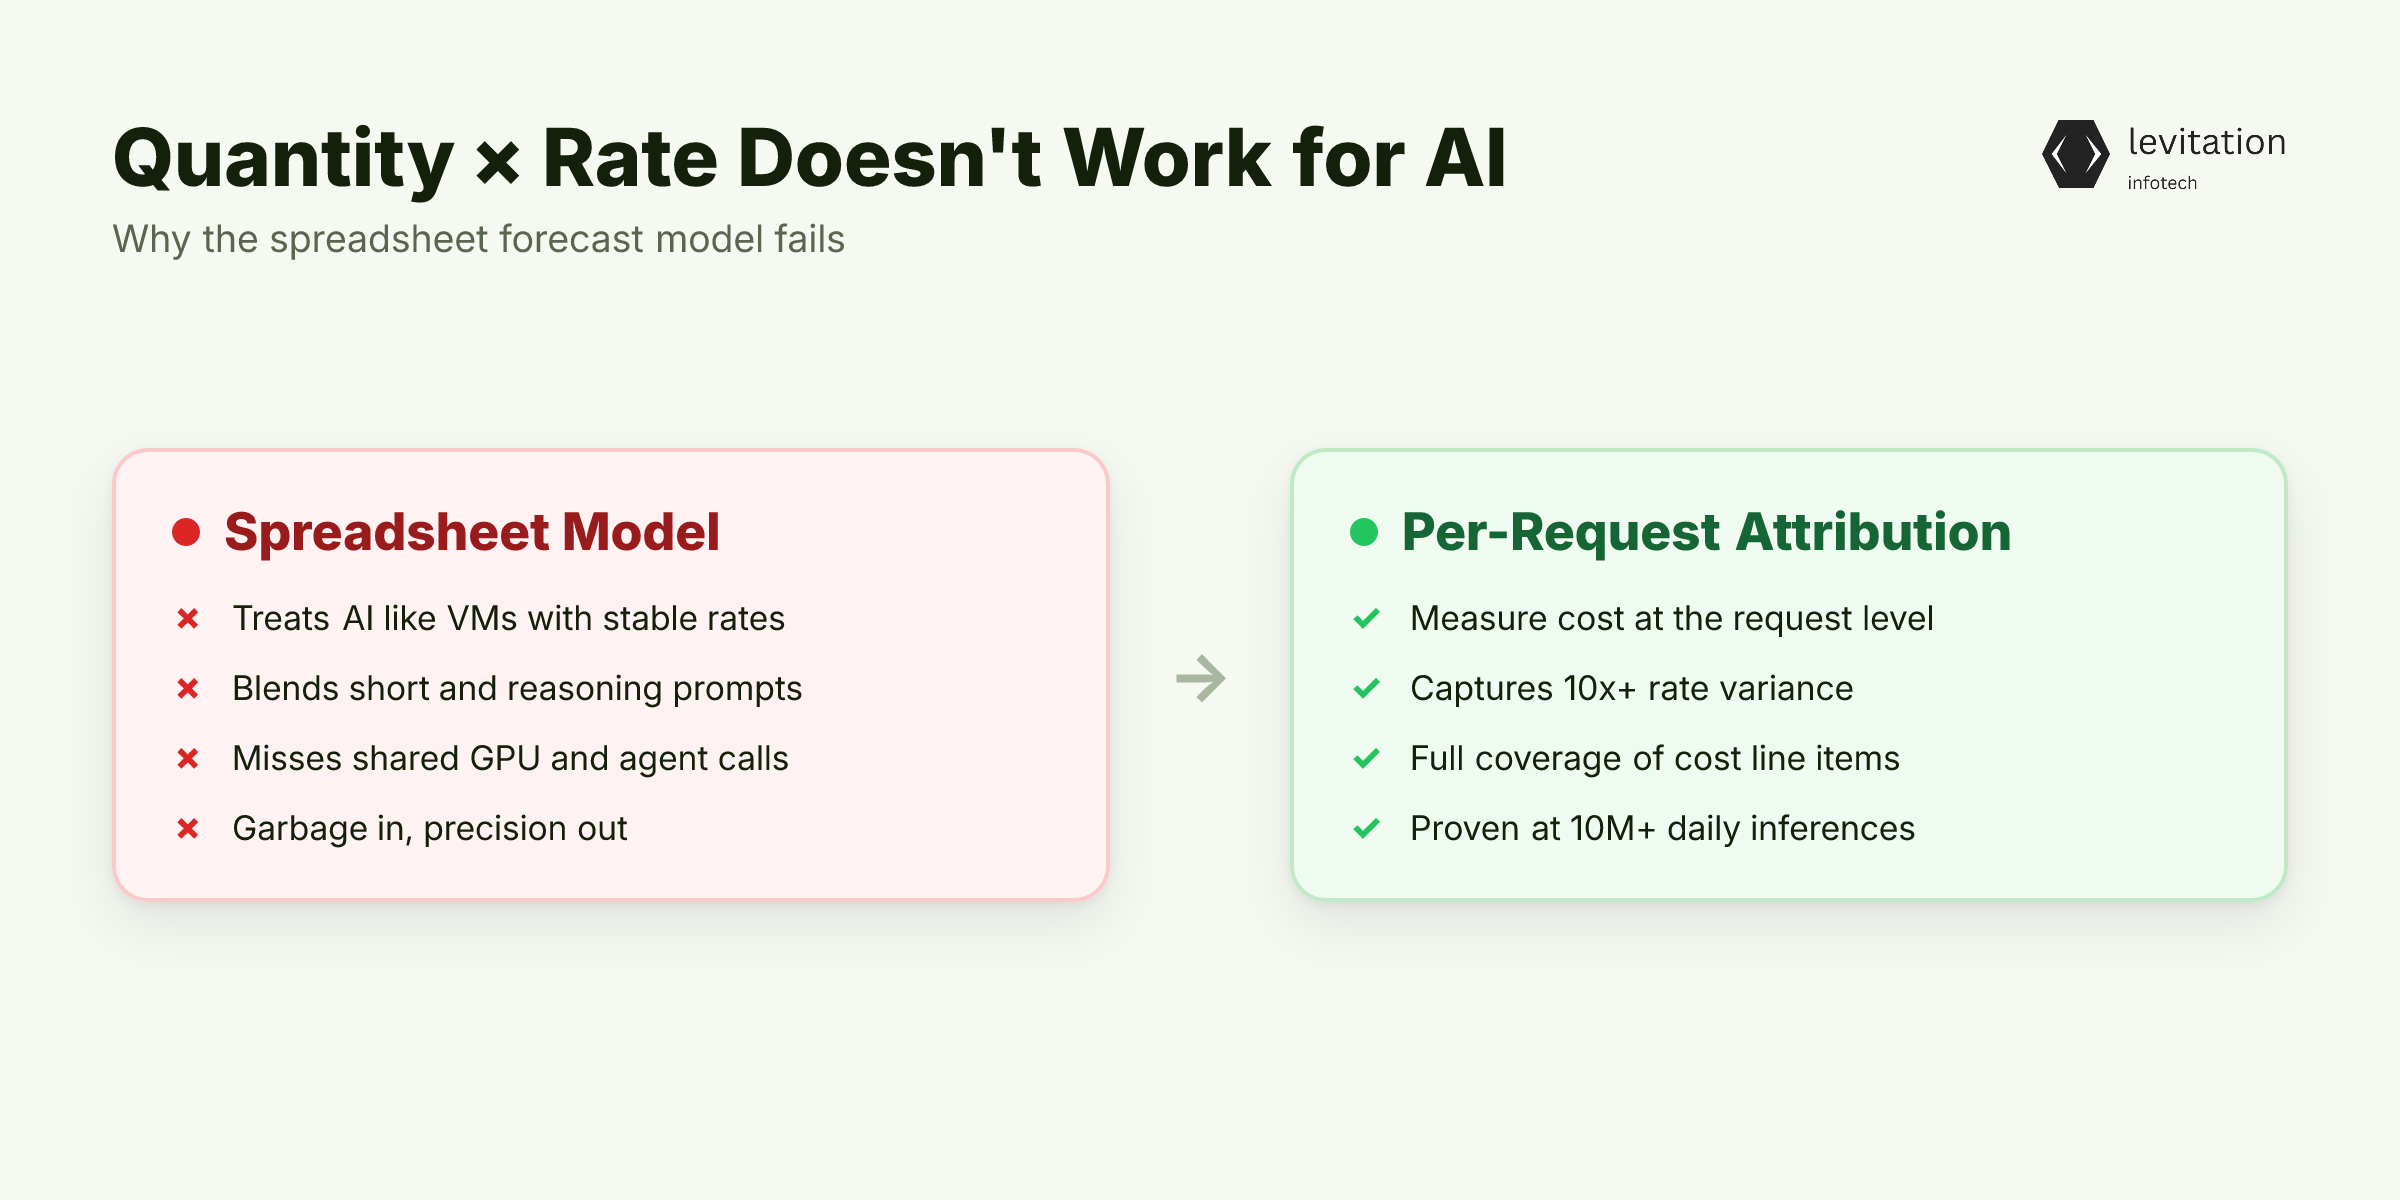
The FinOps quantity-times-rate approach is the industry default: forecast request volume, multiply by an average rate, project the total. It works for VMs. It fails for AI.
The first failure is that "rate" is not stable. Per-request rates swing 10x or more between a short prompt and a deep-reasoning query. A blended average is a fiction that gets more fictional as reasoning traffic grows. Forecasting on it is like forecasting cloud spend using the average instance price across every SKU in the catalog.
The second failure is that the rate itself is wrong. Without per-request attribution, shared GPU pools, agent-to-agent calls, and embedding API charges don't appear in the line items your forecast reads. That means the input to the spreadsheet is already a guess. The model is fed garbage and produces precision-shaped garbage.
This is why transformer inference costs, embedding costs, and neural network serving overhead have to be measured at the request level. Not summed from infrastructure tags. Until attribution is per-request, every forecast is built on shifting sand.
The math is broken. Here is the framework that replaces it, one that has held up inside production systems running at 10M+ daily inferences.
Rebuilding the Forecast Around Cost-Per-Request
Replace the spreadsheet with a five-step attribution pipeline. Each step has a measurable output and a clear owner.
Step 1: Emit attributed per-request cost from an AI gateway. Every inference leaves the gateway with a cost tag attached: GPU seconds, token counts, embedding calls, retrieval operations. The gateway is the only place that sees all of it.
Step 2: Segment traffic by request class. Short completions, reasoning chains, and RAG retrievals are not the same cost object. Blended averages hide the variance. The forecast must model each class separately and sum at the end. The model training pipelines and fine-tuning cost decisions your team made six months ago show up in those numbers.
Step 3: Apply time-series models to the attributed stream. Attributed per-request cost data behaves as a clean weekly time series. Use SARIMAX when you have causal drivers (headcount, agent count, user growth) and want model-based intervals. Use Prophet for a fast, robust baseline. The attention and KV cache tuning work that cut your tail latency will show up as a step-change in the time series. Not a smoothed average.
Step 4: Backtest monthly against actuals. Target a single-digit percentage margin of error against actuals each month. If you miss, the model is wrong, or the attribution is. Both are fixable. A forecast that doesn't beat last quarter's number is not a forecast; it's a guess.
Step 5: Instrument the forecasting system itself. Its own compute cost is attributed on the same dashboard. No blind spots, no separate cost center hiding the cost of watching costs.
The FinOps tools most teams already own cannot do this work; they count VMs, not AI workloads.
Once a forecast holds within tight tolerance at the 10M threshold, the conversation inside the company changes. Here is what that looks like in practice.
What Changes When the Forecast Stops Lying
The first change is political. Finance and engineering finally agree on a number because the number is built from attributed data neither side can dispute. Capacity planning, pricing decisions, and product roadmap trade-offs stop being arguments and start being arithmetic.
The second change is financial. A 30% efficiency gain on a $73M annual inference bill is $22M. That is enough to fund the next model upgrade outright, hire a full platform team, or absorb a pricing cut. Efficiency moves from "nice to have" to "the lever that funds the next quarter."
The third change is temporal. The forecast becomes a leading indicator instead of a postmortem. Anomalies surface in the weekly time series weeks before they hit the invoice. The team that used to react to a bad AWS bill now sees the spike forming and intervenes in the LLM deployment layer before it lands.
These are not theoretical wins. They are the reason enterprise AI infrastructure programs that survive board scrutiny tend to share a few traits. Those traits: attribution-first cost models, per-request forecasting discipline, and optimization loops that feed back into the forecast. The unit-economics framing is what survives contact with the CFO.
Levitation applies the same discipline in production: attribution first, forecast second, optimization third.
Frequently Asked Questions
What is AI cost forecasting and why does it matter at scale?
AI cost forecasting projects spend on model inference, GPU compute, and supporting infrastructure before the bill arrives. It matters at scale because a 25% forecast miss on $70M+ in annual inference spend is about $18M in variance. That is large enough to erase an entire product line's margin.
Why do AI cost forecasts break at 10 million daily inferences?
Three forces warp the cost curve in opposite directions: falling per-token costs, rising per-query compute from reasoning models, and compounding hidden costs from retries, embeddings, and orchestration. A linear forecast built at 1M daily inferences cannot extrapolate through that inflection point.
How accurate should an AI cost forecast be?
Tight monthly accuracy, a single-digit percentage margin of error against actuals, is the standard target. Forecast misses at scale almost always trace back to teams forecasting on GPU hours instead of attributed cost-per-request.
How is LLM inference cost different from training cost?
Training cost is a one-time, batch-oriented expense tied to dataset size, epochs, and GPU hours. LLM inference cost is recurring, request-driven, and varies by prompt length, model class, and retrieval overhead. At 10M daily inferences, inference dominates total cost of ownership by an order of magnitude.
What is the best model for forecasting AI infrastructure costs?
Attributed per-request cost data behaves as a clean weekly time series. SARIMAX works well when you have causal drivers like user count or agent count. Prophet works well when you need a fast, robust baseline. The forecasting model matters far less than the quality of the cost attribution feeding it.
About the author
Mayank Singh is a software developer at Levitation Infotech, where he builds web and AI-powered applications across the company’s fintech, healthcare, and enterprise projects.