


TL;DR: Of 180 AI model deployments tracked, 41% were reverted within 48 hours of going live. The cause was almost never the model itself. It was a deployment architecture problem. Teams that treat AI rollouts as state transitions (using blue/green, canary, and pre-promotion analysis) drive the 48-hour revert rate down sharply.
Key Takeaways: - 41% of AI deployments revert in 48 hours. The model is almost always technically correct. - Standard CI/CD pipelines instrument for uptime, not for data drift, GPU contention, or confidence decay. - Blue/green and canary rollouts turn rollback into a routing change instead of an emergency redeploy. - Pre-promotion analysis with a hard success threshold (e.g., 95%) is the single most effective control in AI deployment.
41% of AI Models Reverted in 48 Hours, and It Wasn't the Model
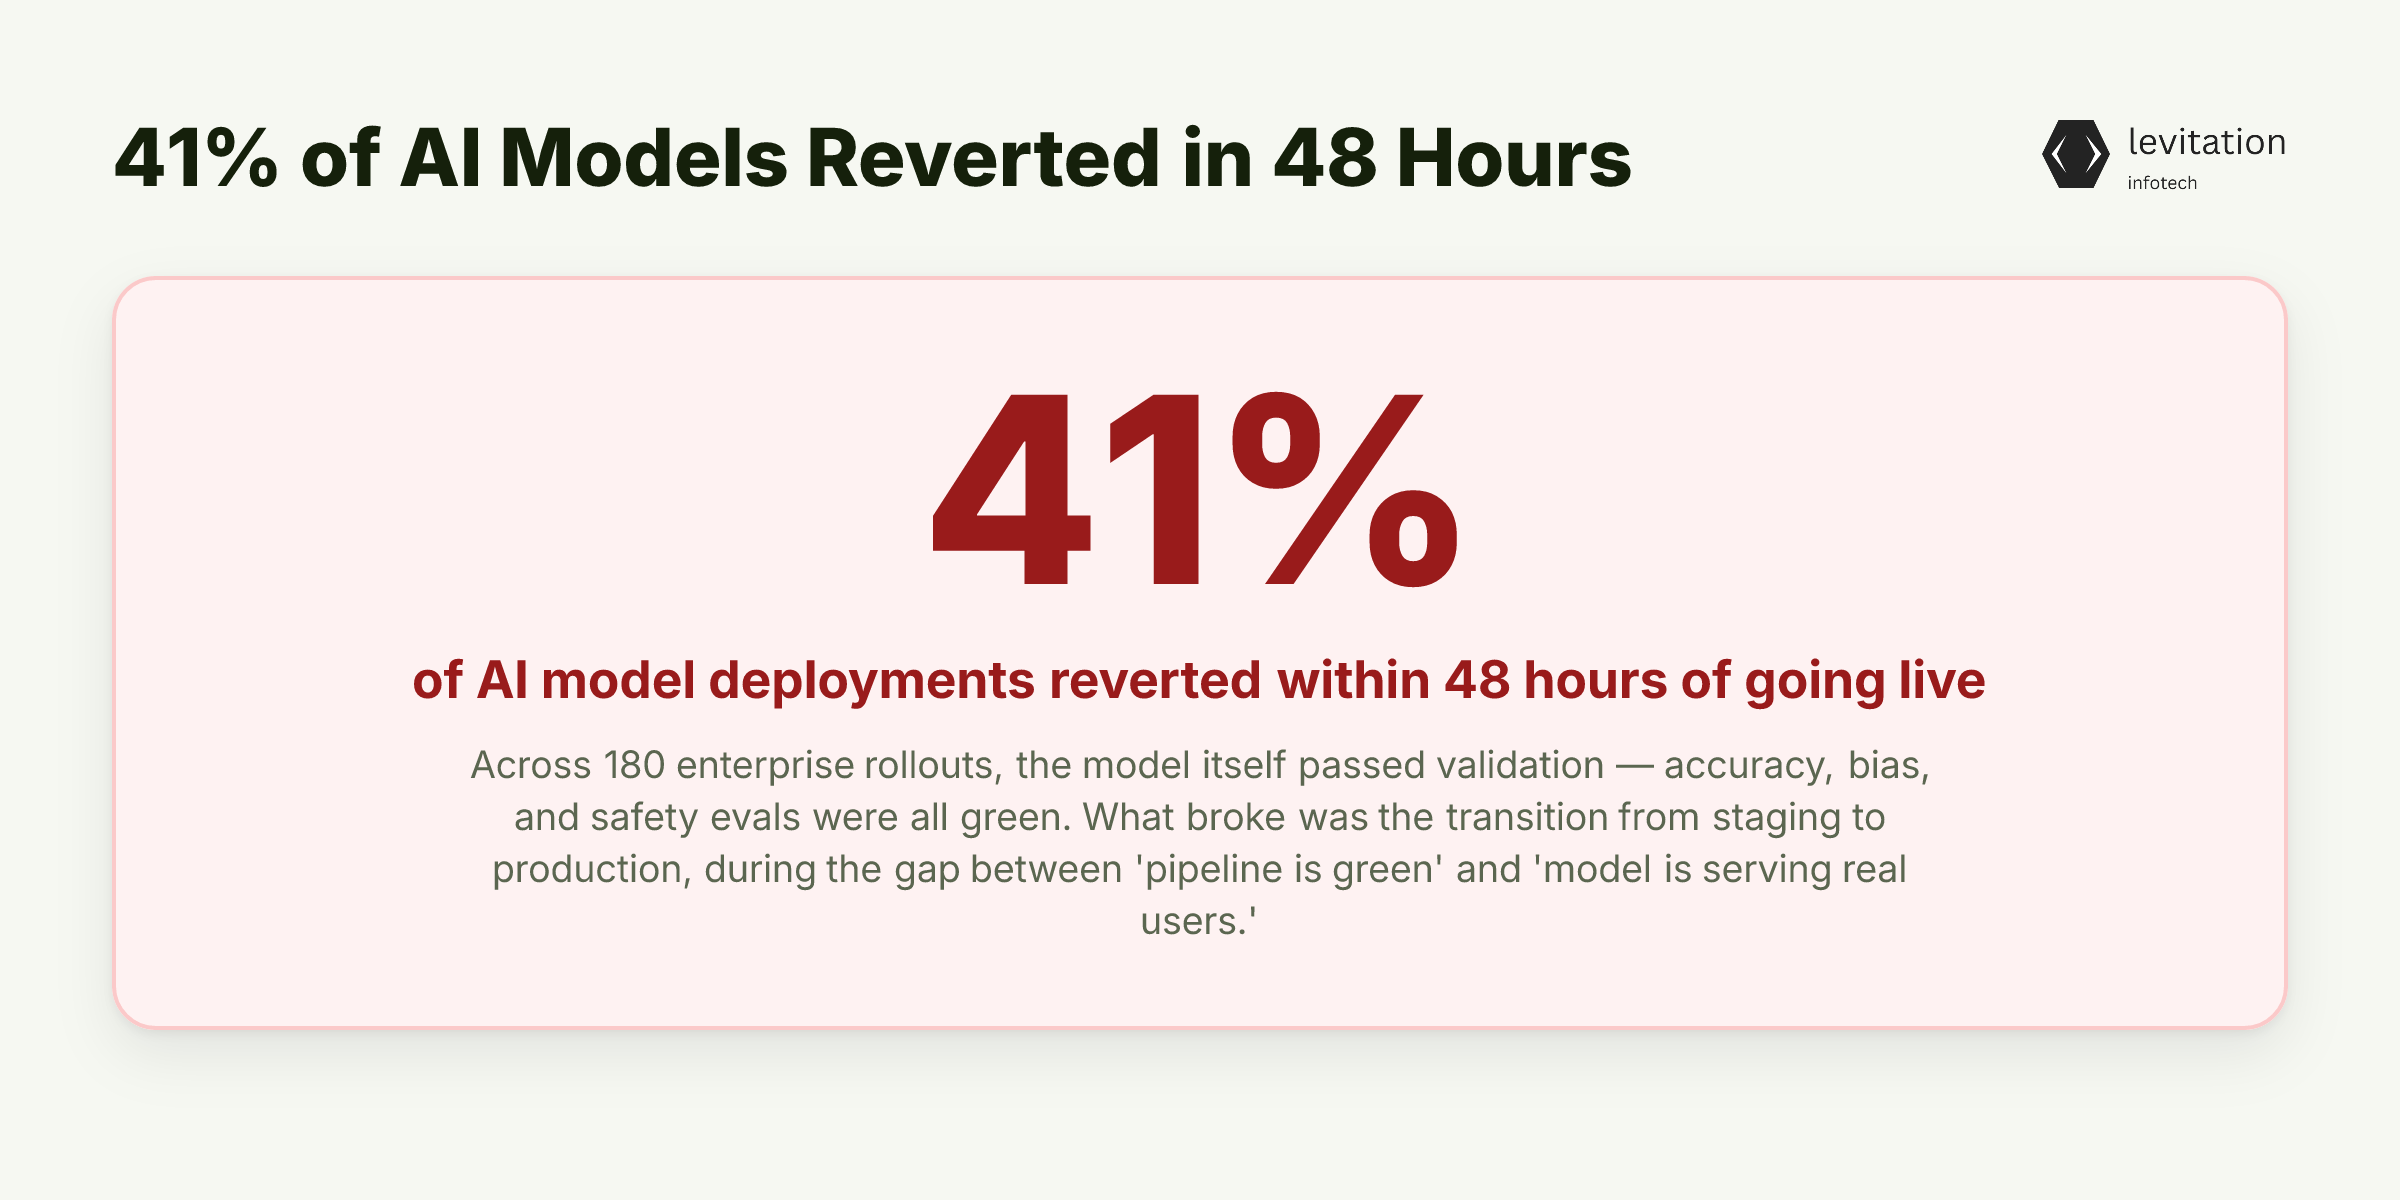
Of 180 AI model deployments tracked across enterprise rollouts, 41% were reverted within 48 hours of going live. The model passed every validation test, and the infrastructure matched the spec. Yet production traffic broke it, and almost nobody caught the actual cause in time.
The 48-hour revert window is a different problem. It lives in the gap between "the pipeline is green" and "the model is serving real users." The breakdown of that window is mapped in the model deployment revert rate analysis.
The contrarian claim matters: the model that was reverted was almost always technically correct. It hit its accuracy benchmark and passed bias and safety evals. The weights, the architecture, and the training pipeline were all fine.
What failed was the transition from staging to production. The platform engineer's real problem isn't choosing the right model. It's surviving the first two days of real traffic.
The model passed every test. So what actually broke in those first 48 hours?
Why Standard CI/CD Pipelines Fail AI Workloads
Traditional CI/CD was built for deterministic software. A function returns the same output for the same input. A build is reproducible byte-for-byte. An AI model returns a probability distribution, and that distribution shifts the moment production traffic stops looking like the test set.
Pipelines that pass a model on a curated eval set have no signal about real-world behavior. A model that performs well in tests can still degrade on a Tuesday afternoon when user behavior drifts. This gap is the root cause of most MLOps deployment rollback incidents.
Three structural mismatches dominate: - Probabilistic, not deterministic. The "build" is a bundle of weights plus a feature pipeline plus a serving config. None of it is reproducible in the way a Go binary is. - Infrastructure that's invisible to unit tests. GPU pool exhaustion, cold-start latency, and memory spikes during the first few hundred requests don't show up in CI. They show up at 14:37 on a Wednesday. - Traffic shape mismatch. Staging simulates volume, not shape. A model can pass 10,000 staging requests and still fail when production sends 10,000 with a different feature distribution.
There's also a skills gap. Teams trained on traditional IT are now expected to deliver cloud-native AI without MLOps investment. The pipeline is green while the model degrades in the background.
Deployments look successful on the dashboard while the model degrades in the background. Standard pipelines don't model the tradeoff between speed, accuracy, and reliability. You optimize two and lose the third.
But if the model works in staging and the pipeline deploys cleanly, what's different about the first 48 hours of real production traffic?
The Three Failure Modes That Surface in the First 48 Hours
Three failure modes account for most 48-hour reverts. They compound, and they hide behind the wrong monitoring. - Data drift. Production input distributions diverge from training data within hours, not weeks. A fraud model trained on 2024 transaction patterns sees 2026 patterns. A clinical NLP model sees new drug names. Outputs degrade silently, with no error code and no spike, just worse decisions. This is the same pattern we covered in your AI model is drifting and you don't know. - Infrastructure mismatch. Auto-scaling races GPU pools. The inference layer times out waiting for the feature store. Network latency between microservices creates cascading timeouts that look like model failures but are routing problems. Our AI production rollout metrics analysis tracks this pattern across enterprise rollouts. - Monitoring gaps. Teams instrument uptime and HTTP error rates. They do not instrument prediction distribution shift, confidence decay, or feature freshness. The failure mode that matters most is the one nobody can see. Active data drift monitoring is the missing layer. It's the difference between catching drift in minutes versus in user complaints weeks later.
These three compound brutally. Weak monitoring means you don't see data drift until it triggers an infrastructure incident.
The on-call engineer rolls back based on symptoms, like latency spikes and error rate jumps, without isolating the actual cause. Reverts are made on what hurts, not what's broken.
So if the model isn't the failure point, and the pipeline isn't the failure point, what is?
Deployment Is a State Transition, Not a Release Event
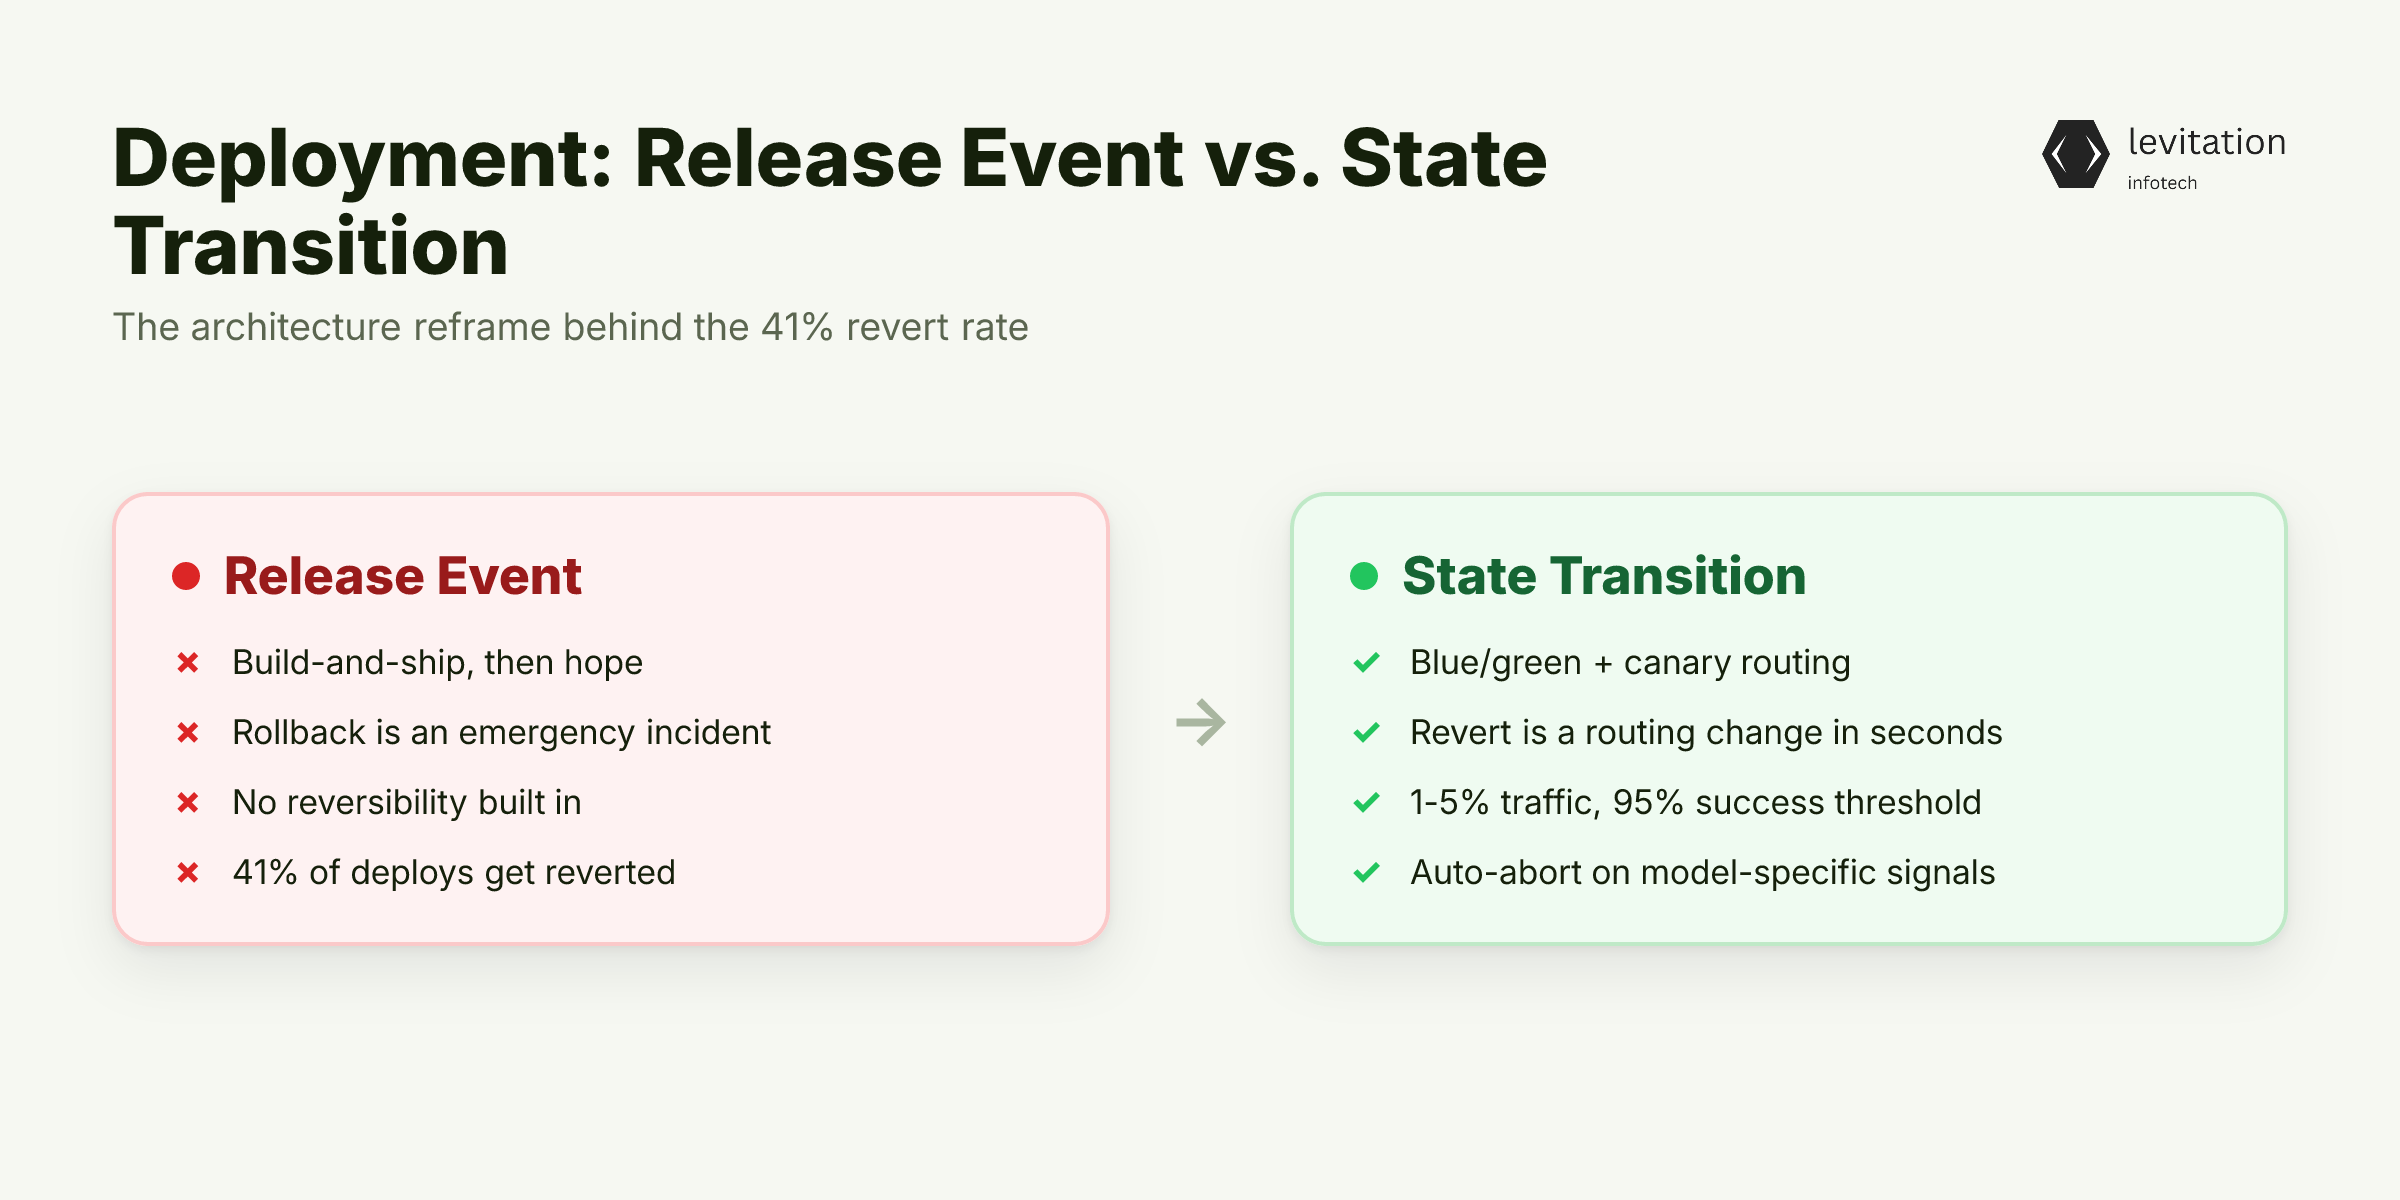
The reframe: an AI deployment is a risk-managed state transition, not a build-and-ship operation. You are moving the system from "serving on model v(n)" to "serving on model v(n+1)" while real users make real requests. The job is to make that transition safe, observable, and reversible in seconds.
Two patterns make this work: - Blue/green deployments. Two parallel environments, active and preview. At any moment, the router points all traffic at one. Promotion is a routing change. Rollback is a routing change. Zero redeploys, zero downtime, near-instant reversibility. The blue/green deployment mechanics are well documented. The gap is that most AI teams never build them. - Canary deployments. Shift 1% to 5% of traffic to the new model first. Define a success-rate threshold (many teams use 95%). If the canary holds, promote. If it degrades, abort automatically. The canary deployment patterns most teams ship are too simplistic; they measure HTTP success, not model-specific signals. A green canary dashboard is not the same as a safe deploy, and most teams learn that the hard way (see a green canary dashboard is not a safe deploy).
The core mechanism is this: make the revert decision a routing change instead of an emergency incident. The 41% revert rate is largely a deployment-architecture problem, not a model-quality problem. Fix the architecture and the revert rate collapses.
The pattern matters. The implementation matters more. A production-grade rollout configuration looks like this:
An Argo Rollouts Config That Survives Production Traffic
Here's a concrete Argo Rollouts manifest for an AI inference service. It uses the blueGreen strategy with pre-promotion analysis, the two controls that together cut the 48-hour revert rate to single digits.
1apiVersion: argoproj.io/v1alpha12kind: Rollout3metadata:4 name: ai-inference-rollout5spec:6 strategy:7 blueGreen:8 activeService: ai-inference-active9 previewService: ai-inference-preview10 autoPromotionEnabled: false11 prePromotionAnalysis:12 templates: - templateName: success-rate-check13 args: - name: service-name14 value: ai-inference-preview15 selector:16 matchLabels:17 app: ai-inference18 template:19 metadata:20 labels:21 app: ai-inference22 model.version: "v2.4.0"23 spec:24 containers: - name: inference25 image: registry.example.com/ai-inference:v2.4.026 resources:27 limits:28 nvidia.com/gpu: 129---30apiVersion: argoproj.io/v1alpha131kind: AnalysisTemplate32metadata:33 name: success-rate-check34spec:35 args: - name: service-name36 metrics: - name: success-rate37 interval: 30s38 successCondition: result >= 0.9539 failureLimit: 340 provider:41 prometheus:42 address: http://prometheus.monitoring:909043 query: |44 sum(rate(45 http_requests_total{service="{{args.service-name}}",status!~"5.."}46 [2m]))47 /48 sum(rate(49 http_requests_total{service="{{args.service-name}}"}50 [2m]))
Two services, `ai-inference-active` and `ai-inference-preview`, run in parallel. The router points all production traffic at active. When the new model version deploys, it lands on preview.
The pre-promotion analysis queries Prometheus every 30 seconds. It requires a success rate at or above 95% over the analysis window before it will flip the router.
If the canary drops below threshold three times in a row, promotion aborts. The old model keeps serving. No incident, no rollback fire drill.
The model version label (`model.version: "v2.4.0"`) is a first-class piece of config, not an afterthought. Model versioning strategy matters as much as container versioning.
You need to know exactly which weights are serving which traffic at any moment. The same config maps cleanly to AI inference. Weights, feature set, preprocessing pipeline, and traffic weight are all explicit.
These patterns are documented across Argo Rollouts for AI inference deployments in regulated environments. The combination of pre-promotion analysis and blue/green routing is what separates a high revert rate from a low one.
Most teams still skip the pre-production analysis layer entirely. The 59% who don't revert share a different habit.
What the Non-Reverting 59% Have in Common
It's not better models. The non-reverting teams ship the same model accuracy benchmarks as everyone else. What they have is a thicker operational substrate around the model.
Three habits separate them: - Pre-promotion analysis as default infrastructure. Every AI rollout goes through an automated success-rate gate before any user sees it. No exceptions, no "we'll just watch it manually." - Traffic shifting as a first-class concern. Canary and blue/green aren't advanced topics. They're table stakes. The platform team owns them, not the data science team. - Model-specific observability. Prediction distribution shift, confidence decay, and feature freshness are instrumented alongside uptime and error rates.
The gap between the 41% and the 59% is rarely a modeling decision. It's almost always a deployment platform decision, made months before the first revert ever happens.
Sources
Research and references cited in this article:
- Why Most AI Projects Fail Before Production in 2026 | Myticas Consulting
- Why 88% of AI Agents Fail Production: Analysis Guide
- Enterprise AI failure increasingly appears after the pilot.
- AI Model Deployment Challenges in Production
- AI Deployment: The Definitive Guide
- Medium
- The Role of MLOps in ML Lifecycle
- MLOps Principles
- How to handle versioning and rollback of a deployed ML model? - Microsoft Q&A
- Model Rollback: Reverting a Deployed Model to a Previous Version When Problems Occur
- From AI hype to hard numbers: measuring its impact on revenue, costs, and productivity – AI Impact
- Speed vs. Accuracy: Trade-offs in Data Analysis by AI Models
About the author
Mayank Singh is a software developer at Levitation Infotech, where he builds web and AI-powered applications across the company’s fintech, healthcare, and enterprise projects.