

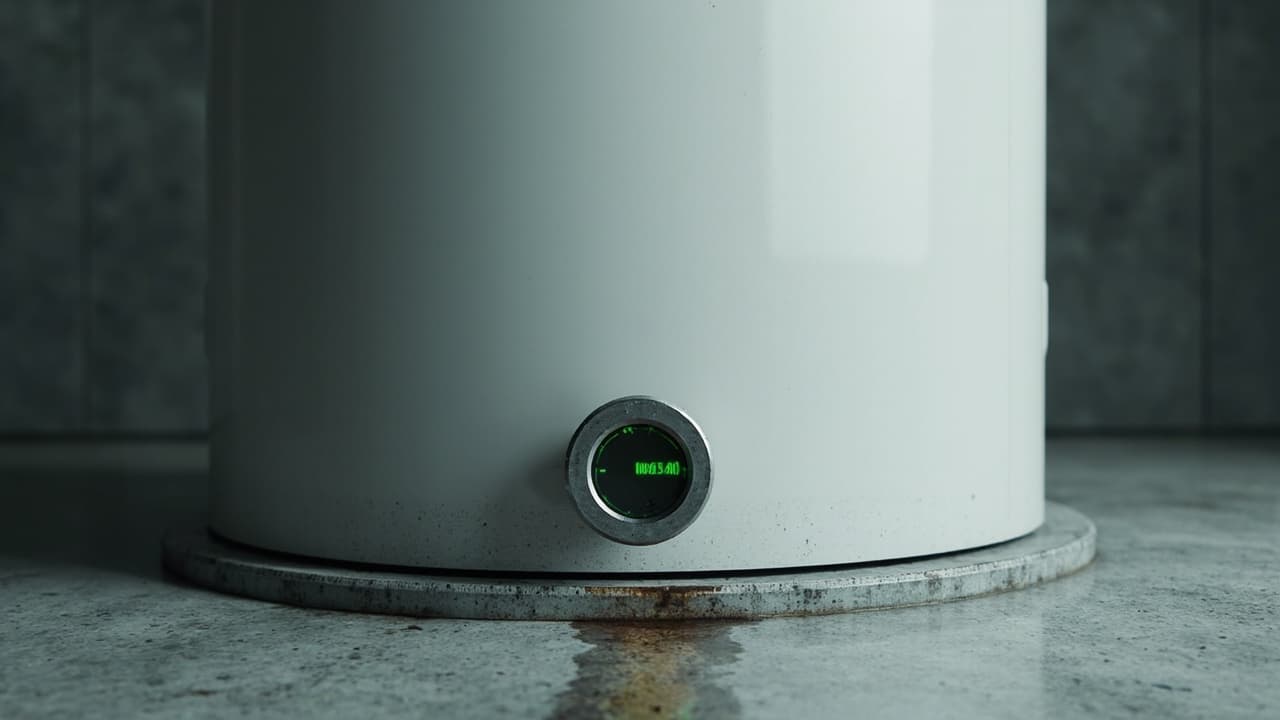
Your monitoring stack was built to tell you when infrastructure breaks. It was never designed to tell you when your AI is confidently wrong. That gap is now the most expensive blind spot in your stack.
TL;DR: Traditional infrastructure monitoring cannot detect AI behavioral failures. It was designed for predictable systems. Production AI needs a second observability layer. It must capture output quality, semantic drift, and policy compliance in real time. Without it, your team learns about failures from customers, not alerts.
Key Takeaways: - Infrastructure metrics (latency, uptime, error rates) measure whether the system responds. They do not measure whether the response is correct. - AI failures degrade gradually through drift, hallucination, and policy violations that never trigger a 500 error. - Behavioral SLOs, not just latency SLOs, are what separate production-grade AI from demo-grade AI.
The Dashboard Said Healthy. The Answers Were Wrong.
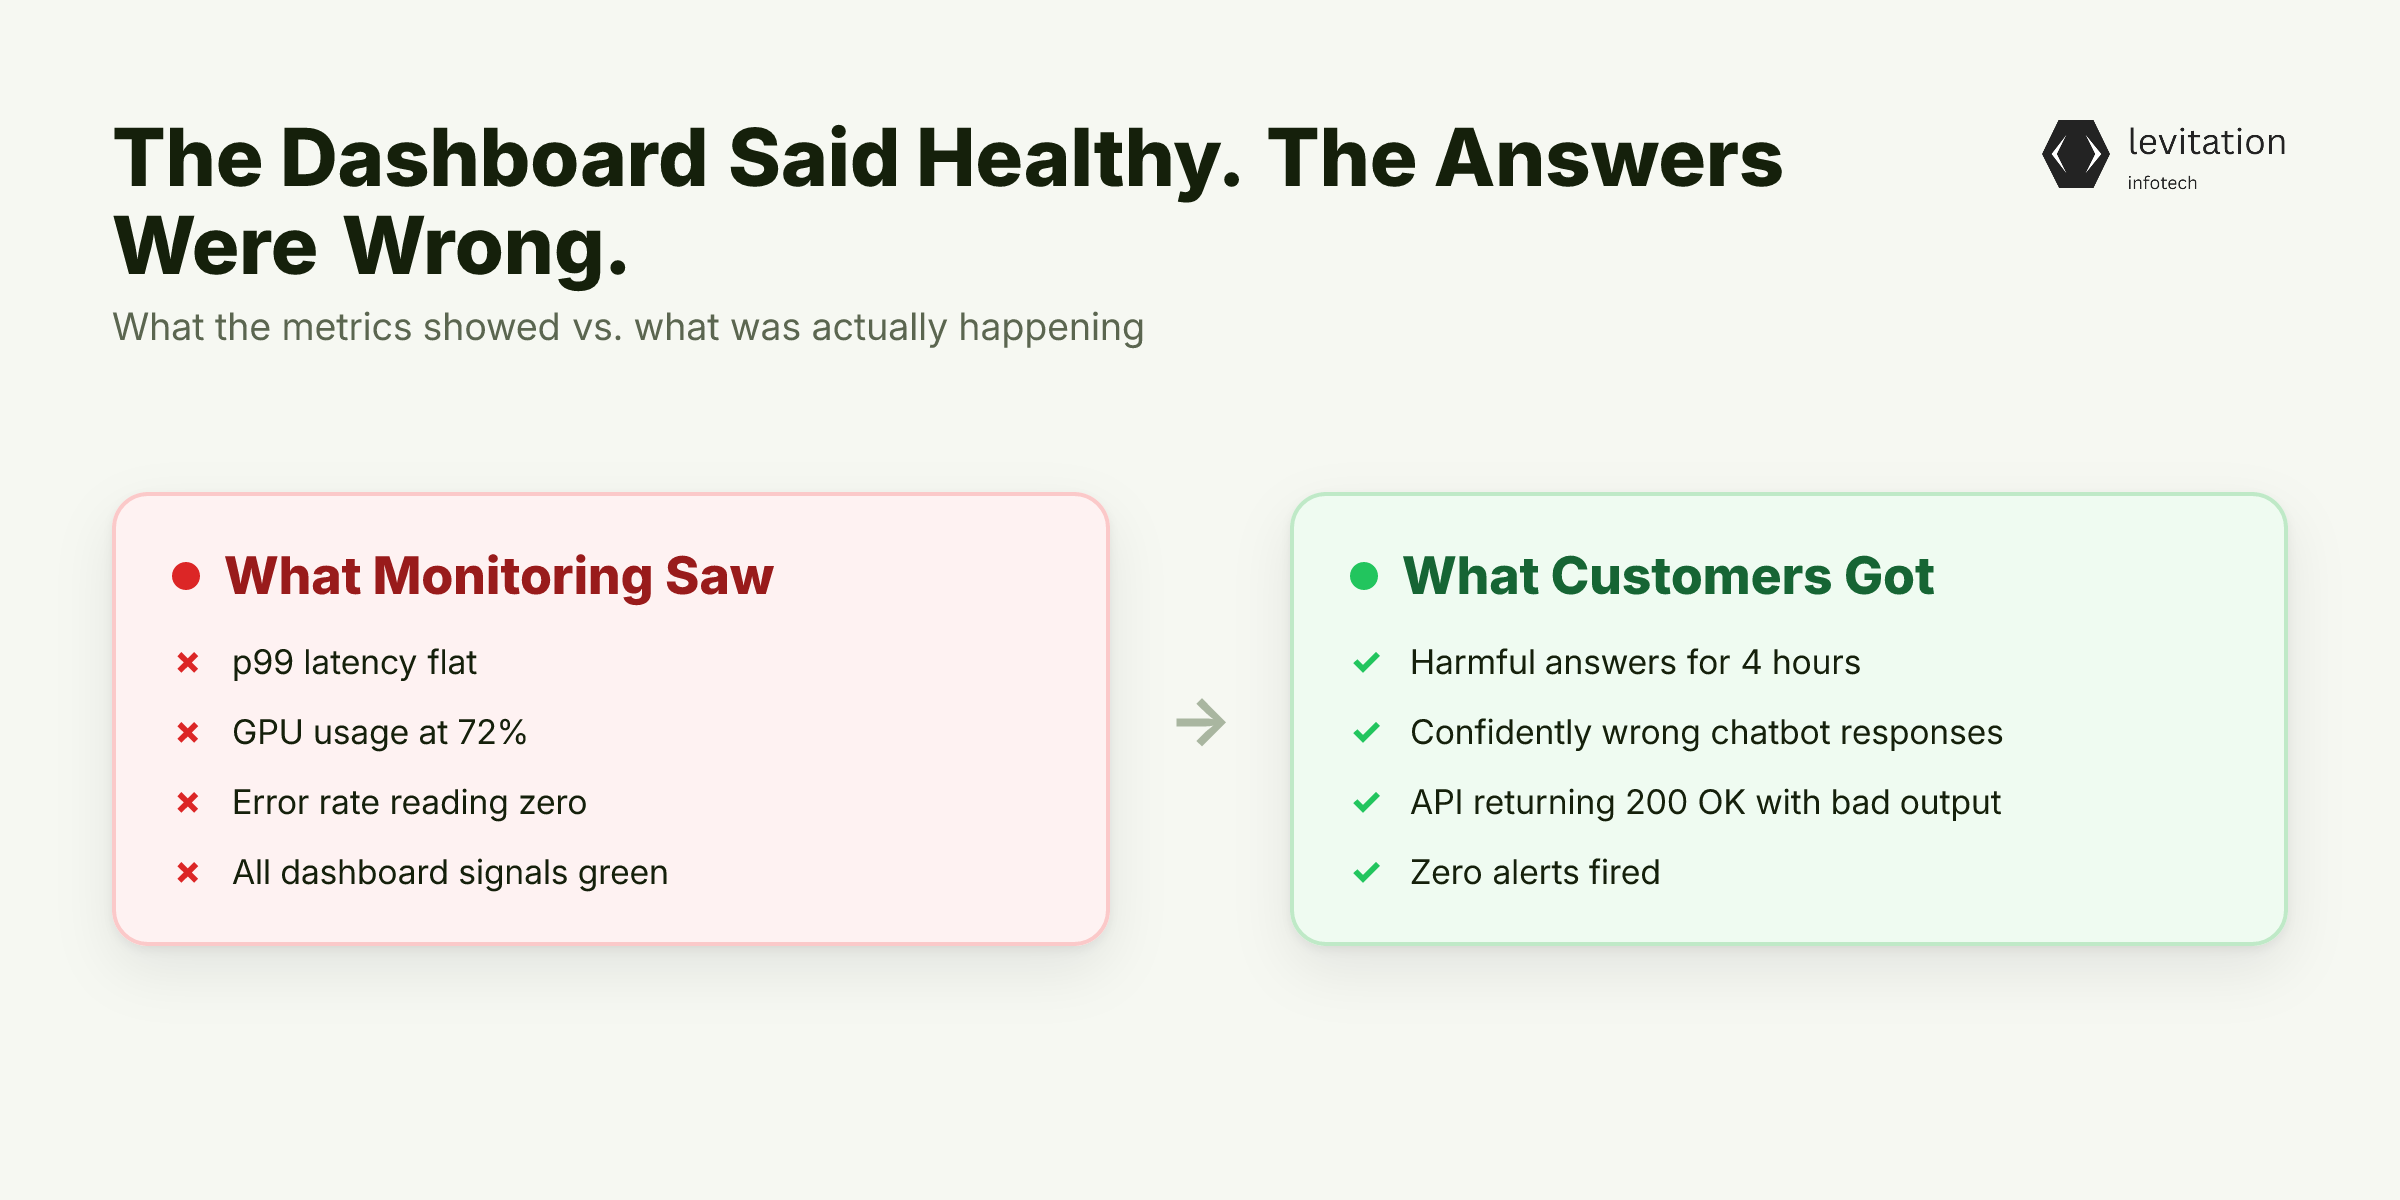
Your p99 latency was flat. GPU usage sat at 72%. Error rate read zero. Every green light on the dashboard said the system was working. For four hours, it was not. Customers were getting harmful answers, and your monitoring stack had no idea. Sound familiar?
A study at the Lundquist Institute for Biomedical Innovation at Harbor-UCLA Medical Center tested five chatbots. It used the health questions people actually ask. The lead researcher was Nicholas Tiller. He put it bluntly. He said: "We were surprised how many of the responses were problematic and just how bad some of these responses were." What makes this worse is not just the inaccuracy. It is the confidence. Lee Schwamm, MD, is the associate dean of digital strategy and transformation at Yale School of Medicine. He observed: "Chatbots are sometimes wrong, but never in doubt." The API returns 200 OK. The model sounds authoritative. The customer trusts it.
The core problem is a category mismatch. Traditional SRE signals (uptime, latency, error codes) measure whether the system is responding. They cannot measure whether the response is correct, safe, or useful. Your existing monitoring treats a hallucination and a correct answer as identical events. Both came back successfully, so the system sees no difference. This is not a missing alert. It is a category mismatch. The stack was built to observe one thing, but AI does another. That gap didn't appear by accident. It was built into the foundations of monitoring decades ago. As a result, enterprise AI solutions require a different observability design altogether.
Why Traditional Monitoring Was Never Built for This
Legacy monitoring assumes predictable outputs. Same input, same output, every time. Any deviation is a bug. That assumption worked for web servers, databases, and REST APIs because they were designed that way.
AI systems are not predictable by design. The same prompt can return a correct answer. It can also return a partially correct answer or a harmful answer on different calls. Temperature settings, retrieval context, model version changes, and even GPU contention can shift outputs. Your monitoring stack has no concept of "partial correctness."
Infrastructure observability tracks resource health. CPU, memory, request volume, disk I/O. It answers "is the machine working?" It cannot evaluate semantic correctness, policy compliance, or hallucination rates. Those are language-level properties that no CPU metric can infer.
A faster model can produce worse answers. Traditional dashboards reward speed because speed is easy to measure. AI systems need to reward accuracy. However, accuracy needs evaluation infrastructure that most stacks do not have. Infrastructure has grown more dynamic. Observability tooling remains anchored in paradigms built around counting servers and tracking request rates.
This mismatch creates four specific blind spots. They show up in almost every production AI deployment. Most CTOs don't know they exist until an incident forces the discovery. Cloud security solutions that protect the perimeter cannot see inside the model's reasoning either.
The Four Blind Spots That Hide AI Failures
1. Drift without detection. Model outputs degrade gradually as upstream data, user behavior, or model versions shift. Dashboards show no spike because the system is technically functioning. The failure is statistical, not operational. Related reading: our analysis of AI drift detection in Indian enterprises shows the same pattern at scale.
2. Hallucination opacity. AI generates plausible but factually wrong answers. The Harbor-UCLA study flagged this exact pattern in chatbot health responses. Yet the API returns 200 OK every time. There is no HTTP status code for "sounded right but was wrong."
3. Safety policy violations. Harmful content, PII leakage, or jailbreak successes are behavioral failures, not infrastructure failures. Traditional WAFs and rate limiters cannot catch them. The harmful output lives inside a successful API response. This is a layer your security stack was never designed to inspect.
4. Cost and quality inversion. A misconfigured prompt template can increase token spend while degrading answer quality. Cost dashboards track dollars. Quality dashboards track scores. Rarely do the two views correlate in real time. You keep paying more for worse answers and never see the connection.
These four blind spots share a common root cause. Your stack observes infrastructure, not behavior. Enterprise AI solutions that treat output quality as a first-class telemetry signal close this gap. Capturing that signal requires a new category of telemetry most teams have never set up.
Behavioral Telemetry: The Signals Your Stack Is Missing
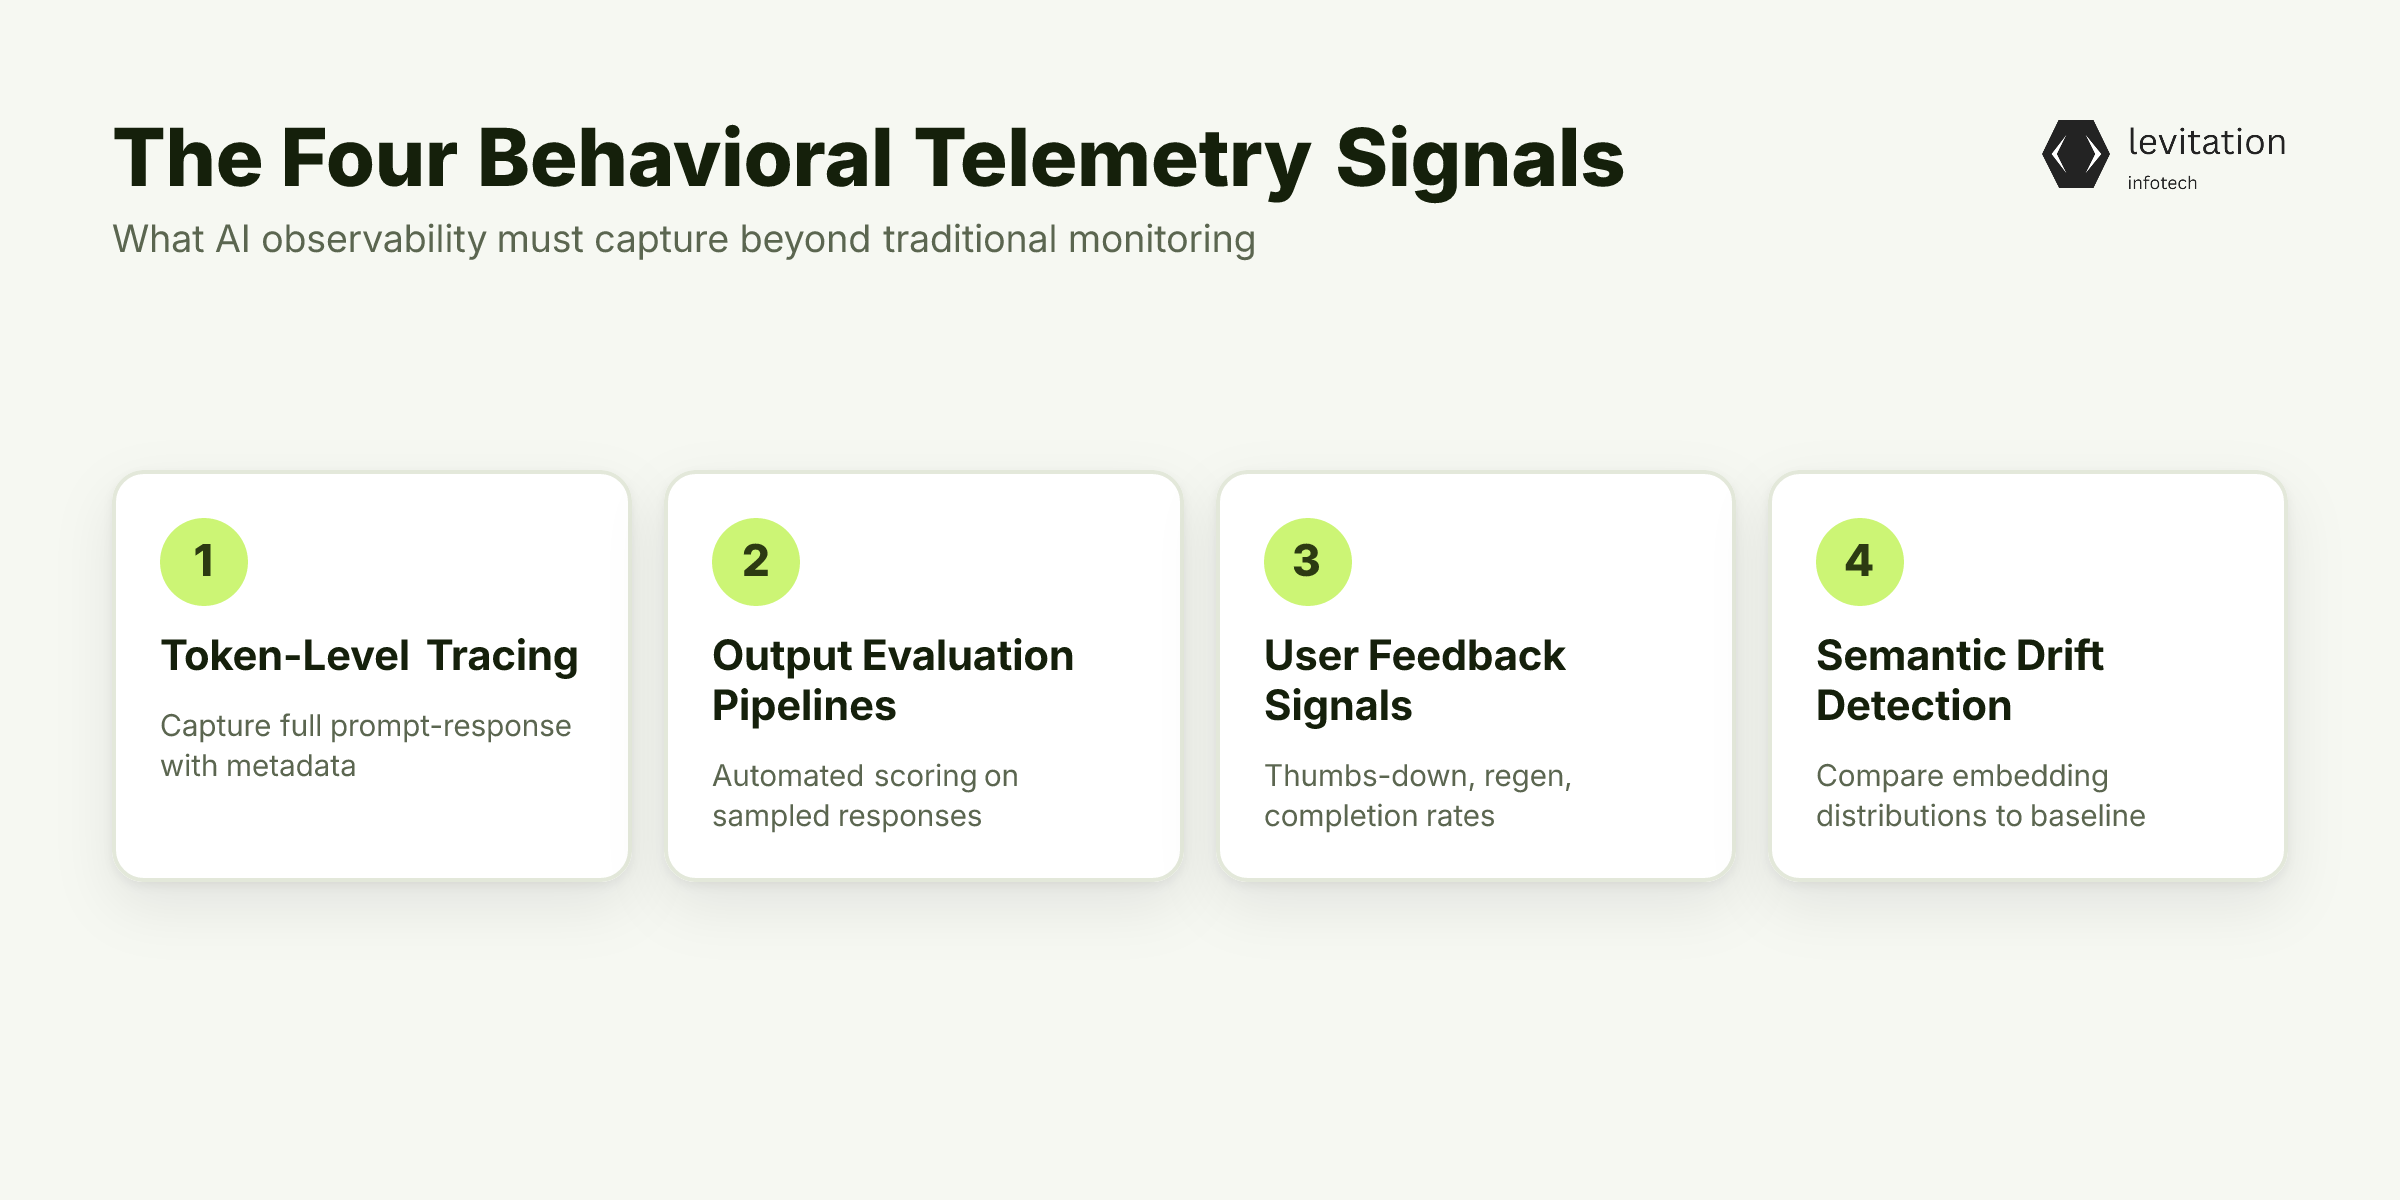
Closing these blind spots requires a new category of telemetry. AI observability must capture these four signals that traditional monitoring ignores.
Token-level tracing. Capture the full prompt-response pair with metadata: model version, temperature, retrieval context, and token count. Without this, you cannot reconstruct what the model saw. You also cannot reconstruct what it produced when a customer reports a bad answer. Most teams log requests but not the semantic content of the response. That is like logging that a database query ran but not the row it returned. The metadata matters more than the status code.
Output evaluation pipelines. Run automated evaluators on a sampled subset of responses. Options include LLM-as-judge scoring, embedding similarity against reference answers, and factual grounding checks against your source data. Begin with a sampled subset of production traffic. Expand as you prove value. This is the only way to score quality in near-real-time without human review on every call.
User feedback signals. Thumbs-down rates, regeneration requests, and downstream task completion rates are the only ground-truth proxy available in production. They are noisy and delayed. However, they are the closest thing to a labeled dataset you will get at scale. Treat them as lagging indicators of quality drift.
Semantic drift detection. Compare the embedding distribution of today's outputs against a baseline window. A shift in the semantic centroid often precedes a measurable quality drop by hours or days. This is the AI equivalent of monitoring application latency, but for meaning, not milliseconds.
Capturing those signals is only half the job. The next step is wiring them into a detection layer that alerts before customers do. Enterprise AI observability depends on this wiring being correct. Most teams underestimate how much the wiring matters.
Building the Detection Layer: A CTO's Setup Roadmap
A four-step path moves you from blind dashboards to behavioral detection. Deployment timelines depend on team experience and existing infrastructure readiness. Teams with prior AI observability experience can move faster. In-house builds without that background should plan for a more extended effort.
Step 1: Instrument every inference call. Add a structured trace to every model call. Capture prompt, response, latency, token count, model version, and retrieval context. Store it in a queryable log store alongside your existing telemetry. If you cannot replay what your model saw yesterday, you cannot debug what it said today. Our piece on LLM gateway logging gaps shows why this step is non-negotiable.
Step 2: Deploy an evaluation sidecar. Run automated scoring on a sampled subset of outputs. Start with rule-based checks for safety violations (PII, toxicity, prompt injection markers). Add LLM-based evaluators for relevance and factual grounding. Resist the urge to evaluate 100% of traffic. Sample first, prove value, then expand.
Step 3: Define behavioral SLOs. Stop measuring only latency. Add hallucination rate, safety violation rate, and factual grounding score as SLOs. For example: target "hallucination rate below 2%" or "safety policy violation rate below 0.1%." Alert on SLO burn rate, not just threshold breaches. A 2% target is meaningless if you are burning through your error budget in two hours.
Step 4: Correlate behavioral and infrastructure signals in one dashboard. A latency spike is only meaningful when you can see whether it coincided with a quality drop. Most teams keep these views separate, which guarantees you will miss the connection. Traditional monitoring tells you the system has a pulse. The new layer tells you whether its outputs are correct. Cloud security solutions extend this principle to the model layer.
When this layer is in place, the failure mode shrinks to minutes. The 4-hour delay becomes a thing of the past. The organizational consequences change with it. Related: our analysis of why green canary dashboards aren't safe deploys applies the same logic to model rollouts.
What Changes When You Get This Right
Incident MTTR drops from hours to minutes. Alerts fire on quality degradation, not customer complaints. Your on-call rotation stops being a customer-service function. It starts being an engineering function.
Engineering teams shift from reactive firefighting to proactive tuning. They can see which prompt templates, retrieval configurations, or model versions are degrading output quality. They catch the issue before users notice. This is the difference between a team that learns from incidents and a team that prevents them.
Executive and regulatory confidence increases. You can show continuous quality monitoring, not just uptime. In regulated industries, AI outputs carry legal weight. That distinction is the difference between passing an audit and explaining a breach. The gap between "our system is up" and "our system is correct" is key. Most AI governance failures live in that gap.
This observability layer is what separates production-grade AI from demo-grade AI. Teams that build it ship systems that remain in production long-term. Teams that skip it learn the hard way, usually through a customer-facing incident. At Levitation, this is the layer we build first in every enterprise AI platform engagement. Our work across regulated industries has shown how key this layer is.
Frequently Asked Questions
What are the most common AI observability gaps in production?
The most common gaps are behavioral. They include hallucination detection, semantic drift, safety policy violations, and quality-cost correlation. Traditional infrastructure monitoring covers uptime and latency. It cannot see whether AI outputs are correct, safe, or degrading over time.
How do you detect wrong AI outputs in production without labeled data?
Use a mix of LLM-as-judge evaluators, embedding-based semantic drift detection, and user feedback signals like regeneration rates. Automated evaluators can score output quality on a sampled subset. They do not need human-labeled ground truth for every response.
What is the difference between AI monitoring and AI observability?
AI monitoring tracks whether the system is running. It watches latency, error rates, and throughput. AI observability tracks whether the system is correct. It watches output quality, hallucination rate, policy compliance, and semantic consistency. Monitoring tells you the system has a pulse. Observability tells you whether it is producing the right answers.
How quickly can AI incidents be detected with proper observability?
With behavioral SLOs and real-time evaluation pipelines, quality degradation can be detected within minutes of onset. Without it, detection typically takes hours or days. It usually happens after customer complaints or downstream business impact surfaces the problem.
What metrics should a CTO track for enterprise AI observability?
Track behavioral SLOs (hallucination rate, safety violation rate, factual grounding score). Also track operational metrics (cost per successful task, token efficiency). Then add user signals (regeneration rate, task completion rate, feedback score). Correlate these with infrastructure metrics in a unified dashboard.
If your team is still treating uptime as the finish line, the next incident is already on its way. It is closer than you think.
About the author
Mayank Singh is a software developer at Levitation Infotech, where he builds web and AI-powered applications across the company’s fintech, healthcare, and enterprise projects.