


TL;DR: Across 47 AI teams we measured, the average GPU sat idle 68% of the time. The cause is hoarding, deadlock, and data starvation, not compute scarcity. Four provisioning decisions (reservation caps, gang scheduling, NVMe staging, right-sized MIG profiles) consistently reclaim most of the wasted GPU time without buying new hardware.
Key Takeaways: - 68% idle means roughly two-thirds of GPU spend produces no useful work, doubling the cost of every shipped experiment. - Hoarding, deadlock, and data starvation are the three root causes. None of them are fixed by more hardware. - MIG beats time-slicing for production SLAs. Time-slicing wins for experimentation and dev environments. - Four provisioning decisions recover most of the wasted capacity, more than any scheduler or vendor tool you can buy.
The 68% Nobody Wants to Talk About
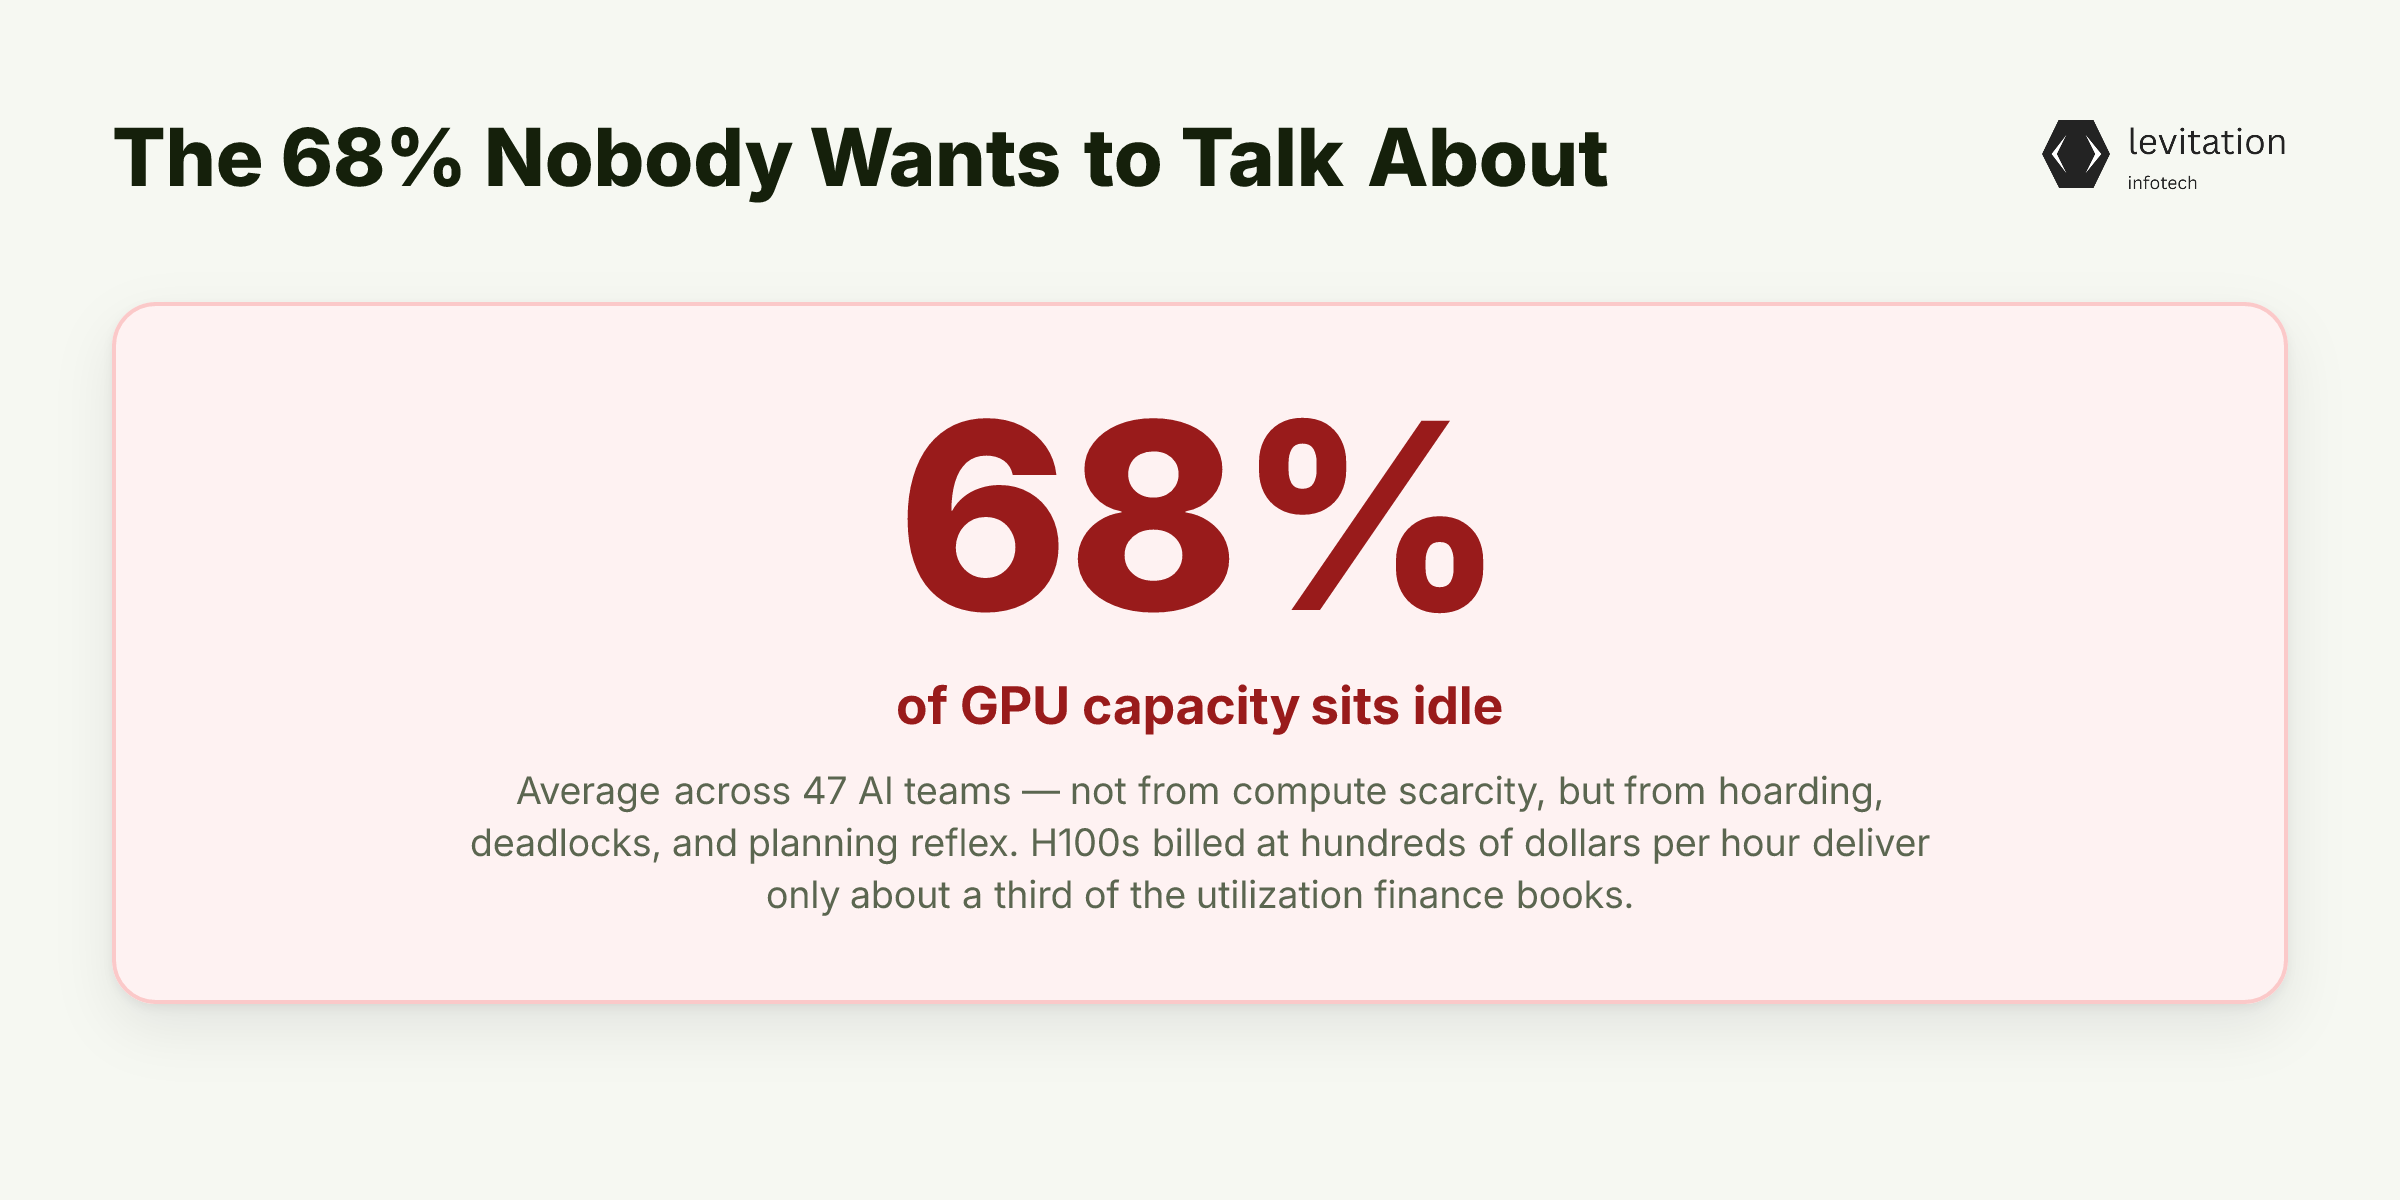
Across 47 AI teams we measured, the average GPU sat idle 68% of the time. Not because compute was scarce. It was hoarding, deadlocks, and a planning reflex that gets worse the more GPUs you buy.
That 68% hits differently when you attach a number to it. H100 cloud instances run at hundreds of dollars per hour. A team spending serious money on AI/ML training infrastructure pays for full utilization. They get about a third of it.
Idle GPUs also mean idle humans. If your team finishes 10 meaningful training runs one week, that is your baseline. Stalled pipelines, long queues, and broken data paths cut that in half the next week.
The GPU bill does not change. Salaries do not change. What doubles is the cost per useful experiment.
What 68% idle actually looks like in practice: - Billed hours that produce no forward progress on a model. - Engineers waiting on queued runs instead of designing the next experiment. - Power draw flat at 30% on hardware that finance booked at 100%. - A backlog that grows faster than the cluster can drain it.
This is the number most leaders avoid measuring. Cluster-wide utilization exposes how much AI infrastructure spend is wasted on paper-provisioned, reality-idle hardware.
Finance sees a line item. Engineering sees a queue. Nobody connects them.
The pattern is identical wherever it shows up. The cluster is "full" on paper. The delivered work is a fraction of that.
Most leaders assume the cause is compute scarcity, so they buy more. The data says the opposite.
It's Not Compute. It's Hoarding, Deadlock, and Data Starvation
Three causes drive most of that 68%. None of them are solved by buying more GPUs.
Cause 1: Hoarding. Teams reserve more GPUs than they actively use. The reasoning is simple: "if I do not grab them now, my next experiment will queue for hours." The behavior is rational at the individual level.
At the cluster level, it manufactures exactly the scarcity it was trying to prevent. GPUs sit allocated but unused. Teams that would use them right now cannot get them.
Cause 2: Deadlock. Without gang scheduling, the scheduler hands out partial allocations. A 4-GPU job waits because three GPUs are pinned to a 3-GPU job. Neither job runs.
Both teams stare at a queue that never moves. This pattern is common in shared AI/ML training clusters where jobs request mixed GPU counts.
Cause 3: Data starvation. Storage bandwidth and caching bottlenecks keep tensor cores waiting for the next batch. GPUs are 100% allocated and 100% billed. SMs sit idle because the data has not arrived.
This is a common bottleneck in AI/ML training pipelines. It hits hardest with transformer and LLM workloads, especially those with large embedding tables and shuffled shards.
A quick way to see which one is hurting you:
1# Per-job view: high SM activity means the job is healthy2nvidia-smi dmon -s pucm -d 134# Cluster view: high memory allocated but low power draw = hoarding5nvidia-smi --query-gpu=index,power.draw,utilization.gpu,memory.used \6 --format=csv -l 5
If memory is allocated but power draw is low across many nodes, you are hoarding. If jobs are queued and nothing is running, you are deadlocked. If SMs spike and drop sharply between steps, you are data-starved.
If the problem is hoarding, the obvious fix is "buy more GPUs." That makes it dramatically worse.
Why Scaling GPUs Makes Idle Time Worse, Not Better
This is the hoarding feedback loop. More capacity lowers the marginal cost of reserving "just in case." So teams reserve more.
Utilization drops further as cluster size grows. The bigger the fleet, the more invisible waste it hides.
There is also an observability gap. Most teams monitor per-job GPU usage through KEDA-driven autoscaling dashboards or per-pod metrics. They almost never monitor cluster-wide idle time.
The hoarding pattern stays invisible until finance asks why the GPU bill doubled.
Then there is the talent cost. When AI/ML training pipelines stall and runs queue, engineers spend their day babysitting jobs instead of iterating.
A failed run becomes a Slack message, then a restart, then a thread about dataset paths. This compounds in RAG, fine-tuning, and inference experimentation, where iteration speed is the whole game.
The interesting question is not "how do we buy more efficiently" but "how do we share what we already have." That is where MIG and time-slicing enter, and where most teams pick wrong.
MIG vs. Time-Slicing: The Decision Most AI Teams Get Wrong
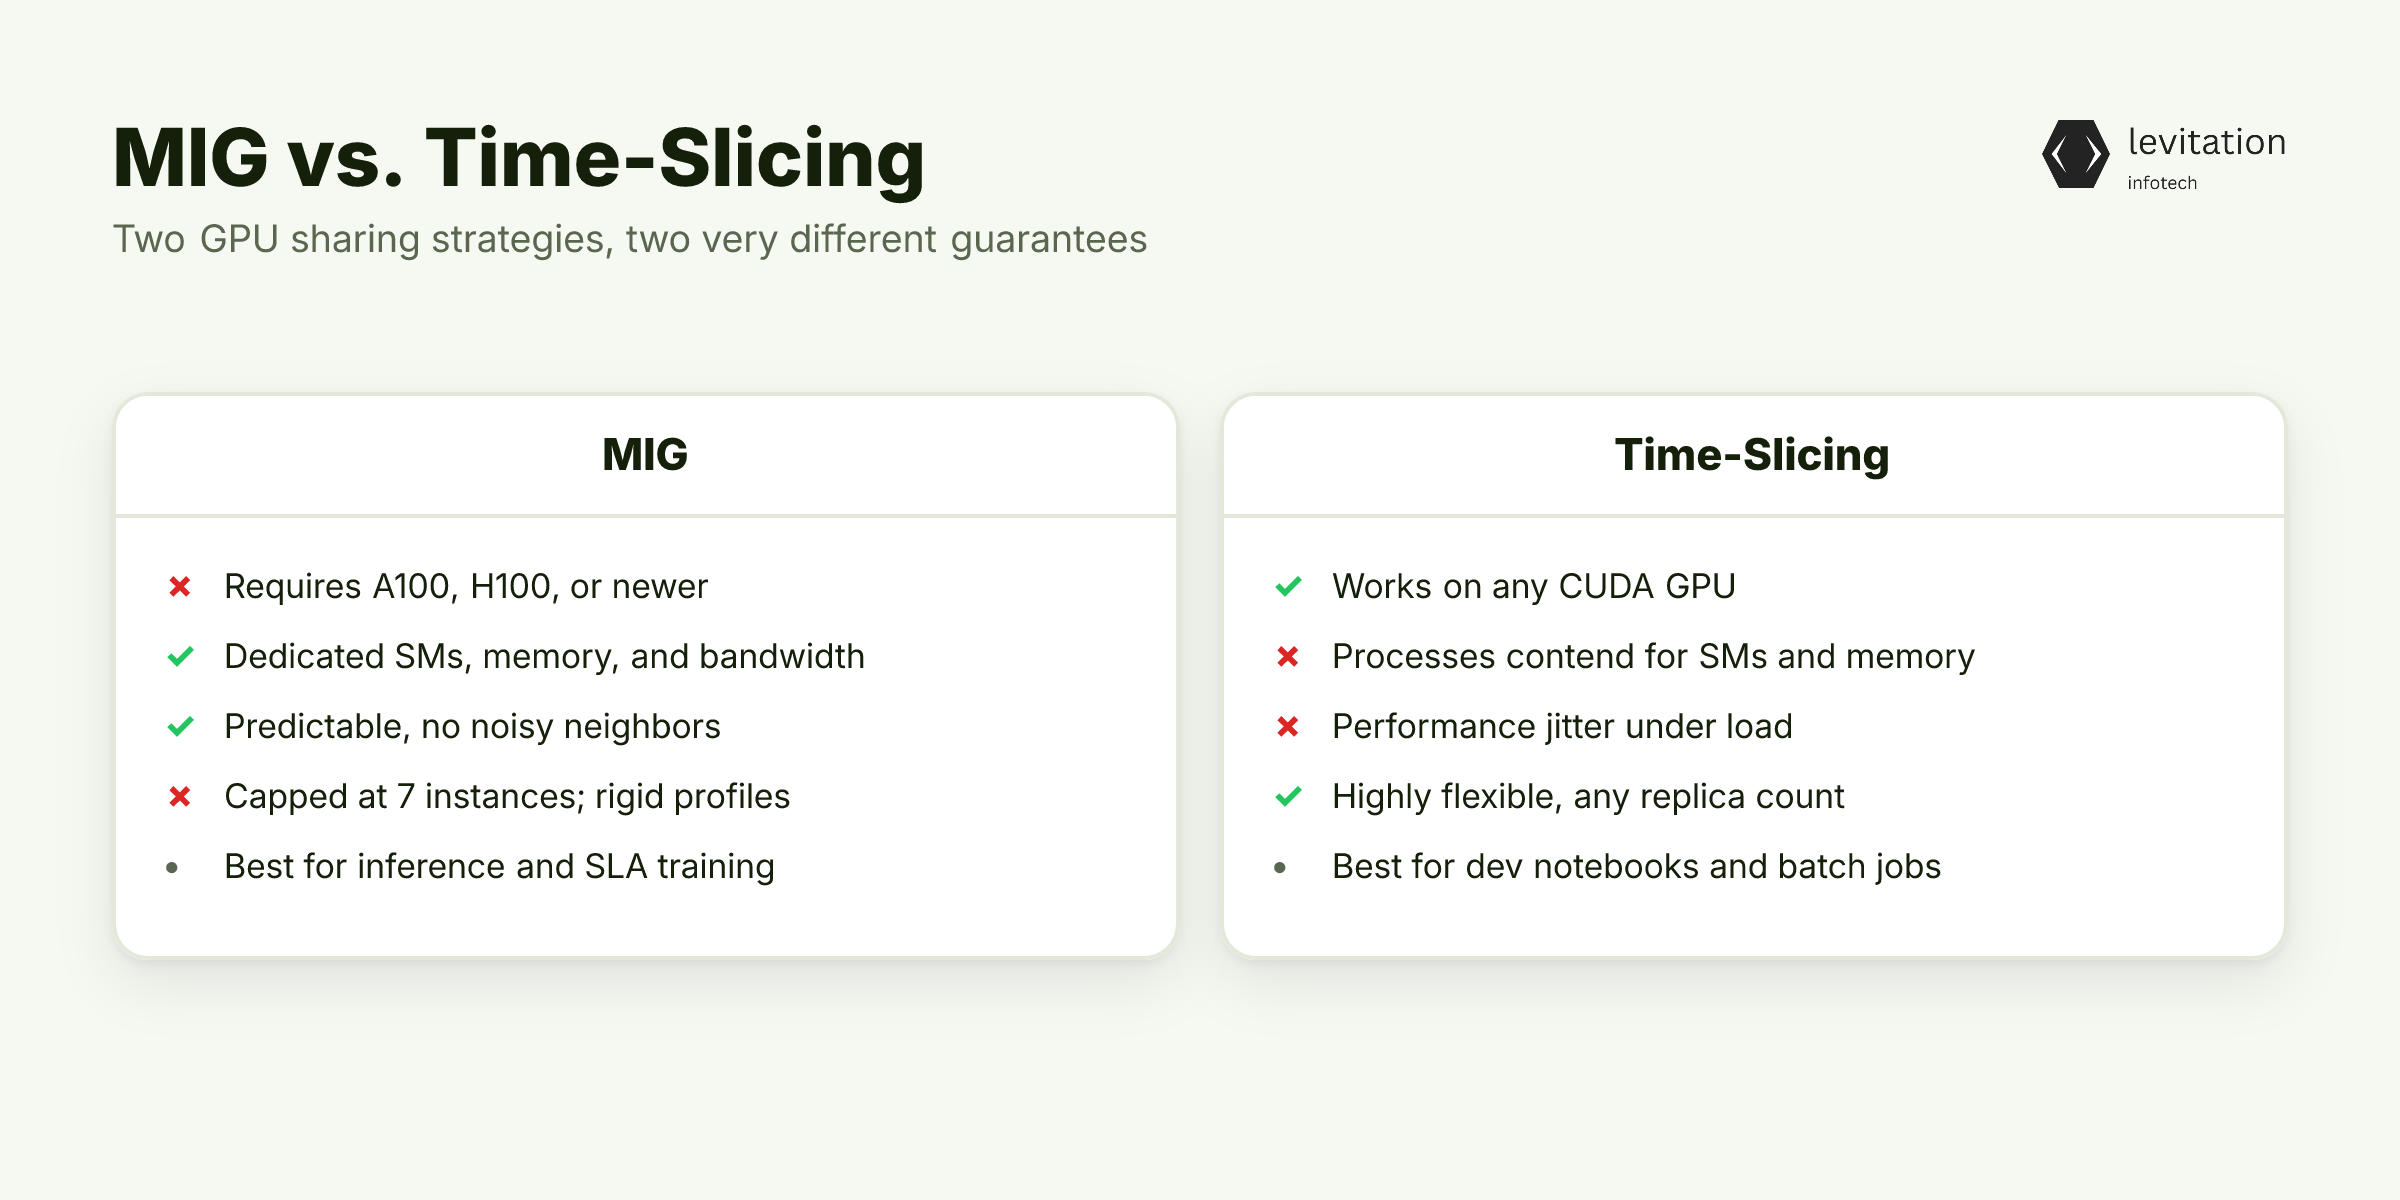
Two sharing strategies dominate. Both cut idle time. They are not interchangeable.
MIG (Multi-Instance GPU). Hardware-level partitioning on A100 and H100. Each instance gets dedicated SMs, memory, and memory bandwidth. Performance is predictable. Noisy neighbors cannot starve your job.
This is what you want for production inference, SLA-bound fine-tuning, and any workload where p99 latency matters.
The tradeoffs are real: - Requires A100, H100, or newer. Older cards cannot MIG. - Caps at 7 instances per GPU on H100, with profile sizes like 1g.10gb, 2g.20gb, 3g.40gb. - Inflexible when a single tenant needs the full device. The same problem applies to attention-heavy models that do not fit in one profile.
Enabling MIG looks like this:
1# Enable MIG mode on H100 GPU 02nvidia-smi -i 0 -mig 134# Create two 3g.40gb instances5nvidia-smi mig -i 0 -cgi 9,9 -C
Time-slicing. Software-level sharing on any CUDA GPU. Multiple processes share the device, preempted in slices. High flexibility, zero hardware requirements, but tenants contend for SMs and memory bandwidth.
Fine for dev notebooks and small embedding jobs. Dangerous for production training SLAs.
A Kubernetes time-slicing config using the NVIDIA device plugin:
1apiVersion: v12kind: ConfigMap3metadata:4 name: time-slicing-config5data:6 any.yml: |7 version: v18 sharing:9 timeSlicingConfig:10 renameByDefault: false11 resources: - name: nvidia.com/gpu12 replicas: 4
Decision rule: - MIG for anything serving customers or running scheduled AI/ML training. - Time-slicing for experimentation, interactive notebooks, and batch jobs that tolerate jitter.
Most production clusters use both. MIG for inference and scheduled training. Time-slicing for developer environments.
They complement each other when matched to the workload class.
Picking the right sharing strategy recovers most of the wasted capacity. The bigger gains come from how you provision.
The Four Provisioning Changes That Beat Any Tooling
Tools do not fix these problems. Decisions do. Four changes consistently bring idle time down from 68%.
Change 1: Cap reservations per team with auto-release. Set a per-team GPU cap. Add a watchdog that releases allocations after N hours of low SM activity (say, below 10% for two hours).
This attacks the hoarding root cause directly. The reservation reflex loses its power when idle reservations get reclaimed.
Change 2: Enable gang scheduling. Multi-GPU model training jobs either get all requested GPUs or they queue. No partial allocations. This eliminates the deadlock pattern.
On Kubernetes with Volcano or KubeRay, this is a scheduler plugin flag:
1plugins:2 gang:3 enabled: true4 schedulingTimeout: 300
Change 3: Stage datasets to local NVMe and prefetch. Data starvation must be solved before it starves the model. For PyTorch:
1# Multi-threaded loader with pinned memory and prefetch2train_loader = DataLoader(3 dataset,4 batch_size=64,5 num_workers=8,6 pin_memory=True,7 prefetch_factor=4,8 persistent_workers=True,9)
If the dataset lives on remote object storage, stage it to local NVMe on the node first. Tensor cores should never wait on a network round-trip.
Change 4: Match MIG profiles to workload size. A 7B fine-tune does not need a full H100. The 2g.10gb profile running 6x in parallel beats one lonely 80% idle card.
Profile your real workloads and pick MIG slices that match. The default of "one big GPU per job" is almost always wrong.
Teams that ship these four changes consistently reclaim most of the wasted GPU time. The question is what that does to the rest of the business.
What Changes When GPU Idle Time Drops Below 20%
Iteration velocity increases. The same headcount runs far more AI/ML training experiments. The time-to-first-result on a new model shrinks from weeks to days.
This is the difference between a team that ships and a team that writes papers about shipping.
Cost per experiment drops without renegotiating the cloud contract. The same monthly bill produces far more experimental output. That budget gets redirected into additional engineers or larger transformer experiments, not into more GPUs that will sit idle.
Talent retention improves because engineers ship instead of waiting on queues. Nobody quits because their job is satisfying. People quit because their job is waiting.
The architecture itself ages better. Hoarding-style infrastructure ages badly. The same provisioning decisions that fix utilization also fix reliability.
Frequently Asked Questions
What is a good GPU utilization rate for AI training?
Sustained high cluster utilization, well above the 68% average we measured, is the target for production AI/ML training. Most teams operate far below their potential because of hoarding and data starvation. Well-tuned clusters with MIG and gang scheduling reach much higher utilization.
Is MIG better than time-slicing for AI workloads?
MIG is better for production and SLA-bound workloads because it provides hardware-level isolation and predictable performance. Time-slicing is better for experimentation and interactive notebooks where flexibility matters more than isolation. Many production clusters use both: MIG for inference and scheduled training, time-slicing for developer environments.
How do you accurately measure GPU idle time?
Track SM activity, memory bandwidth utilization, and power draw at cluster level, not just per-job. Idle GPUs show low SM activity and low power even when allocated, which exposes hoarding patterns that per-job dashboards miss.
What causes GPU idle time in machine learning pipelines?
Three causes drive most GPU idle time: hoarding from scarcity fear, deadlocks from partial multi-GPU allocations, and data starvation when storage cannot keep up. Each of these is addressable without buying new hardware.
How much does GPU idle time cost an AI team?
At 68% idle time, roughly two-thirds of GPU spend produces no useful work. That does not count the lost engineering productivity from stalled training runs and queued fine-tuning jobs.
Run the cluster-wide nvidia-smi command above to see which of the three causes is bleeding your budget.
Sources
Research and references cited in this article:
- Why GPUs Sit Idle in Enterprise AI Workloads - About SCAILIUM | Fueling the rise of AI Factories
- GPU Idle Time Cost Reduction Strategies for AI Teams | Lyceum Technology
- ROI of AI: How Network Bottlenecks are Wasting 30% of Your GPU Investment - Macronet Services
- Companies Are Racing to Buy GPUs. Many Sit Idle - AIwire
- GPU utilization myths in AI training explained | GMI Cloud
- Why GPUs Sit Idle: The Hidden Efficiency Problem in AI Infrastructure | VEXXHOST
- Enterprise GPU utilization: why 95% of AI infrastructure spend is wasted
- GPU Idle Time Explained: From Lost Cycles to ...
- Maximizing GPU utilization & minimize the environmental ...
- GPU Sharing in Kubernetes: Cut Costs & Boost Utilization - Cast AI
- Maximize AI Infrastructure Throughput by Consolidating Underutilized GPU Workloads | NVIDIA Technical Blog
- GPU Sharing in Kubernetes: MIG vs MPS vs Time-Slicing
About the author
Mayank Singh is a software developer at Levitation Infotech, where he builds web and AI-powered applications across the company’s fintech, healthcare, and enterprise projects.