


TL;DR: llm-d inference can reduce request time by separating prefill from decode and steering work toward warm KV caches. That speed moves the bottleneck to decode memory bandwidth, cache locality, and metadata freshness. Production teams must optimize the entire route, not just token generation.
Key Takeaways: - Fast token generation does not guarantee a fast request when queueing, routing, and phase placement sit outside the model server. - Decode is often memory-bound, making HBM bandwidth and KV-cache placement more important than raw GPU utilization. - Cache-aware routing needs health checks, capacity controls, and visible fallbacks to prevent warm-cache hotspots.
The Fastest Request Is Not the Fastest GPU
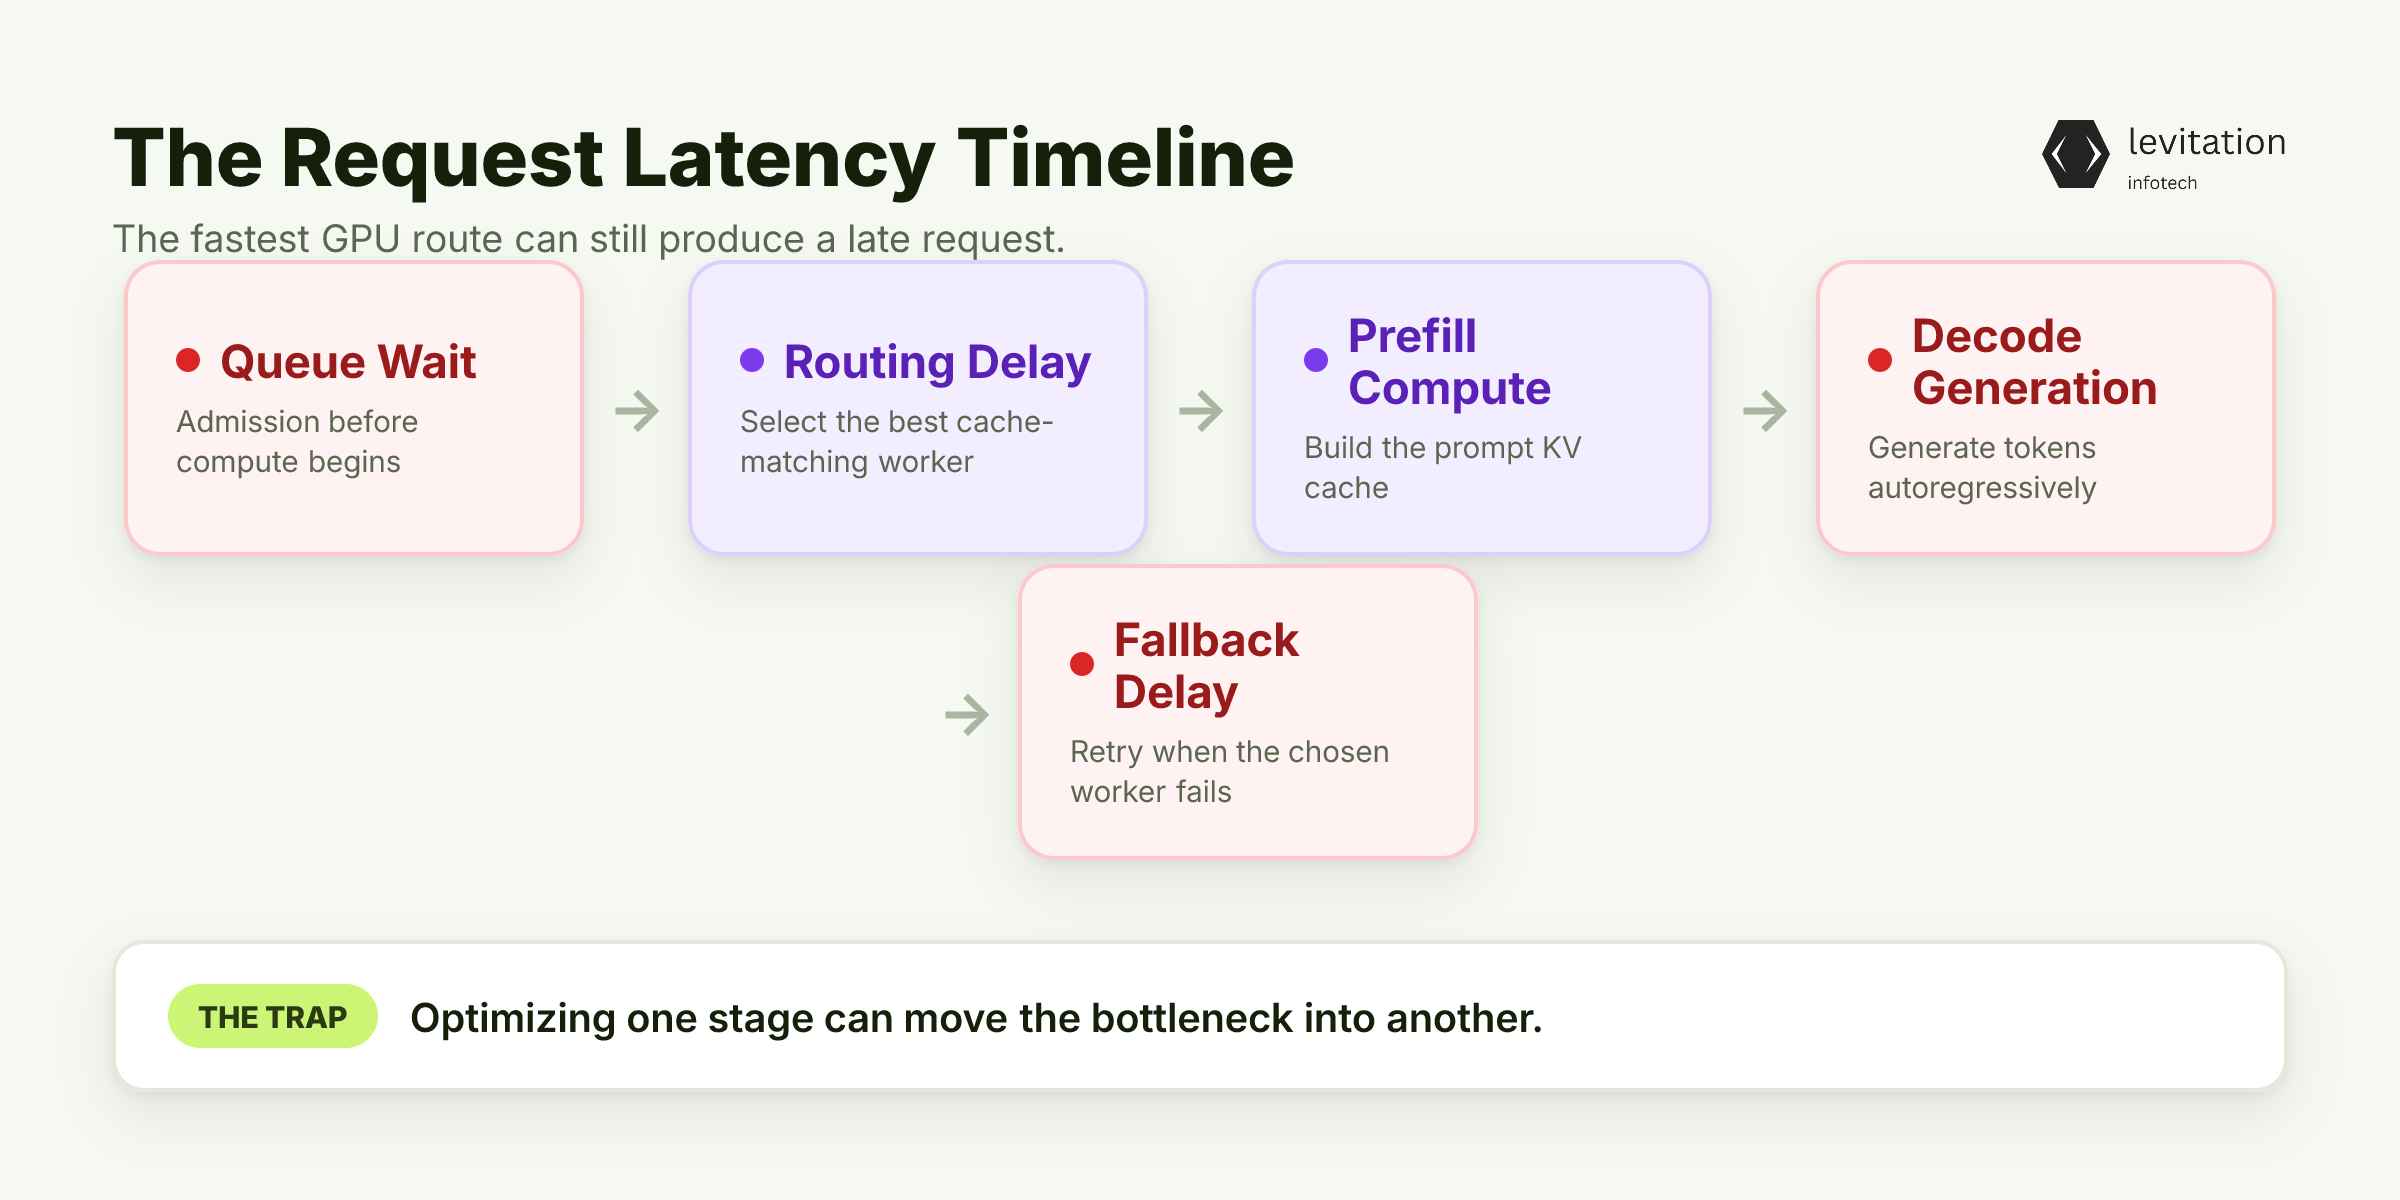
llm-d inference can reduce queueing and route a request to the worker holding the best-matching KV cache. Paradoxically, that fastest route turns cache locality, metadata freshness, and decode memory bandwidth into binding constraints. The request can pick the best path and still arrive late.
Start with the request timeline, not a model-server benchmark:
1request latency =2 queue wait3 + routing delay4 + prefill5 + decode6 + fallback delay
A model server owns part of that timeline. Queue admission, phase placement, cache discovery, and fallback handling often happen outside it. That is why fast token generation can coexist with a slow request.
llm-d combines Kubernetes, its Inference Gateway, and serving engines such as vLLM and SGLang. The project adds distributed orchestration above those engines. It supports disaggregated prefill and decode, runtime signals, and KV-cache routing.
That layer matters for teams designing enterprise AI solutions, turning production AI inference into a fleet problem rather than a pod problem.
Every optimization exposes another constraint. Splitting phases reduces mixed contention, while cache-aware routing can remove queueing. The remaining delay can migrate into decode.
The CTO scorecard should therefore separate: - Median token rate from end-to-end tail latency - GPU utilization from memory-bandwidth saturation - Peak throughput from cost per successful production request - Aggregate fleet use from uneven cache and queue pressure
Median token rate alone can hide tail latency, saturated memory bandwidth, uneven fleet utilization, and cost per successful production request. Aggregate GPU utilization can hide one saturated decode worker beside unused capacity.
This is the same scheduling trap described in Your GPUs Are Paid For. Kubernetes Still Makes Them Wait. The accelerator can be busy while the request still waits.
The first constraint becomes visible when a request leaves prefill and enters the autoregressive decode phase. What changes there is not the model, but the resource it needs.
Decode Exposes Memory Bandwidth Before Routing Can Help
Decode changes the resource profile.
Prefill processes prompt tokens in parallel and tends to be compute-bound. Decode generates tokens sequentially and tends to be memory-bound.
Each decode step must read model weights and the expanding KV cache:
1decode step:2 read model weights3 read KV state for earlier tokens4 compute the next-token state5 append new KV state
Attention stores key and value state for earlier tokens, so that state becomes part of every subsequent read. Decode GEMV-style operations have limited data reuse. They move weights and cache state with less arithmetic reuse than dense prefill work.
Modern accelerator compute capability has grown faster than memory bandwidth. Faster arithmetic therefore does not guarantee faster generation.
The distinction matters when AI/ML training and serving share accelerators because each phase stresses a different resource. More token-processing capacity does not automatically create more memory bandwidth.
Raw GPU utilization says the device is busy. Model Bandwidth Utilization, or MBU, asks whether decode uses memory bandwidth effectively.
1MBU = achieved model-memory bandwidth / peak model-memory bandwidth
MBU is more revealing for memory-bound decode because an accelerator can be busy without moving data efficiently. A dashboard can show high GPU utilization while requests wait on HBM transfers.
Routing can remove queue delay. It cannot manufacture HBM bandwidth or turn a memory-saturated decode phase into a compute-bound one.
Cache placement and bandwidth are part of inference design, not runtime housekeeping. The mechanics build on Inside the AI Brain, but production behavior changes when the work leaves one process.
Once bandwidth is recognized as the scarce resource, routing becomes a race against the latency budget. Can the gateway reach the right KV cache before that budget expires?
KV-Cache-Aware Routing Turns Locality Into the New Critical Path
A route can be accurate and still be late.
The gateway must answer several questions: Which worker is healthy, has capacity, and holds the needed prefix?
1gateway2 -> read workload metadata3 -> filter unhealthy and saturated workers4 -> score cache-affinity candidates5 -> select a decode worker
The inputs include queue depth, KV-cache utilization or events, and knowledge of which workload owns which prefix. AWS's llm-d deployment overview provides a reference for routing on request queues and KV-cache events. These signals can improve cache hits and throughput.
Useful routing signals include KV-cache utilization, work-queue depth, and prefix ownership. Consult the llm-d project documentation for the interface supported by your installed release.
Generic least-loaded routing asks which worker has the shortest queue. Cache-aware routing also asks which worker holds a matching prefix. That worker can win even with a longer queue because it avoids recomputing the prefix.
The new critical path is the time needed to discover, interpret, and act on correct cache and capacity metadata. It is not simply the time spent generating tokens.
Stale, incomplete, or coarse metadata causes several failures: - Sending work to a saturated worker - Selecting a worker without the desired prefix - Triggering repeated fallback attempts - Oscillating between workers during a traffic burst
Repeated fallback attempts then add delay while the fleet looks busy. The request remains slow, but the routing layer still appears active.
Disaggregation raises the stakes because phase placement and cache availability now cross a process boundary. The gateway must coordinate both instead of relying on local state.
Idle capacity from AI/ML training cannot substitute for serving locality. An idle accelerator still lacks the required prefix.
That distinction makes routing telemetry essential. Collect telemetry from every routing decision: - Request-to-route time - Selected-worker queue depth - Cache-hit outcome - Fallback frequency - Metadata age, where the installed release supports it
Without these traces, a fallback loop looks like healthy traffic.
That dependence creates a counterintuitive risk. The strategy that creates the most cache hits can also concentrate demand on the same workers.
Warm Caches Can Turn Into Hotspots
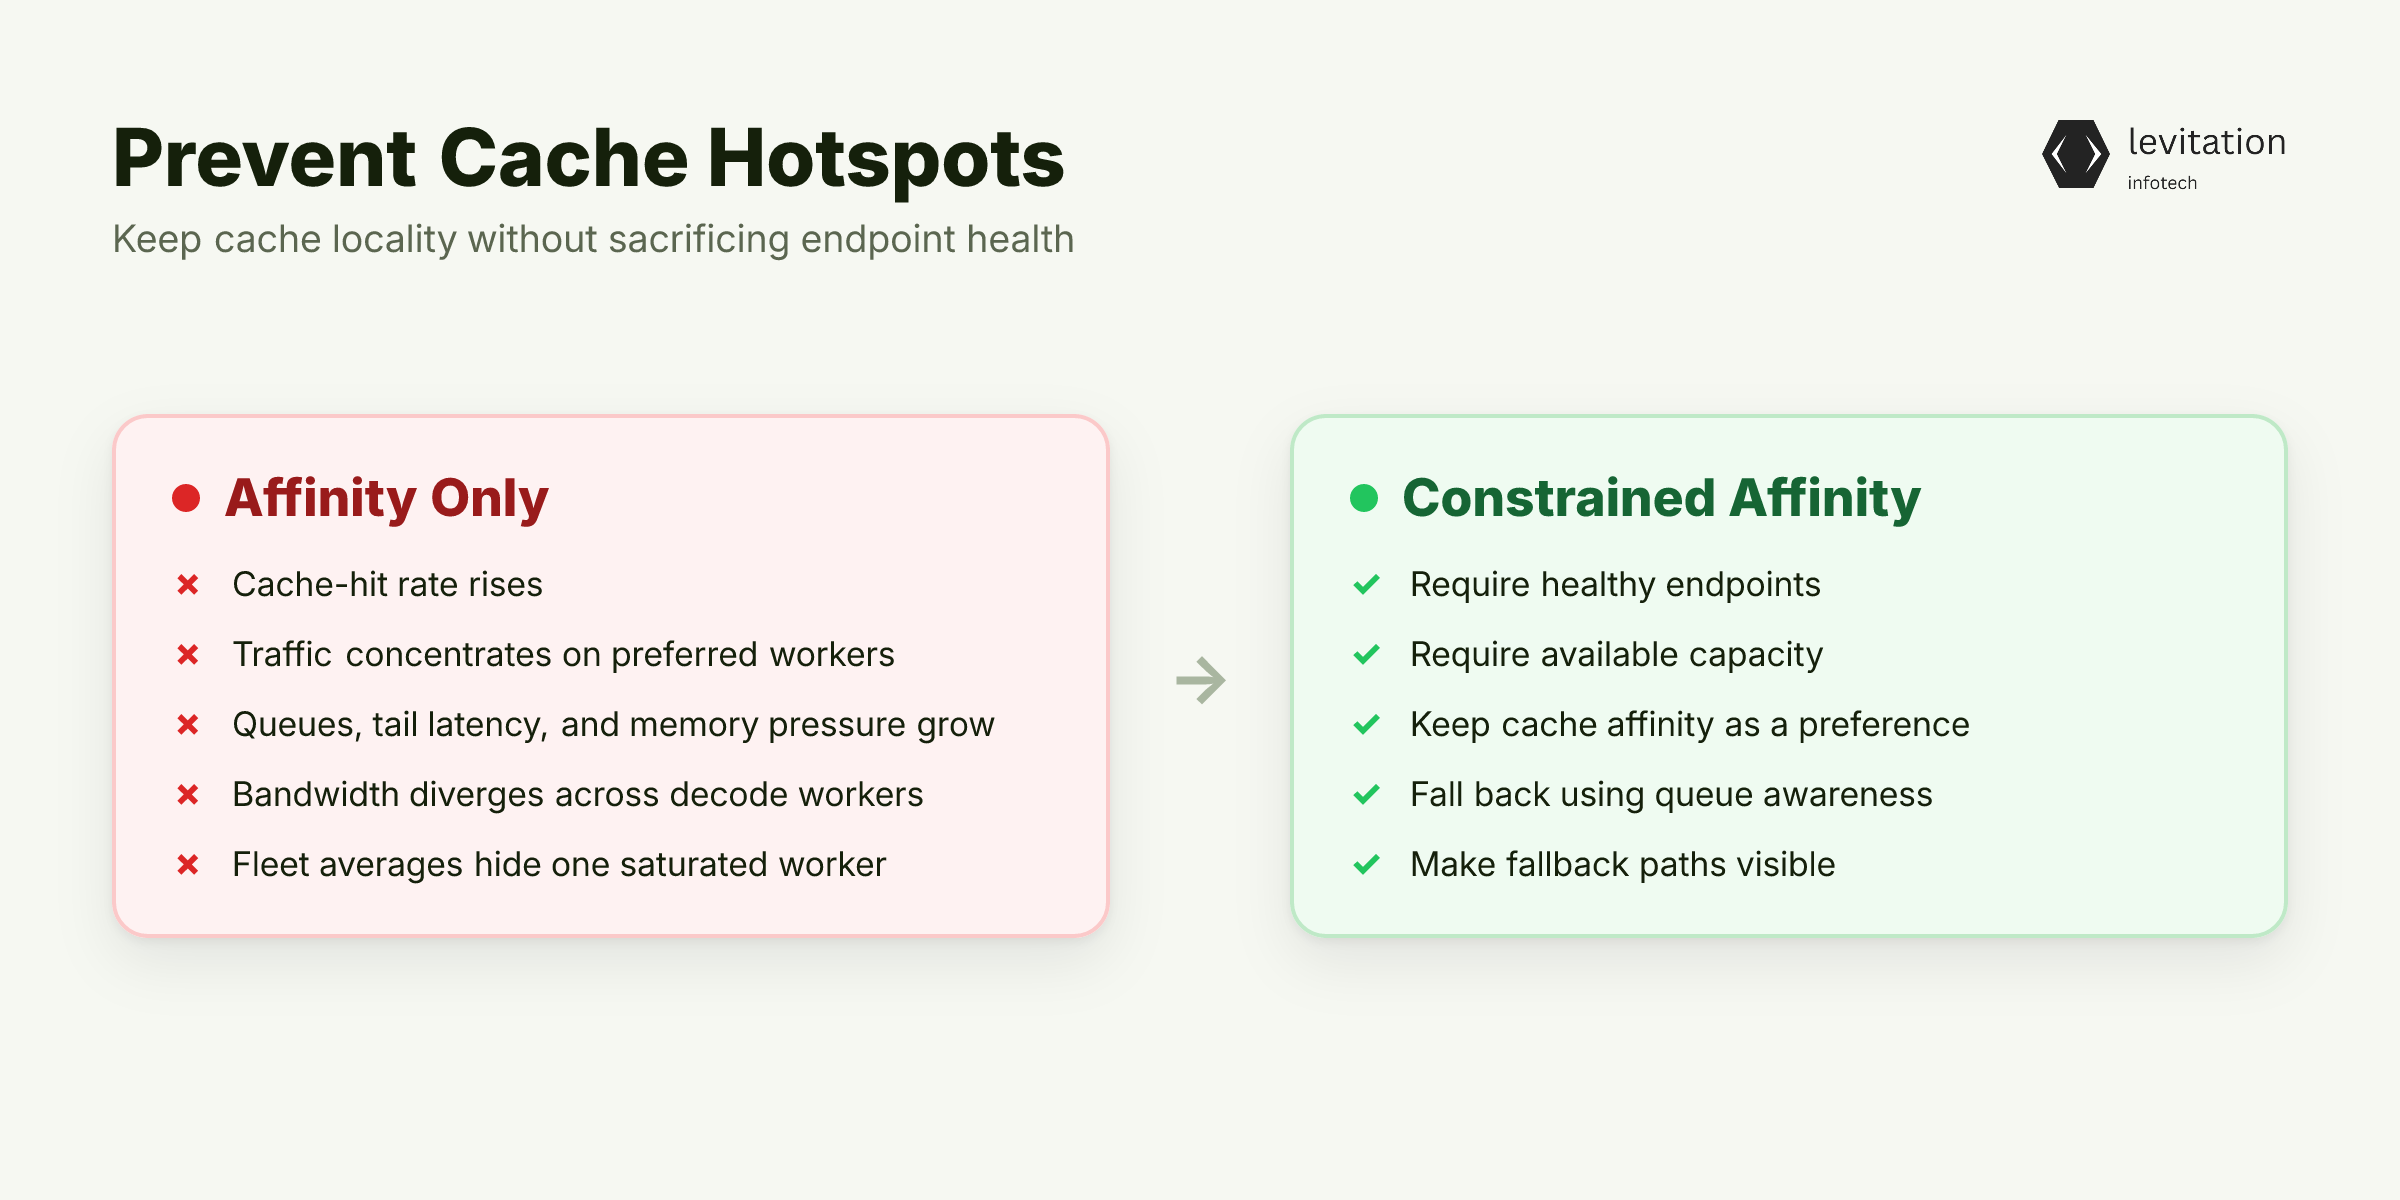
A warm cache does not guarantee a healthy endpoint.
Shared prefixes, repeated agent contexts, and common system prompts can favor a small worker group during bursts. Cache-aware routing then improves hit rate while concentrating queues, decode latency, and memory pressure.
The safe policy separates constraints from preferences:
1# Policy intent, not literal llm-d configuration.2affinity:3 cache_match: prefer4 require_healthy: true5 require_capacity: true6 fallback: queue_aware
The policy order matters. Health and capacity are constraints; cache affinity is an optimization. Affinity without constraints can turn the best cache into the worst queue.
This failure mode is testable. Look for these diagnostic signatures: - Cache-hit rate rises while decode tail latency worsens - The preferred worker develops a growing queue - Fallback frequency increases after affinity selection - Bandwidth utilization diverges across decode workers - Requests repeatedly return from the same fallback path
When teams build enterprise AI solutions, fleet-wide averages can hide one saturated decode worker beside unused capacity. Aggregate GPU utilization is supporting evidence, not proof of balance.
Disaggregation does not eliminate this problem. Separate prefill and decode pools can improve phase specialization while routing still needs to respect downstream capacity.
The design principle is simple: preserve cache affinity while making health, capacity, and fallback conditions explicit. The solution is not to disable cache-aware routing; instead, operate affinity as a controlled optimization with visible fallbacks.
A safe rollout must compare two worlds, not two anecdotes: does cache affinity still win when queues, bandwidth, and fallbacks change under load?
Build KV-Aware Routing With a Safe Fallback Ladder
Deploy a version-matched llm-d stack with vLLM or SGLang. Keep prefill and decode separate where workload evidence supports it. Capture queue-only routing before enabling cache affinity.
The same release discipline matters in AI/ML training, where engine and scheduler versions can change behavior. For teams evaluating enterprise AI solutions, a reproducible baseline separates stack behavior from model improvements.
Start with four controls: - Pin the llm-d, gateway, and model-server versions. - Preserve separate prefill and decode pools. - Record a queue-only routing baseline. - Replay shared, cold, and mixed prefix traffic.
Verify that the gateway receives queue depth, KV-cache events or utilization, and prefix ownership. Expose metadata age and routing traces when the installed release supports them.
Because release syntax differs, the official guide for your pinned tag is the source of truth. This pseudoconfiguration shows policy intent rather than invented flags:
1# Pseudoconfiguration, not literal llm-d YAML.2# Translate each concept into the installed release's API.34pools:5 prefill:6 workload: prefill-serving7 phase: prefill8 decode:9 workload: decode-serving10 phase: decode1112routing:13 preference: - healthy worker with exact prefix match - healthy worker with compatible prefix match - healthy queue-aware worker14 reject: - unhealthy targets - saturated targets15 fallback_limit: 116 escape_hatch: queue-only
The fallback ladder should remain explicit:
- Prefer a healthy, prefix-matching worker with capacity.
- Fall back to a less specific cache-affinity match.
- Use a queue-aware worker when the preferred cache is unavailable or saturated.
- Bound each fallback so stale metadata cannot create a retry storm.
Test shared-prefix, cold-prefix, and mixed traffic with bursty arrivals. Track end-to-end and decode-phase tail latency, MBU, cache-hit rate, queue depth, prefix ownership, routing latency, and fallback rate. Treat GPU utilization as supporting evidence, never as the deciding metric.
Inspect the cluster with standard commands:
1kubectl get pods -n llm-d -o wide2kubectl top pods --containers -n llm-d3nvidia-smi dmon
CLI output shows pods, resource use, and device activity. Application telemetry must connect the chosen route to phase-level latency.
Operational guardrails should reject unhealthy or saturated targets and bound retries. Use canaries for policy changes. Preserve an escape hatch to queue-only routing and keep the main workflow cloud-neutral.
Once routing is measured as a critical path rather than a black box, the business case becomes easier to defend. The remaining question is which signals belong in the production scorecard.
Measure the New Critical Path, Not the Old Dashboards
The payoff is operational, not another peak number.
The fastest inference path becomes dependable when the team balances decode bandwidth, cache locality, routing freshness, and fleet capacity. It cannot depend on one optimized metric.
Use a scorecard covering: - End-to-end and decode-phase tail latency - Model Bandwidth Utilization - Cache-hit rate by prefix class - Routing latency and metadata age - Selected-worker queue depth - Fallback and retry rates - Work concentration across decode workers
Procurement should ask for end-to-end SLO behavior under realistic prefix reuse, traffic bursts, and model-server failures. Peak throughput does not answer those questions.
This extends the argument against peak-only inference dashboards. The team must distinguish a slow model from a slow route. They must also separate a cold cache from a saturated worker and a compute constraint from a memory-bandwidth constraint.
A credible enterprise AI solutions evaluation should separate delivery credibility from product benchmarks. The same discipline applies when AI/ML training and serving share an operating boundary.
Product benchmarks must still establish routing quality, tail latency, and operational fit. Delivery history cannot replace workload-specific evidence.
The scorecard turns speed into a production promise. Can the system keep that promise when the preferred cache, worker, or route disappears?
Frequently Asked Questions
Q: What is the main bottleneck in llm-d inference?
A: Decode is often memory-bound because each token requires reading model weights and an expanding KV cache. Once llm-d routes around queueing, cache locality, routing correctness, and memory bandwidth can become the limiting factors in the critical path.
Q: Does KV-cache-aware routing always reduce inference latency?
A: No. It can improve cache hits and throughput, but strong affinity may concentrate requests on a few workers. Healthy endpoints, downstream capacity checks, and queue-aware fallbacks are necessary to protect tail latency.
Q: Why is GPU utilization not enough for production AI inference?
A: High GPU utilization can hide memory-bandwidth saturation, uneven queues, and underused replicas. Pair it with Model Bandwidth Utilization, cache-hit rate, routing latency, queue depth, and phase-level tail latency.
Q: How does llm-d differ from vLLM and SGLang?
A: vLLM and SGLang are model-serving engines, while llm-d is a Kubernetes-native distributed inference stack built above engines such as those. Its distinctive layer is orchestration across workloads, including disaggregated serving and KV-cache-aware routing.
Q: How should a CTO evaluate KV-cache routing?
A: Compare cache-aware routing with a queue-only baseline using shared-prefix, cold-prefix, mixed, and bursty traffic. Track latency, bandwidth utilization, cache hits, queue depth, fallback frequency, and routing concentration rather than relying on GPU utilization alone.
About the author
Mayank Singh is a software developer at Levitation Infotech, where he builds web and AI-powered applications across the company’s fintech, healthcare, and enterprise projects.