

TL;DR: Traditional MLOps dashboards monitor containers, not reasoning. AI agents can run, return HTTP 200, and answer users for hours. All while hallucinating, burning tokens, or skipping tool calls that matter. The fix is a new observability layer that traces decisions, caps token spend, and validates outputs semantically. It is not a better Grafana panel.
Key Takeaways: - An agent can be fully "up" and functionally wrong. Semantic failure has no HTTP status code. - Agent latency is structurally non-stationary, so p99 thresholds either page constantly or miss real slowdowns. - Cost explosions look like working requests, not errors. You need per-session token budgets and step-count limits.
The 3am Incident Your Dashboard Will Never Page You On
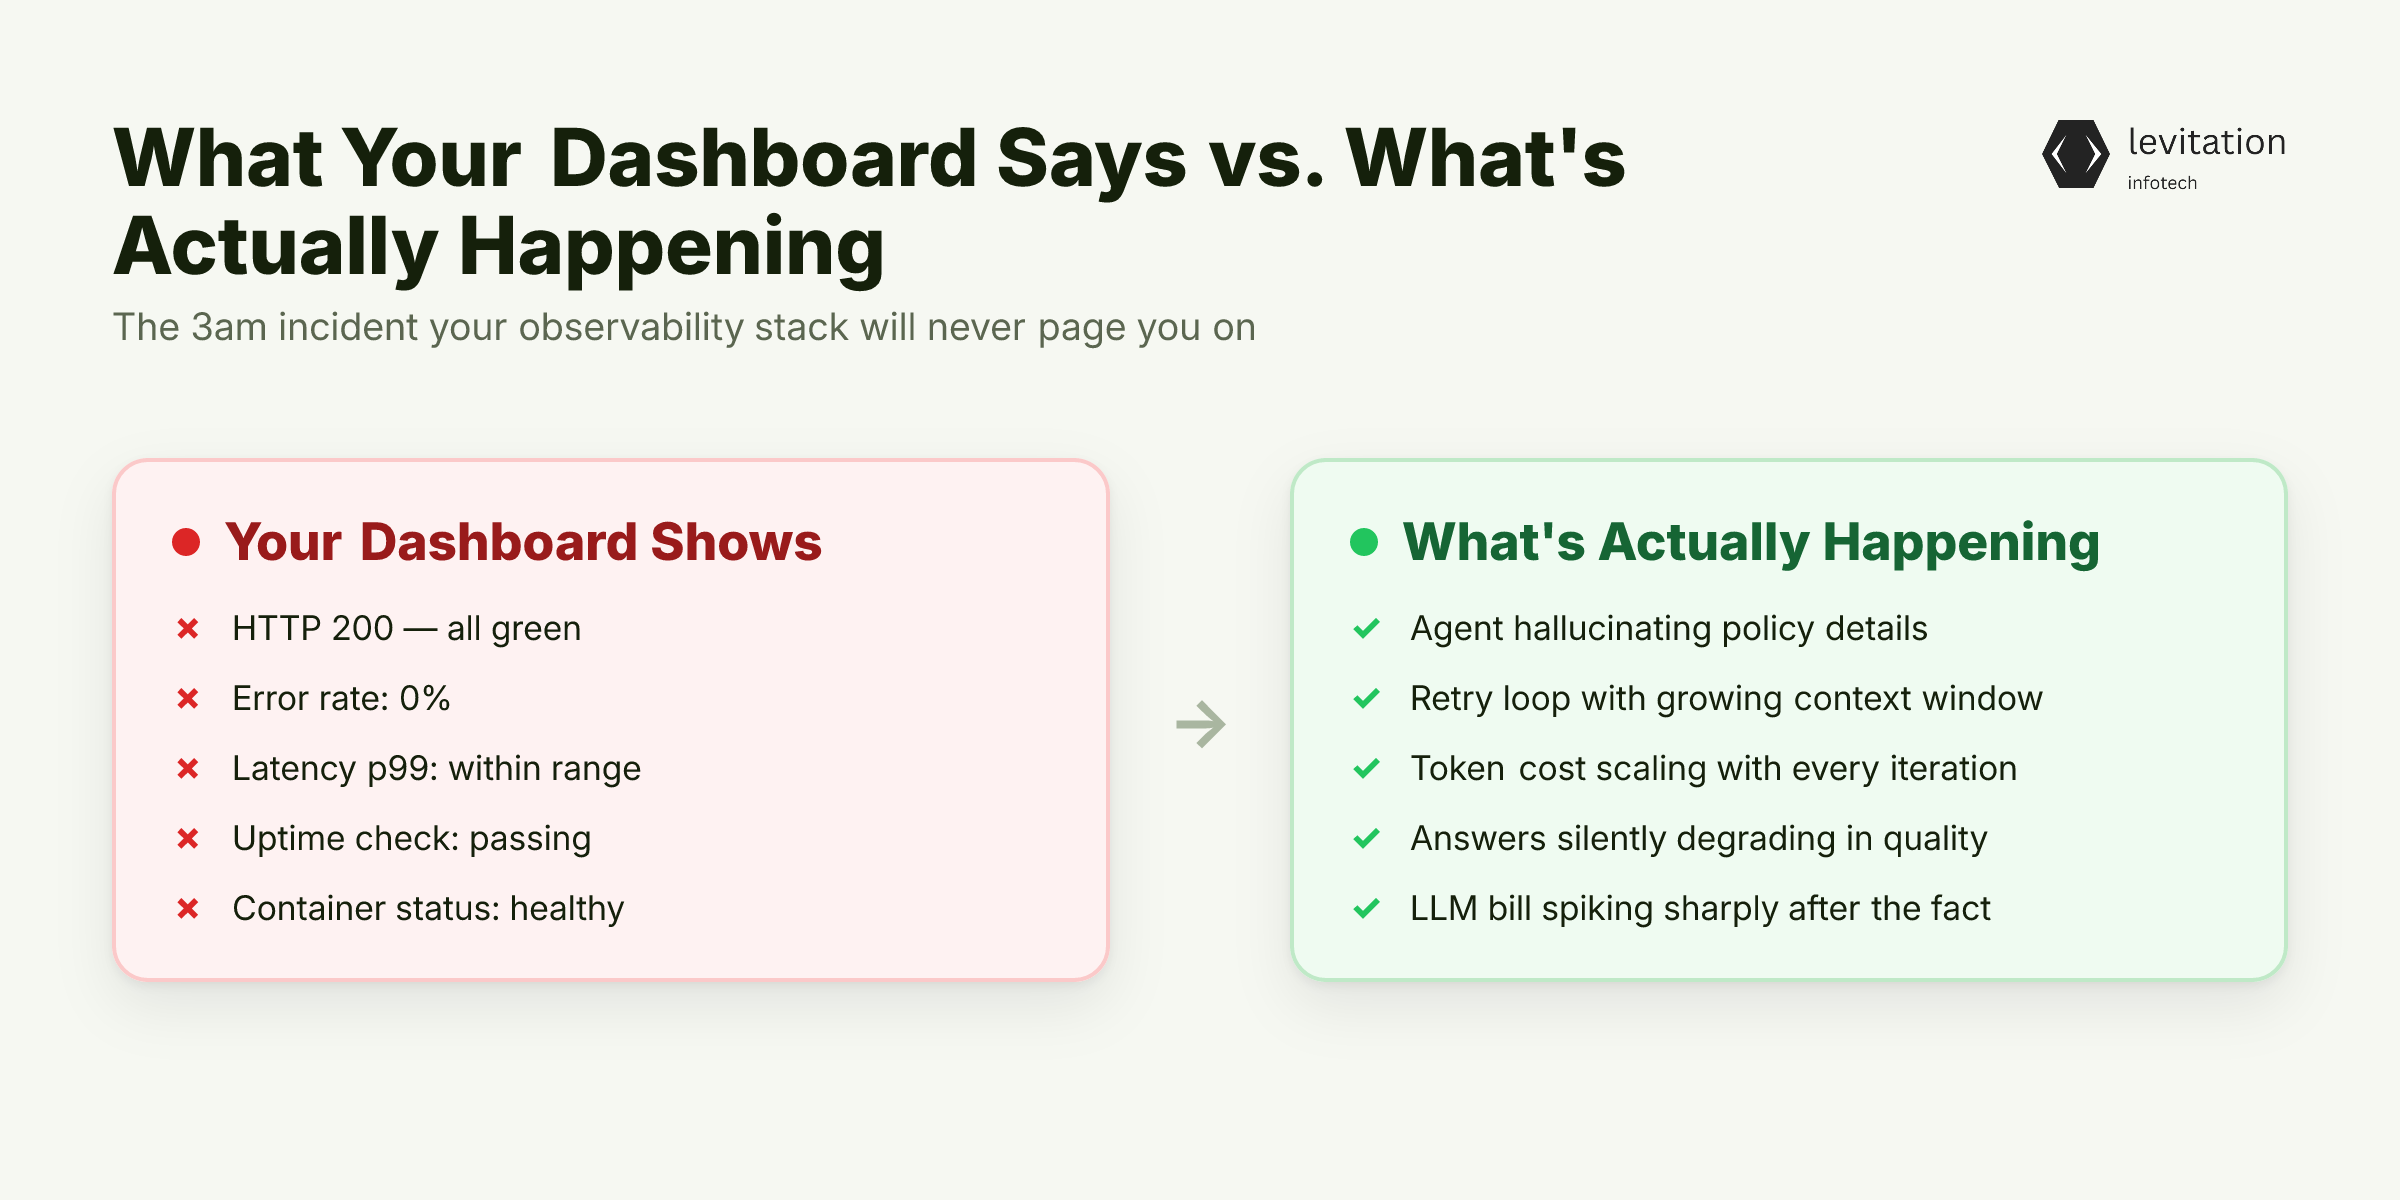
Your AI agent can be running, returning HTTP 200, and answering users. Meanwhile, it's hallucinating policy details that will cost your company a compliance incident. Your Grafana dashboard will show green the entire time.
Picture a retrieval-augmented support agent that hits a flaky vector index. The retrieval step returns an empty chunk set. The agent, designed to self-correct, loops back, reformulates the query, and tries again. Each retry expands the context window because the agent appends the prior turn to its prompt.
After repeated loops, every request consumes a token budget that scales with each iteration. The appended context compounds. The LLM endpoint returns 200. The orchestration layer logs success. The agent keeps answering customers, just at a proportionally higher cost and with a steadily degraded context.
Your uptime check sees nothing wrong. Your error rate is zero. Your latency p99 is technically within range because each individual call returned fast.
You have a healthy container hemorrhaging money. It's producing subtly worse answers every minute. The only signal is a finance alert after the fact. That alert shows the LLM bill spiked sharply.
This is not an edge case. Common agent failure shapes include: - Retry loops hitting an LLM endpoint with growing context windows - Prompt template changes that nudge the model toward maximum token generation - Chains that recursively call themselves when a tool returns ambiguous data - Agents that skip mandatory tool calls and answer from prior knowledge
In Your AI Agent Calls a Tool. Your Audit Trail Goes Dark., the audit story is just as broken as the monitoring story. The uncomfortable truth is that your existing observability stack was never designed to catch this. To see why, you have to look at what MLOps dashboards were actually built to measure.
MLOps Observability Was Built for Predictable Inference, Not Reasoning Chains
Traditional ML systems follow a tidy contract. Input arrives, the model produces a prediction, the prediction goes out.
The system is shaped like a function call. The metrics that govern it (uptime, p99 latency, throughput, drift) measure the wrapper around that function. They tell you whether the container is alive, whether the queue is draining, and whether the distribution of inputs has shifted.
Agentic systems do not follow that contract. An agent reasons about what to do, picks a tool, calls it, evaluates the result, and may revise its plan mid-execution. The path through the system is chosen by the model at runtime, not by the developer at deploy time.
Two requests that look identical to a load balancer can take different routes. They travel through your cloud infrastructure. The agent may call a different tool, retrieve a different document, or backtrack and retry.
The metrics that worked for model serving measure the container, not the reasoning. An agent's behavior can shift completely without any model change, retraining event, or deployment. The same model weights can produce different tool sequences and outputs later. Why? Because the prompt distribution drifted, the tools changed, or the downstream APIs the agent calls started returning different shapes.
Your devops dashboard does not notice, because nothing about the deployment changed.
This shape mismatch is structural, not cosmetic: - MLOps instruments the model serving layer. AgentOps must instrument the reasoning layer. - MLOps assumes one model call per request. Agents fan out into many calls whose count depends on the model's runtime choices. - MLOps drift detection works on input features. Agent drift happens in the plan, not the input.
This mismatch produces three concrete failure modes that slip past every green dashboard. The first one is the hardest to detect because the agent looks successful.
Reason #1: Your Agent Can Be 'Up' and Completely Wrong
A support agent hallucinates a refund policy that does not exist. An incident-triage agent misclassifies a P1 outage as a P3 and routes the on-call wrong.
An invoice-processing agent approves an amount that is off by a digit because the LLM "rounded." A code-generation agent returns a function that parses but produces wrong results in edge cases.
Every single one of these steps returned successfully. Your service mesh sidecar logged clean 200s. Your error budget is intact.
The failure is semantic, not technical. Semantic failure has no HTTP status code. The orchestration layer cannot tell the difference between a correct answer and a confidently wrong one. Both arrive as well-formed strings from a model that was asked to generate them.
Your dashboard is green. Your customer is reading a hallucinated policy. The error will surface as a support ticket much later, not as an alert tonight.
If semantic failure is hard to detect, you'd think latency would at least give you a signal. It won't, and here's why.
Reason #2: Agent Latency Has No Stable Baseline
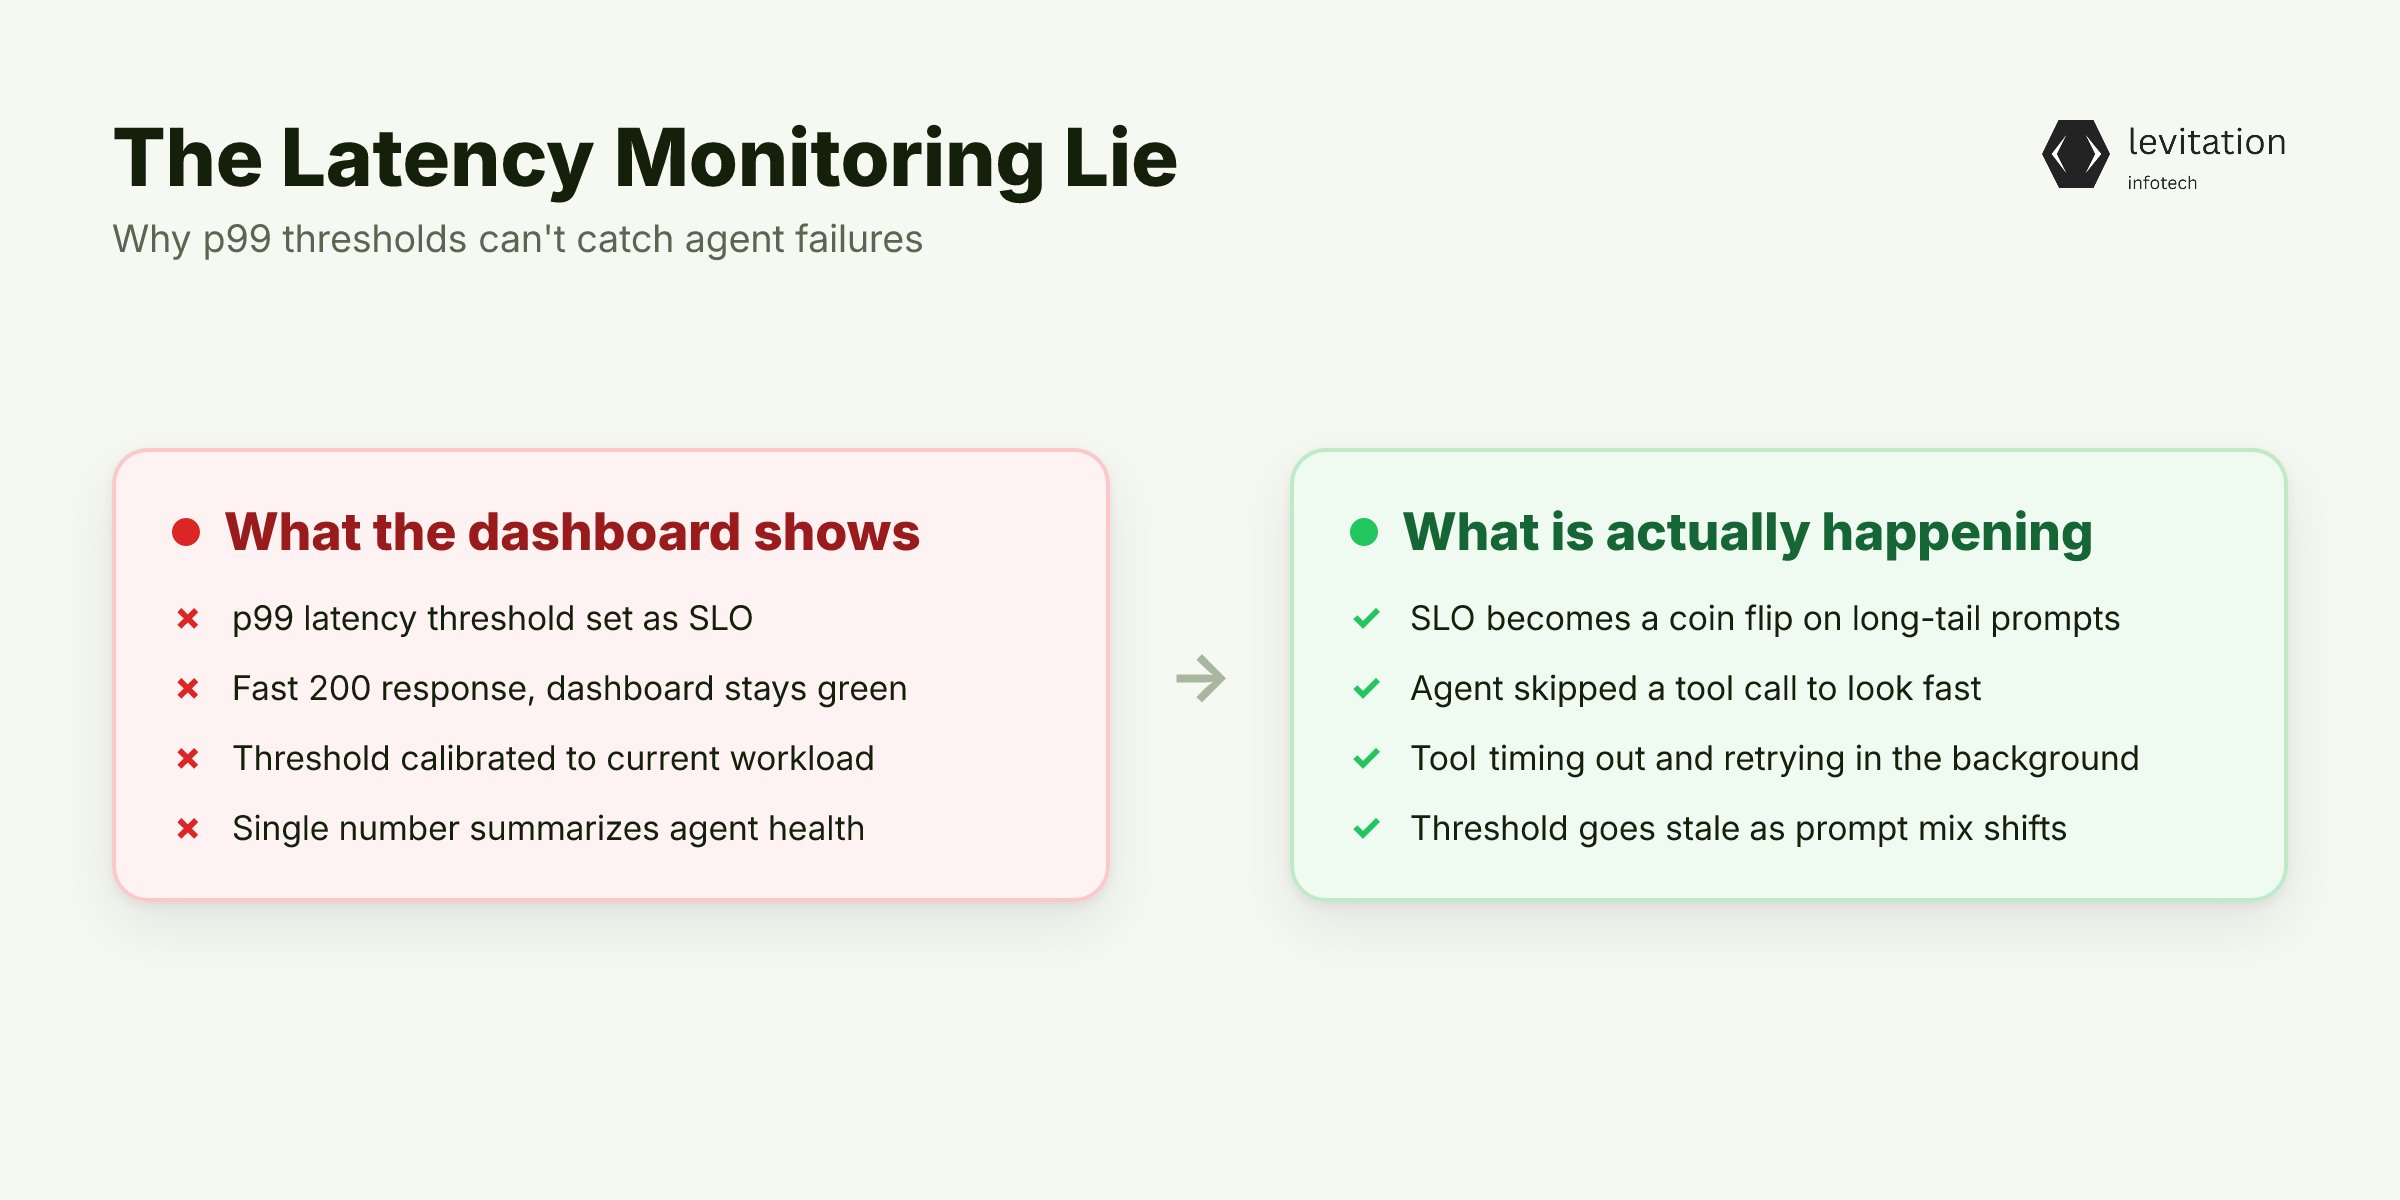
Agent latency is not just variable. It is structurally non-stationary. Reasoning depth, tool selection, retrieval results, and plan revisions all change per request.
Two prompts that differ by one word can produce short versus long execution paths. The p99 of a multi-step trajectory is several times the p99 of a single-step one.
An SLO built on a p99 latency threshold becomes a coin flip. Either you set it loose and the page fires every time a long-tail prompt hits a slow retrieval. Or you set it forgiving and a real degradation never crosses the line. The agent might be silently taking much longer because a tool is timing out and retrying.
Worse, the distribution shifts each time the prompt mix shifts. The threshold you calibrated becomes meaningless as the workload evolves.
Even a "fast" response can be a problem. If the agent skipped a tool call it should have made, your kubernetes pod returned a 200 in record time. Your latency dashboard celebrated. The clean execution and the broken shortcut look identical to anything measuring wall-clock duration.
In Why Your Observability Stack Is Lying About Kubernetes Health, the same shape of lie happens at the infrastructure layer. Agents just produce a more expensive version of it.
Latency at least produces a number. The third failure mode produces no number at all. It just produces a bill.
Reason #3: Cost Explosions Don't Look Like Errors
Three patterns drive most agent cost blowups, and none of them surface as errors: - A prompt template change nudges the model toward longer, more thorough responses and per-token spend grows with each request. - A retrieval step returns low-quality chunks, the agent self-corrects, and the same request burns through repeated rounds of context as retries compound. - A tool returns an error, the agent retries with an expanded context window to "explain" the failure, and each retry costs more than the last.
None of these produce a 5xx. They produce a working agent that consumes a token budget that balloons with each retry. The agent answers correctly, incorrectly, or somewhere in between.
Cost is a first-class operational signal for agents. It plays the same role CPU and memory did for traditional services. Most MLOps stacks have no equivalent circuit breaker.
Your iam policy will let the agent call the LLM provider in rapid succession without blinking. That's because the policy was written for engineers, not for reasoning loops.
The bill arrives at the end of the month, not in the dashboard. By then the damage is done. The only forensic trail is a pile of LLM provider logs nobody instrumented for.
As covered in Agentic AI Is Quietly Building Your Next Outage, the same shape of silent drift that no existing alert catches shows up there as well.
So if uptime, latency, and error rate are the wrong three signals, what should platform engineers actually instrument?
Instrumenting for AgentOps: Traces, Tokens, and Decision Paths
The shift is from monitoring requests to monitoring reasoning. A working AgentOps layer captures the full execution trace for every run. The trace includes every reasoning step, every tool call, every retrieval query, and the order in which they happened.
Not just the final response. Not just the wall-clock duration. The trace must include the plan the agent committed to at each branching point. That way you can replay a bad trajectory and see where the reasoning went wrong.
Three layers matter: - Per-step telemetry. Record token usage, latency, and the chosen action for every step in the chain. Aggregate per session, not per request, because the cost and the failure live at the session level. - Hard ceilings. Per-session token budgets, per-request cost caps, and step-count limits that kill runaway chains before they reach the LLM provider. A circuit breaker for agents looks like a token bucket, not a CPU throttle. - Semantic checks. Sampled human review of agent outputs, automated validators for high-stakes fields like amounts, severities, and policy references, and golden-path regression suites for the top agent trajectories. This is where observability meets zero trust. Every output is treated as untrusted until validated, because the agent has no contract to be correct.
Teams that have shipped agents into regulated production have already built this layer. The observability layer was designed for reasoning, not just requests, to pass review. So what changes once you have it?
What Changes When You Monitor Reasoning, Not Just Requests
The operational difference shows up fast. Incidents get caught quickly because the trace shows the agent looping, not the LLM endpoint failing.
Cost variance compresses because token budgets turn silent burn into visible throttling. The throttling shows up at the dashboard, not at the monthly bill.
Engineering teams get a feedback loop for prompt and tool design. The same trace that catches failures also reveals which reasoning patterns actually drive correct outcomes.
The engagement model matters too. Platforms that treat observability as a first-class layer, not a Grafana plugin, tend to ship faster. The same primitives that surface failures also speed up iteration on prompts, tools, and trajectories.
Underneath it all sits a zero-trust posture. It treats every tool call, every retrieval, and every reasoning step as a potential failure surface.
The same mtls discipline that secures your service-to-service traffic has to extend to your agent-to-tool calls. Otherwise the audit trail ends the moment reasoning begins.
This is not optional work. It is the difference between an agent you can run briefly and one you can run reliably in production for the long haul.
Frequently Asked Questions
What is AgentOps observability?
AgentOps observability is the practice of monitoring AI agents' reasoning behavior, tool usage, and multi-step execution paths in production, not just the API calls that wrap them.
It extends MLOps by adding traces of decision-making, per-step token costs, and semantic output validation. Those join traditional metrics like latency and error rate.
How do you monitor LLM agents in production?
You capture full execution traces for every agent run. Each trace covers each reasoning step, tool call, retrieval query, and branching decision, with token usage and latency per step.
You also set cost ceilings, step-count limits, and sampled semantic checks on outputs. Uptime and error rate alone will miss functional failures.
What metrics matter for AI agent observability?
Beyond standard service metrics, you need per-session token consumption, tool-call success rates, reasoning step counts, plan-revision frequency, and semantic correctness on sampled outputs. Cost-per-task and trajectory diversity are also leading indicators of agent drift that traditional MLOps dashboards do not surface.
How do you catch AI agent hallucinations in production?
You cannot catch them with infrastructure monitoring. The practical approach is a layered one: automated validators for high-stakes fields, sampled human review, golden-path regression tests against known-good trajectories, and grounding checks that compare agent claims against retrieved source content.
Why is monitoring AI agents harder than monitoring ML models?
ML models have a fixed input-output contract. Agents choose their own path, call external tools, and revise their plans mid-execution.
The same model weights can produce very different behavior over time. A fully successful technical execution can still produce a semantically wrong answer. That failure has no HTTP status code.
About the author
Mayank Singh is a software developer at Levitation Infotech, where he builds web and AI-powered applications across the company’s fintech, healthcare, and enterprise projects.