


TL;DR: MLOps tools rarely deliver the 10x productivity their sales decks claim. Real gains land closer to 1.5x to 2x, and the 3x cost curve hits when infrastructure, integration, and people compound together. A structured 90-day cost audit and a three-metric ROI framework are the only way to see it coming before the renewal arrives.
Key Takeaways: - Independent benchmarks show AI/ML tooling delivers 1.5-2x productivity at best, not 10x, and closer to 10% in many real deployments - The 40% cost reduction claim collapses the moment you add GPU hours, storage, and senior engineer time to the license fee - Workload-level cost tagging and a cost-per-deployed-model dashboard expose the 3x curve before finance gets blindsided
The 10x Promise Died in Production. The 3x Cost Curve Is Just Getting Started.
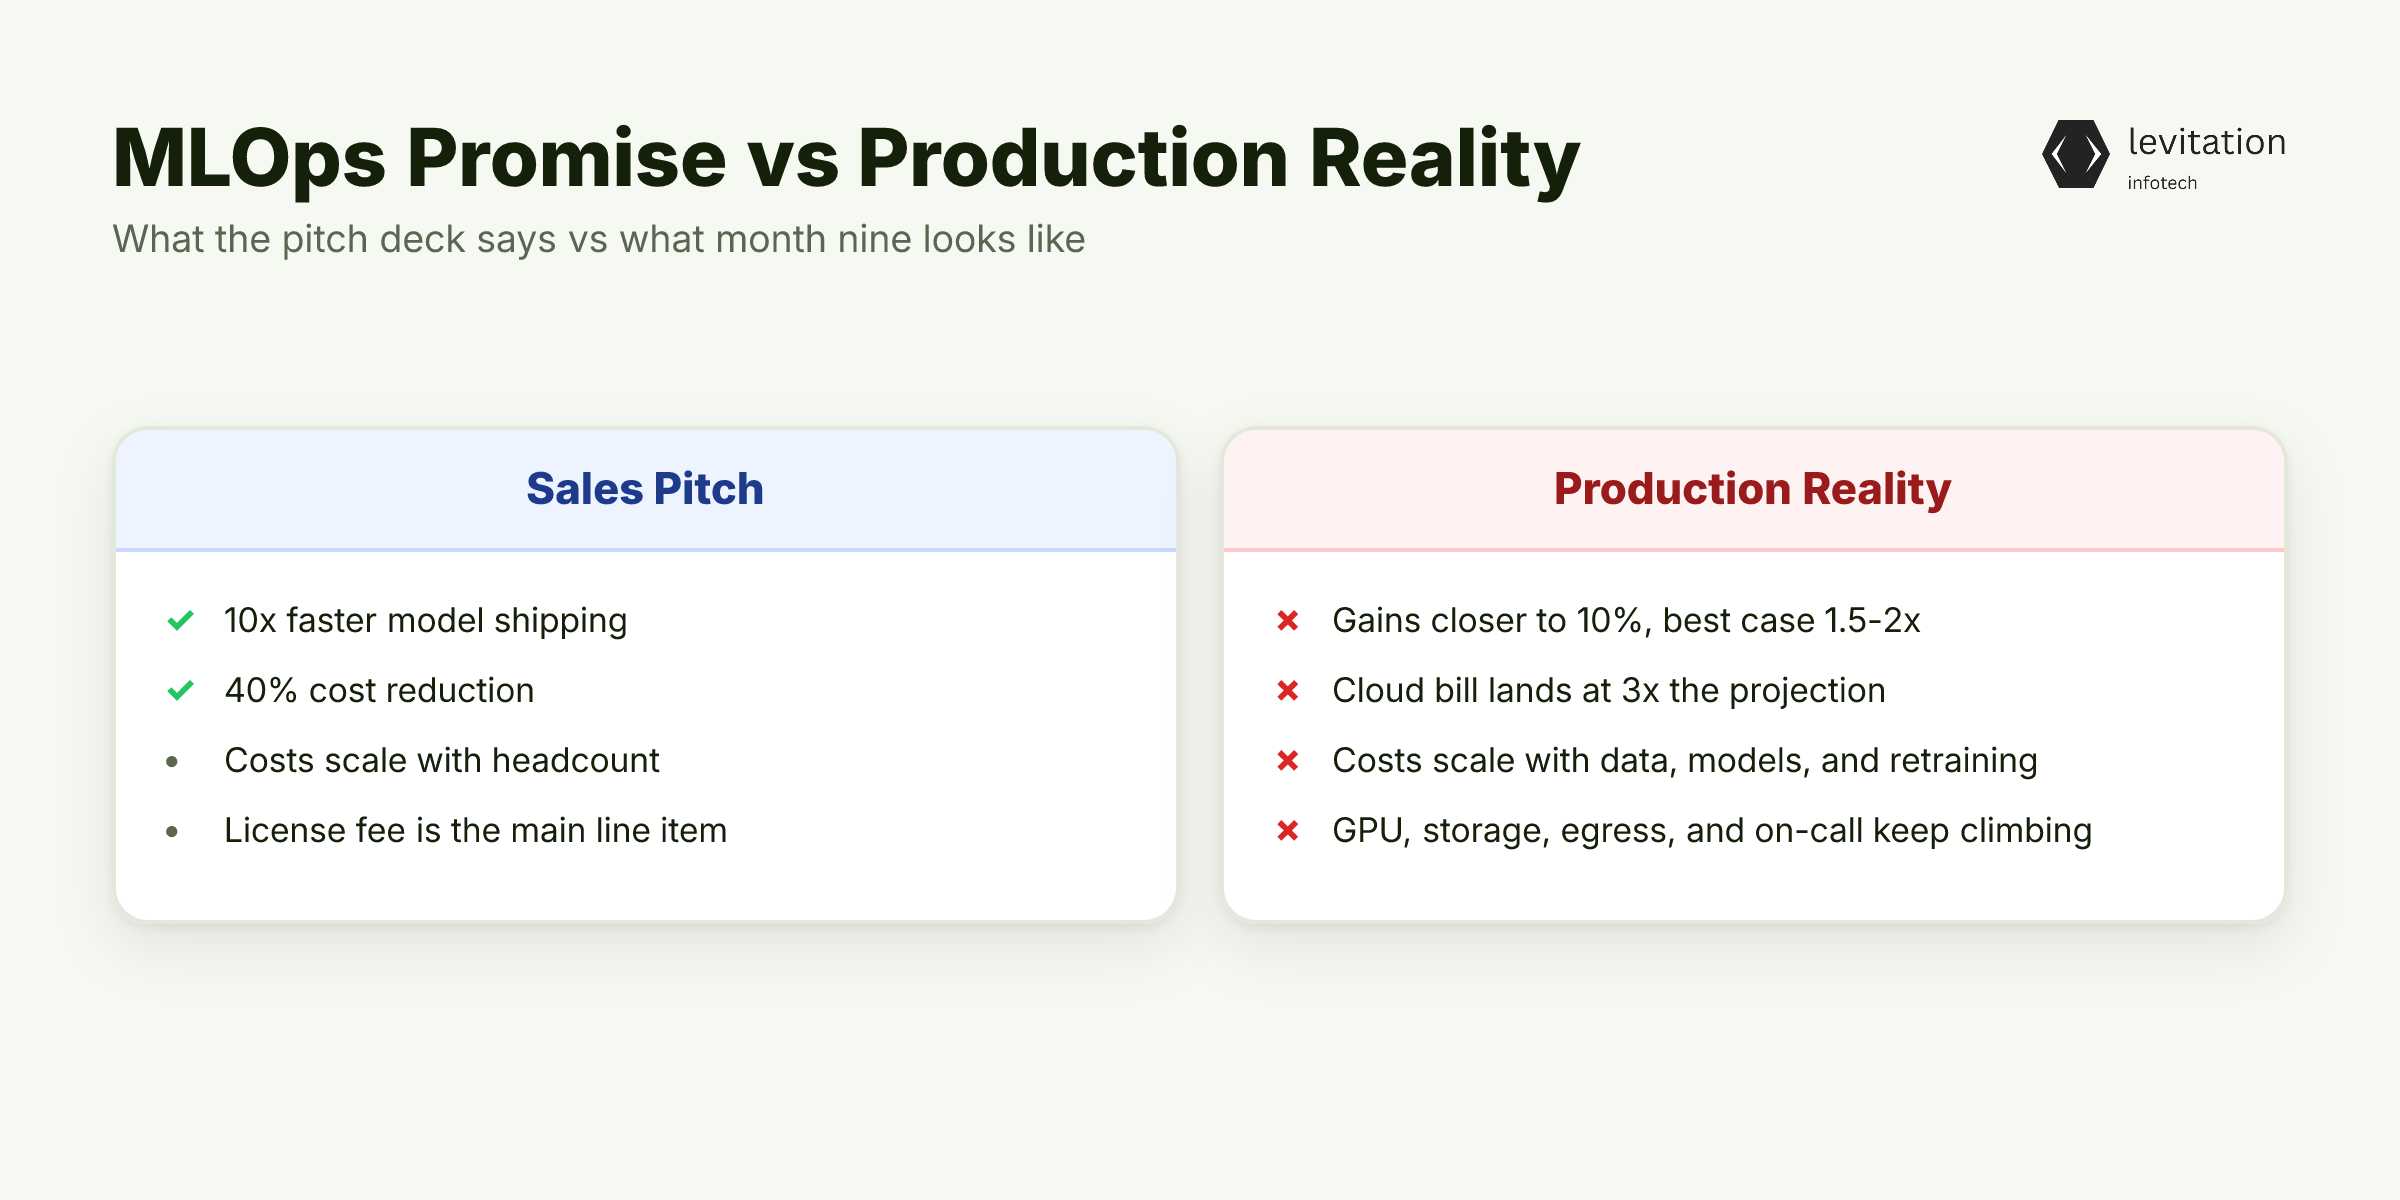
Your MLOps vendor's ROI deck says you'll ship models 10x faster. Twelve months in, your cloud bill is 3x the projection and your data scientists are still debugging pipelines at midnight. The math isn't broken. It's just missing three line items nobody put in the proposal.
The gap between promised productivity and actual results is wider than the sales cycle that closed the deal. LeadDev's reporting on AI productivity gains shows the 10x number survives almost no contact with measurement; real outcomes land closer to 10% in many deployments, and 1.5-2x in the best cases. A year-long personal measurement study found the same pattern: tooling helps, but the multiplier is modest and conditional on disciplined use.
The promised cost reductions follow a similar arc. When CTOs are asked honestly whether they see the 40% savings that MLOps platforms promise, the answer is almost always no. The number survives in pitch decks because it sounds defensible. It dies in finance reviews because the actual line items (GPU, storage, egress, on-call) keep climbing.
Here's the contradiction that lands on the Engineering VP's desk: the tool was approved to save money and accelerate delivery. By month nine, both metrics are moving the wrong direction. Productivity gains stay modest while the cost curve climbs non-linearly, because MLOps stacks scale with data volume, model count, and retraining frequency, not with headcount. More predictions means more GPU-hours. More retraining means more storage. More models means more drift remediation.
This is the pattern our MLOps cost benchmarking work keeps surfacing. The sticker price on the quote is the visible tip of an iceberg finance is only now learning to read.
So where does the 3x actually come from? It's not the license fee; that's the smallest of three cost layers hiding inside every MLOps stack.
The Three Cost Layers Hidden Inside Every MLOps Stack
Most MLOps proposals look like a single line item: annual license. Finance approves against that number. Twelve months later, the real bill is roughly three times larger because nobody modeled the layers underneath.
Layer 1 - Licensing. The sticker price is the only number anyone negotiates. It's also the smallest line item by month 12. License costs grow modestly, typically per seat, per model, or per prediction volume, and the growth feels predictable.
Layer 2 - Infrastructure. This is where the 3x curve lives. GPU hours for training and inference scale with model complexity and request volume. Feature stores and model artifact storage grow as adoption spreads. Egress fees compound every time a prediction crosses a region or a vendor boundary. None of this appears on the vendor quote because it's billed by your cloud provider, not the MLOps vendor.
A simple illustration of the tagging problem:
1# Kubernetes namespace labels for cost attribution2metadata:3 labels:4 cost-center: ml-platform5 ml-workload-type: inference6 model-name: fraud-detector-v37 team: payments-risk8 environment: production
Without labels like these, your finance team can't trace a GPU spike to a specific model or experiment. The bill becomes unattributable noise.
Layer 3 - People. The engineers, SREs, and platform owners required to keep the stack alive. Most teams underestimate this because headcount isn't in the tool quote. The Datatron analysis on open-source MLOps dirty secrets confirms the broader pattern: the people cost quietly rivals or exceeds the license cost once integration and maintenance are priced in.
Each layer reinforces the others. More models drive more infrastructure. More infrastructure drive more on-call. More on-call drives more tooling. More tooling drives more licensing. The loop is self-reinforcing, and the curve bends faster than any spreadsheet predicted.
Our MLOps hidden cost layers breakdown maps each layer to its cost driver and the metric that catches it. If the three-layer model is the disease, open-source MLOps is the most expensive supposed cure on the market.
Why Open-Source MLOps Is the Most Expensive Free Software You'll Buy
The "no license fee" pitch keeps budget approval alive while the integration bill silently triples. Open source doesn't remove cost; it relocates it from a vendor invoice to an internal payroll.
Stitching together MLflow, KubeFlow, Airflow, Feast, and a feature store consumes months of senior engineer time before a single model reaches production. The integration work isn't optional glue. It's the system. And once it's built, the person who wrote it becomes a bus factor of one.
The lock-in problem doesn't disappear with open source; it shifts from a vendor contract to whoever understands the custom pipeline. When that engineer leaves, the replacement cost dwarfs any annual license the commercial alternative would have charged.
What the data shows: - The 40% cost reduction claim from open-source MLOps assumes integration cost is zero - Real-world TCO meets or exceeds commercial alternatives once integration and maintenance are priced in - Bus factor risk on the glue-code author is a common and often underestimated failure mode
Our open source vs commercial MLOps analysis walks through the math on both sides. The bottom line: free isn't free once you add the integration tax.
That explains why the cost curve bent the wrong way. The harder question is: what ROI formula actually predicts it before you sign the next contract?
The Real MLOps ROI Formula: Three Numbers You Should Demand
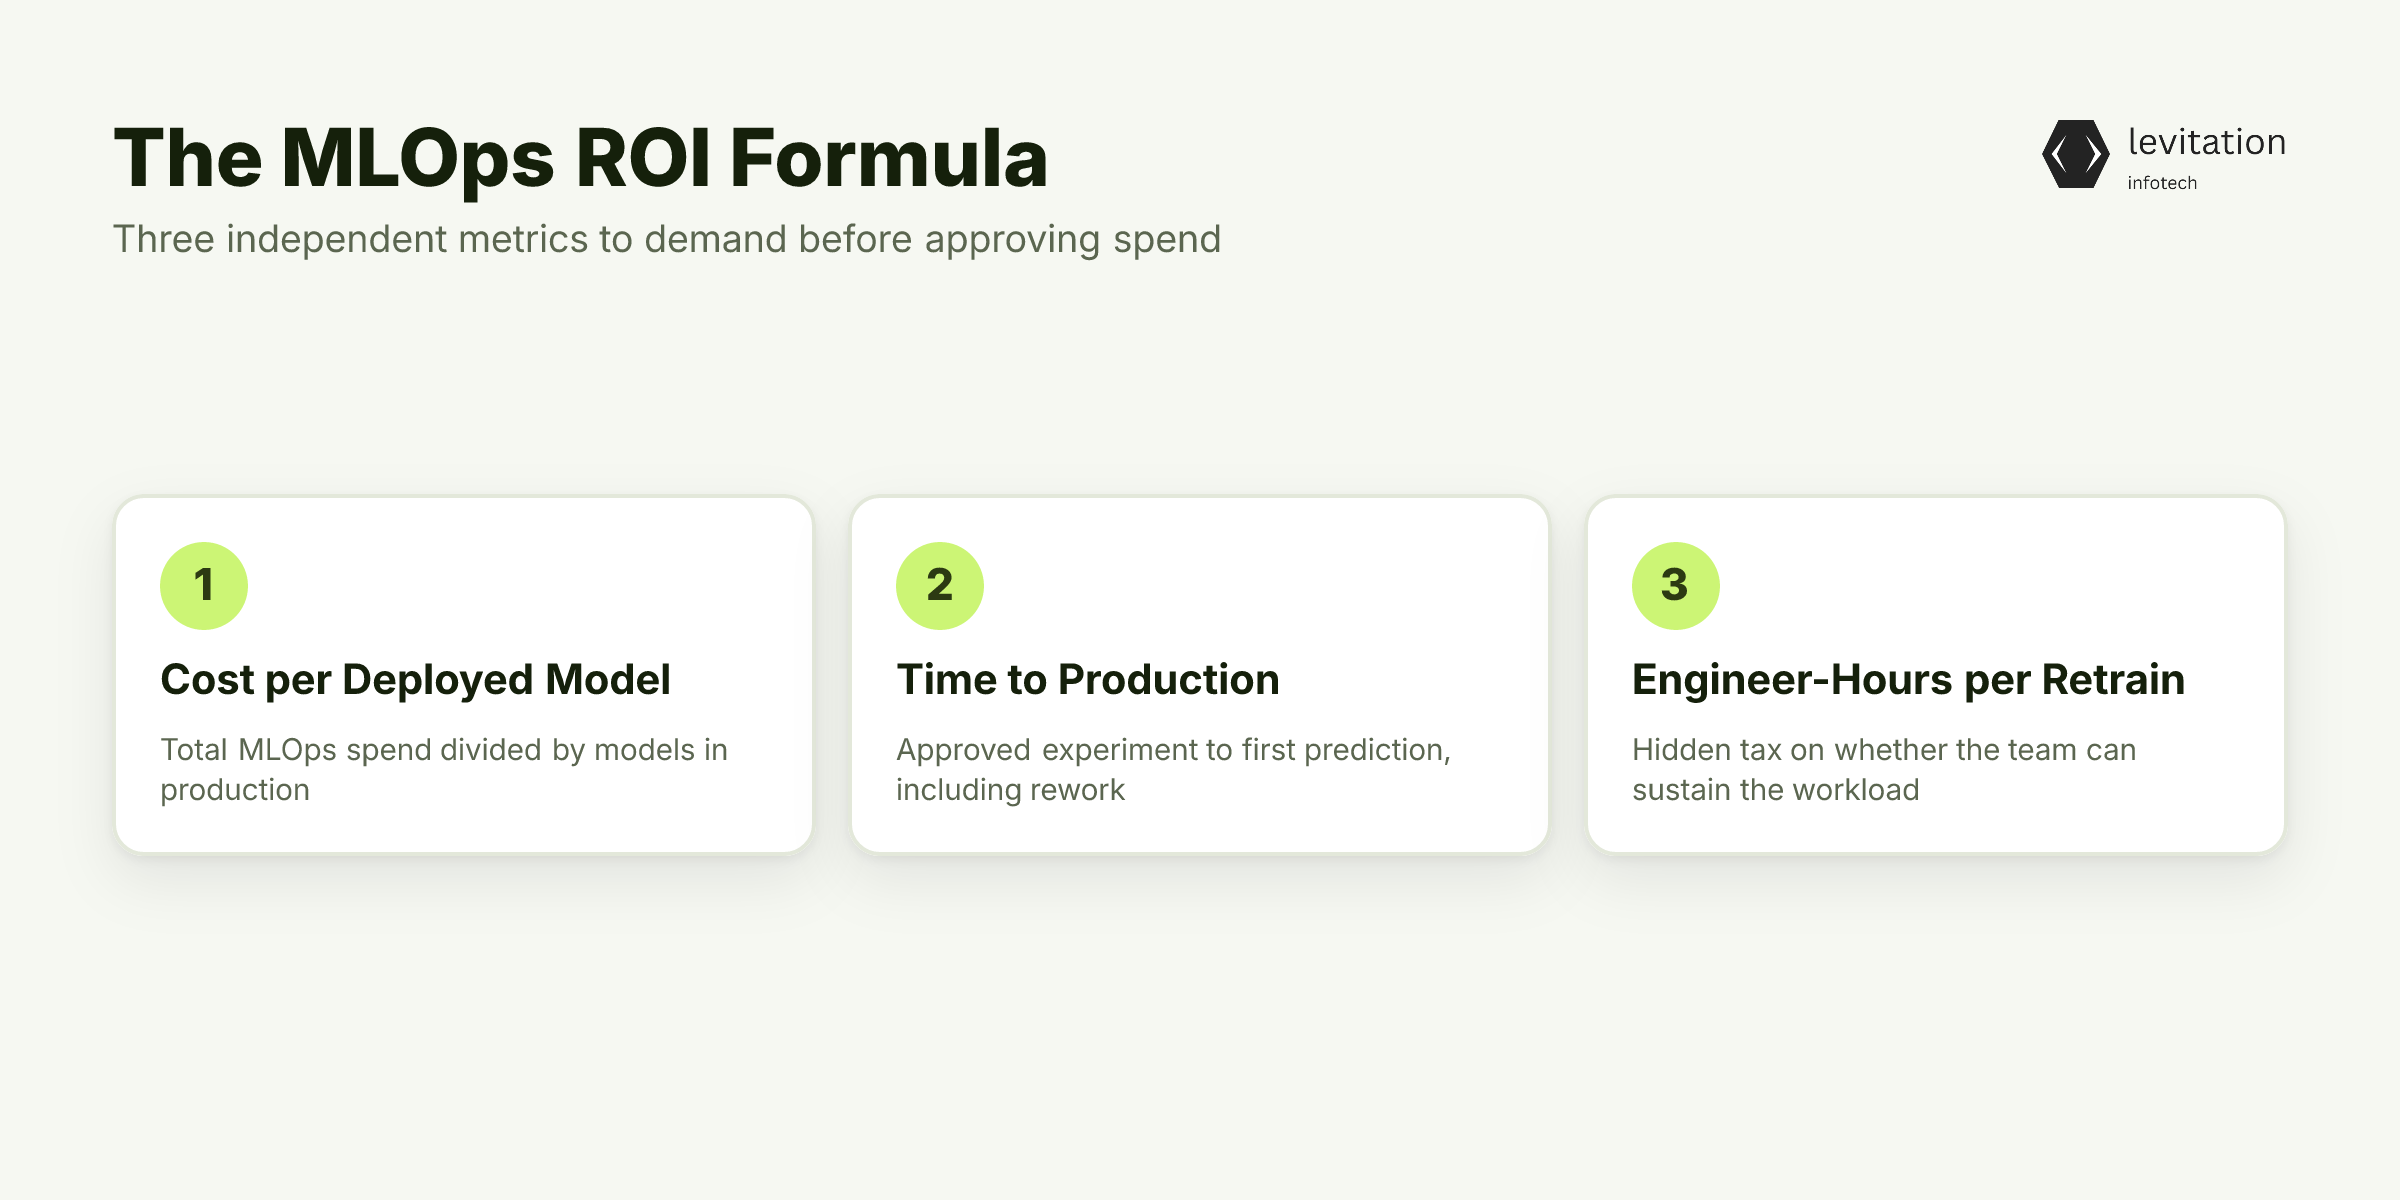
The single productivity multiplier in every vendor deck is a lie. Not because it's dishonest, but because it's incomplete. A real ROI formula has three independent metrics, and the moment you demand all three, the 40% claim collapses.
Metric 1 - Cost per deployed model. Total MLOps spend divided by models actually in production, not models experimented on. This single ratio exposes whether the stack is generating business value or just generating notebooks.
Metric 2 - Time to production. From approved experiment to first prediction served, including all rework. If this number isn't shrinking quarter over quarter, the tooling isn't earning its keep. This metric matters more than model accuracy in the early stages of MLOps maturity.
Metric 3 - Engineer-hours per retraining cycle. The hidden tax that determines whether your team can sustain 10 models or burn out at three. Retraining frequency compounds. If each cycle eats more senior time than the team can spare, the math stops working long before the GPU bill does.
A minimal tracking query might look like:
1SELECT2 model_name,3 COUNT(DISTINCT deployment_id) AS production_deploys,4 SUM(gpu_cost_usd + storage_cost_usd + license_cost_usd + engineer_hours * loaded_rate)5 / NULLIF(COUNT(DISTINCT deployment_id), 0) AS cost_per_deployed_model6FROM ml_cost_attribution7WHERE deployment_status = 'serving'8GROUP BY model_name9ORDER BY cost_per_deployed_model DESC;
Demand these three numbers from every vendor and every internal team before approving spend. The cost curve predicts itself once you can see it. Our MLOps ROI framework template gives finance and engineering a shared definition of value.
Knowing the formula is one thing. Running the audit is where most teams stall, because the data to populate it usually doesn't exist yet.
A 90-Day MLOps Cost Audit Most Vendors Will Quietly Resist
A structured audit makes costs visible early, which shortens the path from purchase to value. Here's the four-phase approach.
Weeks 1-2 - Map every line item to a model. Tag every license and cloud charge to a namespace, team, and model. If finance can't see which experiment caused the GPU spike, the audit can't start. This step alone is where most teams discover they have no idea where the money goes. Similar to what we found in our review of why your FinOps tool counts VMs, not AI workloads, the tagging gap is the root cause.
Weeks 3-4 - Instrument GPU spend with workload-level tagging. Training jobs, inference endpoints, and idle capacity each get their own cost center. Evaluate spot instances for checkpointed training and scale-to-zero for idle endpoints. The idle-capacity bucket is usually larger than anyone expected.
Weeks 5-8 - Run an engineer-time allocation study. Track how many hours per week go to pipeline maintenance, drift remediation, and tooling upgrades versus actual model work. This is the number that usually shocks the room. When the engineer-time allocation study shows pipeline plumbing consuming the majority of senior capacity, the licensing conversation changes permanently.
1# Sample retraining cost capture2retraining_cost:3 model_id: fraud-detector-v34 cycle: 2026-08-155 engineer_hours: 426 loaded_engineer_rate_usd: 1507 gpu_hours: 188 gpu_cost_usd: 2169 total_cycle_cost_usd: 651610 cycle_duration_hours: 11
Weeks 9-12 - Build the cost-per-deployed-model dashboard. Compare against the three-metric formula from the previous section. Renegotiate or replace anything that doesn't clear the bar. A dashboard that shows cost per deployed model by team makes the next quarter's planning conversation fundamentally different.
Our MLOps cost audit playbook includes the tagging schema, the engineer-time template, and the dashboard queries. The methodology also surfaces problems like idle GPU capacity, which we covered in why your GPUs are 68% idle and what that costs.
When this audit runs cleanly, the conversation inside your org shifts in ways most teams don't expect.
What an Honest MLOps Cost Model Changes for Your Engineering Org
The audit isn't the payoff. What the audit enables is the payoff. Once costs are visible and attributable, four things change inside the engineering org.
First, finance stops blocking AI initiatives. The "the GPU bill went up, someone explain it" meetings disappear because the answer is in the dashboard.
Second, engineering capacity reallocates from pipeline maintenance to actual model delivery. This is the productivity gain the vendor promised in the first place, just delivered through visibility rather than tooling.
Third, vendor negotiations shift from list price to per-model economics. The renewal conversation gets dramatically simpler when you can show cost-per-deployed-model by vendor.
Fourth, the cost model itself becomes an asset. Once the methodology is in place, it compounds in value across quarters, building exactly this kind of long-running cost governance into enterprise AI cost governance frameworks.
The honest cost model is the one that survives the next budget cycle.
Frequently Asked Questions
Q: What is the typical MLOps cost for an enterprise?
A: There is no single number. The licensing line on the quote typically represents a minority of total MLOps spend, because infrastructure and engineering time scale with model count and retraining frequency while the license number stays fixed. The rest is GPU hours, storage, egress, and the senior engineers required to keep the stack alive.
Q: How do you calculate MLOps ROI?
A: Use three metrics instead of one: cost per deployed model, time from approved experiment to production, and engineer-hours per retraining cycle. ROI equals the value of models shipped minus total MLOps cost across licensing, infrastructure, and people. A single productivity multiplier hides more than it reveals.
Q: Why are MLOps tools so expensive?
A: The license is rarely the dominant cost. GPUs for training and inference, storage for feature stores and artifacts, and the senior engineers required to keep the stack alive are the real line items. These scale with model count and retraining frequency, not with headcount, which is why costs can triple while team size grows only modestly.
Q: What are the hidden costs in MLOps?
A: Three categories: integration cost (stitching pipelines, feature stores, and monitoring into a working system), operational cost (on-call, drift remediation, retraining automation), and opportunity cost (experiments that never ship because the pipeline team is overloaded). The third is usually the largest and almost never appears in a budget.
About the author
Mayank Singh is a software developer at Levitation Infotech, where he builds web and AI-powered applications across the company’s fintech, healthcare, and enterprise projects.