


TL;DR: The first finding in most AI compliance audits isn't a model defect, it's a structural visibility gap between what your dashboards show and what your AI system actually does. Traditional monitoring was built for deterministic software and silently misses the probabilistic failure modes auditors probe first. Closing this gap needs layered instrumentation across application, model, RAG, and infrastructure tiers, not another dashboard.
Key Takeaways: - Auditors consistently find structural visibility gaps before they find model defects or bias - Traditional observability stacks (Prometheus, Grafana, OpenTelemetry) were designed for predictable software and miss AI-specific failure modes entirely - The three structural blind spots are: discovery and posture, model behavior edge cases, and data lineage with drift - Treating the model as an opaque external dependency (zero-trust style) is the only reliable instrumentation pattern for managed AI platforms
Audits Find What Your Dashboards Can't, and It's Always the Same Gap
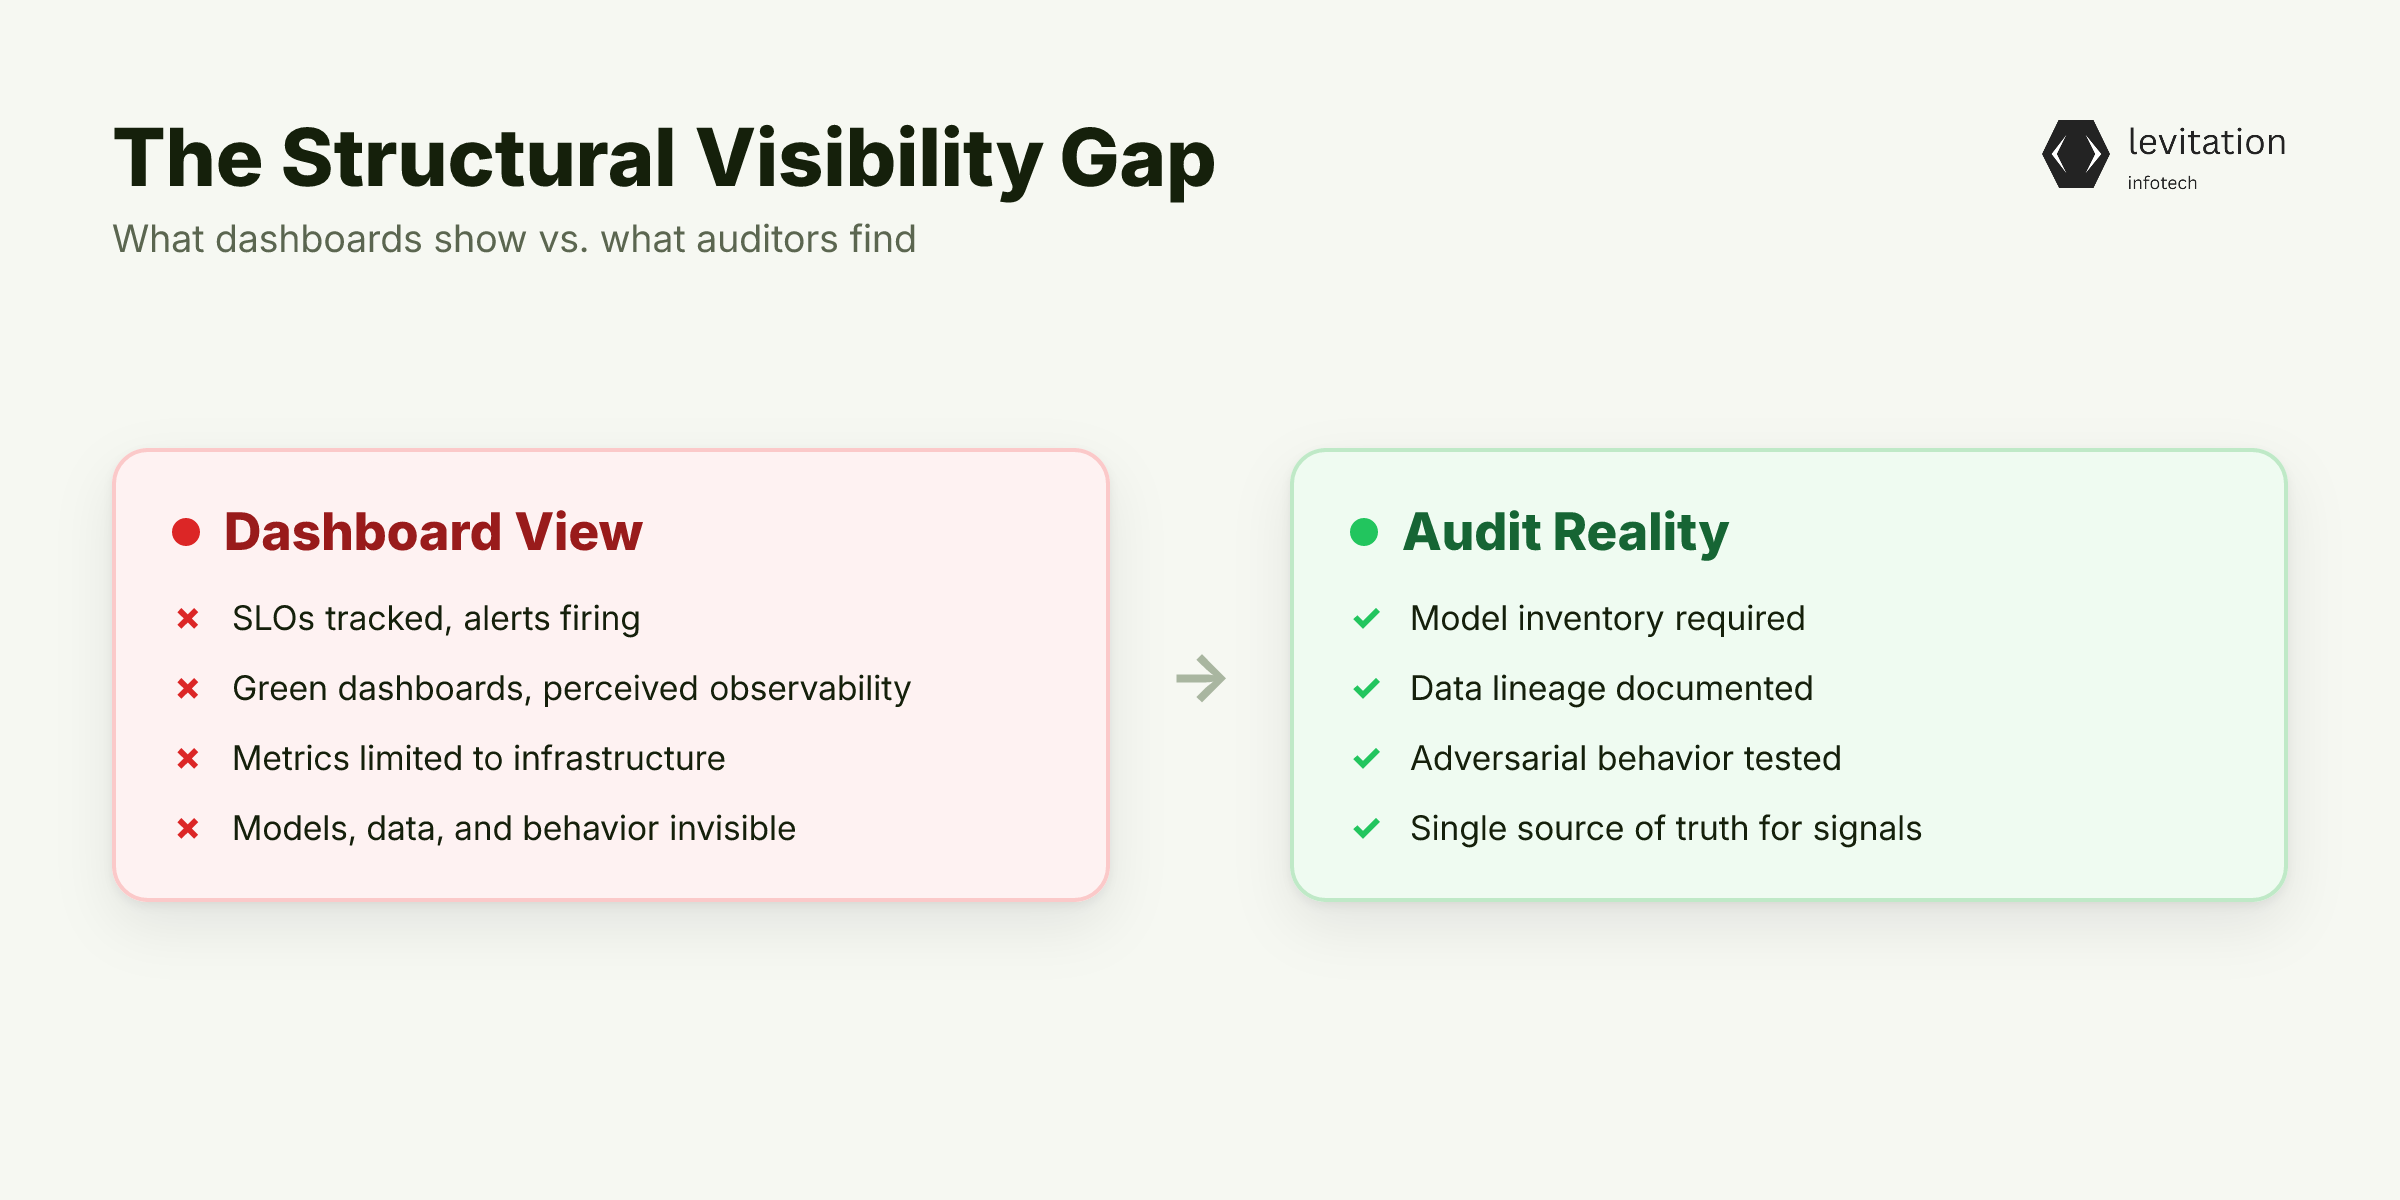
Every audit finds the same thing: a gap between what your dashboards show and what your AI system actually does. That gap isn't a tooling problem. It's a structural one, and it's the first place auditors look.
Across enterprise deployments in regulated industries, the pattern repeats with depressing consistency. Internal teams believe they have observability because they run Prometheus, Grafana, OpenTelemetry collectors, and a cloud-native monitoring suite.
Alerts fire. SLOs are tracked. Dashboards are green. Then an AI compliance audit begins, and the first finding has nothing to do with model accuracy or bias.
It's a structural visibility gap.
Auditors don't flag missing metrics. They flag missing categories of signal. They ask: what models are running? What data do they touch? How do they behave under adversarial input?
In most cases, the internal team cannot answer these from a single source. The information exists somewhere, in a notebook or a Slack thread. It does not live in the telemetry layer where an auditor expects to find it.
This is why cloud security solutions that stop at infrastructure metrics leave AI workloads unmonitored. Regulators care about dimensions those metrics cannot see.
Audit findings surface problems the team genuinely did not know existed. Not because the engineers were careless. The monitoring stack was never designed to see what AI workloads actually do.
If the tools are running and the alerts are firing, why is the AI stack still invisible? The answer lies in what those tools were designed to see, and what AI workloads do that breaks their assumptions.
Why Traditional Monitoring Leaves AI Systems Invisible
The three pillars of traditional observability, logs, traces, and metrics, were built for deterministic software. A request enters. A known code path executes. An expected output returns. If the system fails, the failure mode is reproducible and shows up as an error code, an exception, a timeout.
AI systems break this contract.
A model can serve the same prompt differently across runs. It can drift in accuracy over weeks. It can hallucinate without raising any infrastructure error. It can degrade silently when a retrieval corpus goes stale or an upstream embedding model changes.
None of these events produce a stack trace. None trigger a 5xx. None appear in your cloud security solutions dashboards.
Here is what your logs and traces actually tell you: - Logs: the model was called at timestamp T with prompt P - Traces: latency and token count were recorded - Metrics: p99 latency exceeded threshold
None of that answers the question an auditor asks: was the output correct, grounded, safe, and unbiased?
Those are the dimensions regulators and compliance teams evaluate. Traditional telemetry is silent on every one of them.
AI infrastructure monitoring needs a separate telemetry layer. This layer captures model-specific signals like token usage anomalies, embedding drift, retrieval relevance scores, and output quality scores.
The monitoring stack isn't broken. It's answering the wrong question. And that misalignment is precisely what auditors exploit when they walk through your AI compliance audit checklist.
The Three Structural Blind Spots Auditors Probe First
Auditors don't waste time on happy paths. They have a predictable playbook. Three structural blind spots show up in nearly every finding report.
Each is structural, meaning no amount of better logging will close it. It needs a different observability model.
Blind spot #1 - Discovery and posture. Auditors first ask: what AI systems do you run, where, and on what data? Most teams cannot answer this from a single source. Shadow models, unsanctioned API keys, and forgotten Bedrock endpoints are discovered during the audit, not before it.
Teams that pass this question cleanly run a centralized AI asset inventory tied to their observability layer. Everyone else scrambles. The AI compliance finding writes itself early in fieldwork.
Blind spot #2 - Model behavior edge cases. Auditors don't test happy paths. They probe with adversarial prompts, out-of-distribution inputs, and demographic edge cases to check for groupthink, bias, and hallucination under stress.
Without continuous evaluation telemetry, you have no record of how your system handled these cases in production. You have no regression suite. You have no defense. This is the same gap that lets evals approve models that fail in production. The test set never reflects what real users actually send.
Blind spot #3 - Data lineage and drift. Where did the training data come from? When was the retrieval index last refreshed? Has the input distribution shifted? Auditors trace data flow end-to-end, and gaps in lineage documentation are treated as control failures under most regulatory frameworks. A retrieval pipeline that serves stale context is an audit finding waiting to happen. So is a fine-tune dataset that nobody can source.
These three blind spots exist regardless of where your model actually runs. But if your AI is hosted on a managed platform, the visibility problem gets measurably worse.
The Opaque Execution Problem: When Your Model Runs Outside Your Perimeter
If you're using OpenAI, Anthropic, Gemini, Amazon Bedrock, Azure AI Foundry, or Vertex AI, the model executes externally and opaquely. You get a response, but not the internal reasoning, probability distributions, or intermediate states.
You see the input you sent and the output you received. Everything in between belongs to the vendor.
This black-box execution directly conflicts with AI stack visibility needs. Auditors expect you to explain why your system produced a given output. "The vendor's model decided" is not an acceptable answer. It fails the explainability test that most regulatory frameworks impose.
The fix is not to abandon managed platforms. Managed inference is often the right economic and operational choice. The fix is to instrument around the model, at the boundary you control. Capture: - Every prompt sent (after PII redaction) - Every response received - The retrieval context injected - Latency, cost, and token counts - Evaluation scores computed against the output
Treat the model as an external dependency, like a third-party API. Apply the same observability rigor you'd apply to any untrusted service.
Zero-trust principles that govern your cloud security solutions for external APIs apply here. The model is a dependency you cannot inspect internally. You inspect everything you can see about its inputs, outputs, and behavior over time.
Knowing what to instrument is half the battle. The other half is knowing where in the stack to put it, and that needs a layered approach, not a single tool.
Building Audit-Ready Observability: A Four-Layer Approach
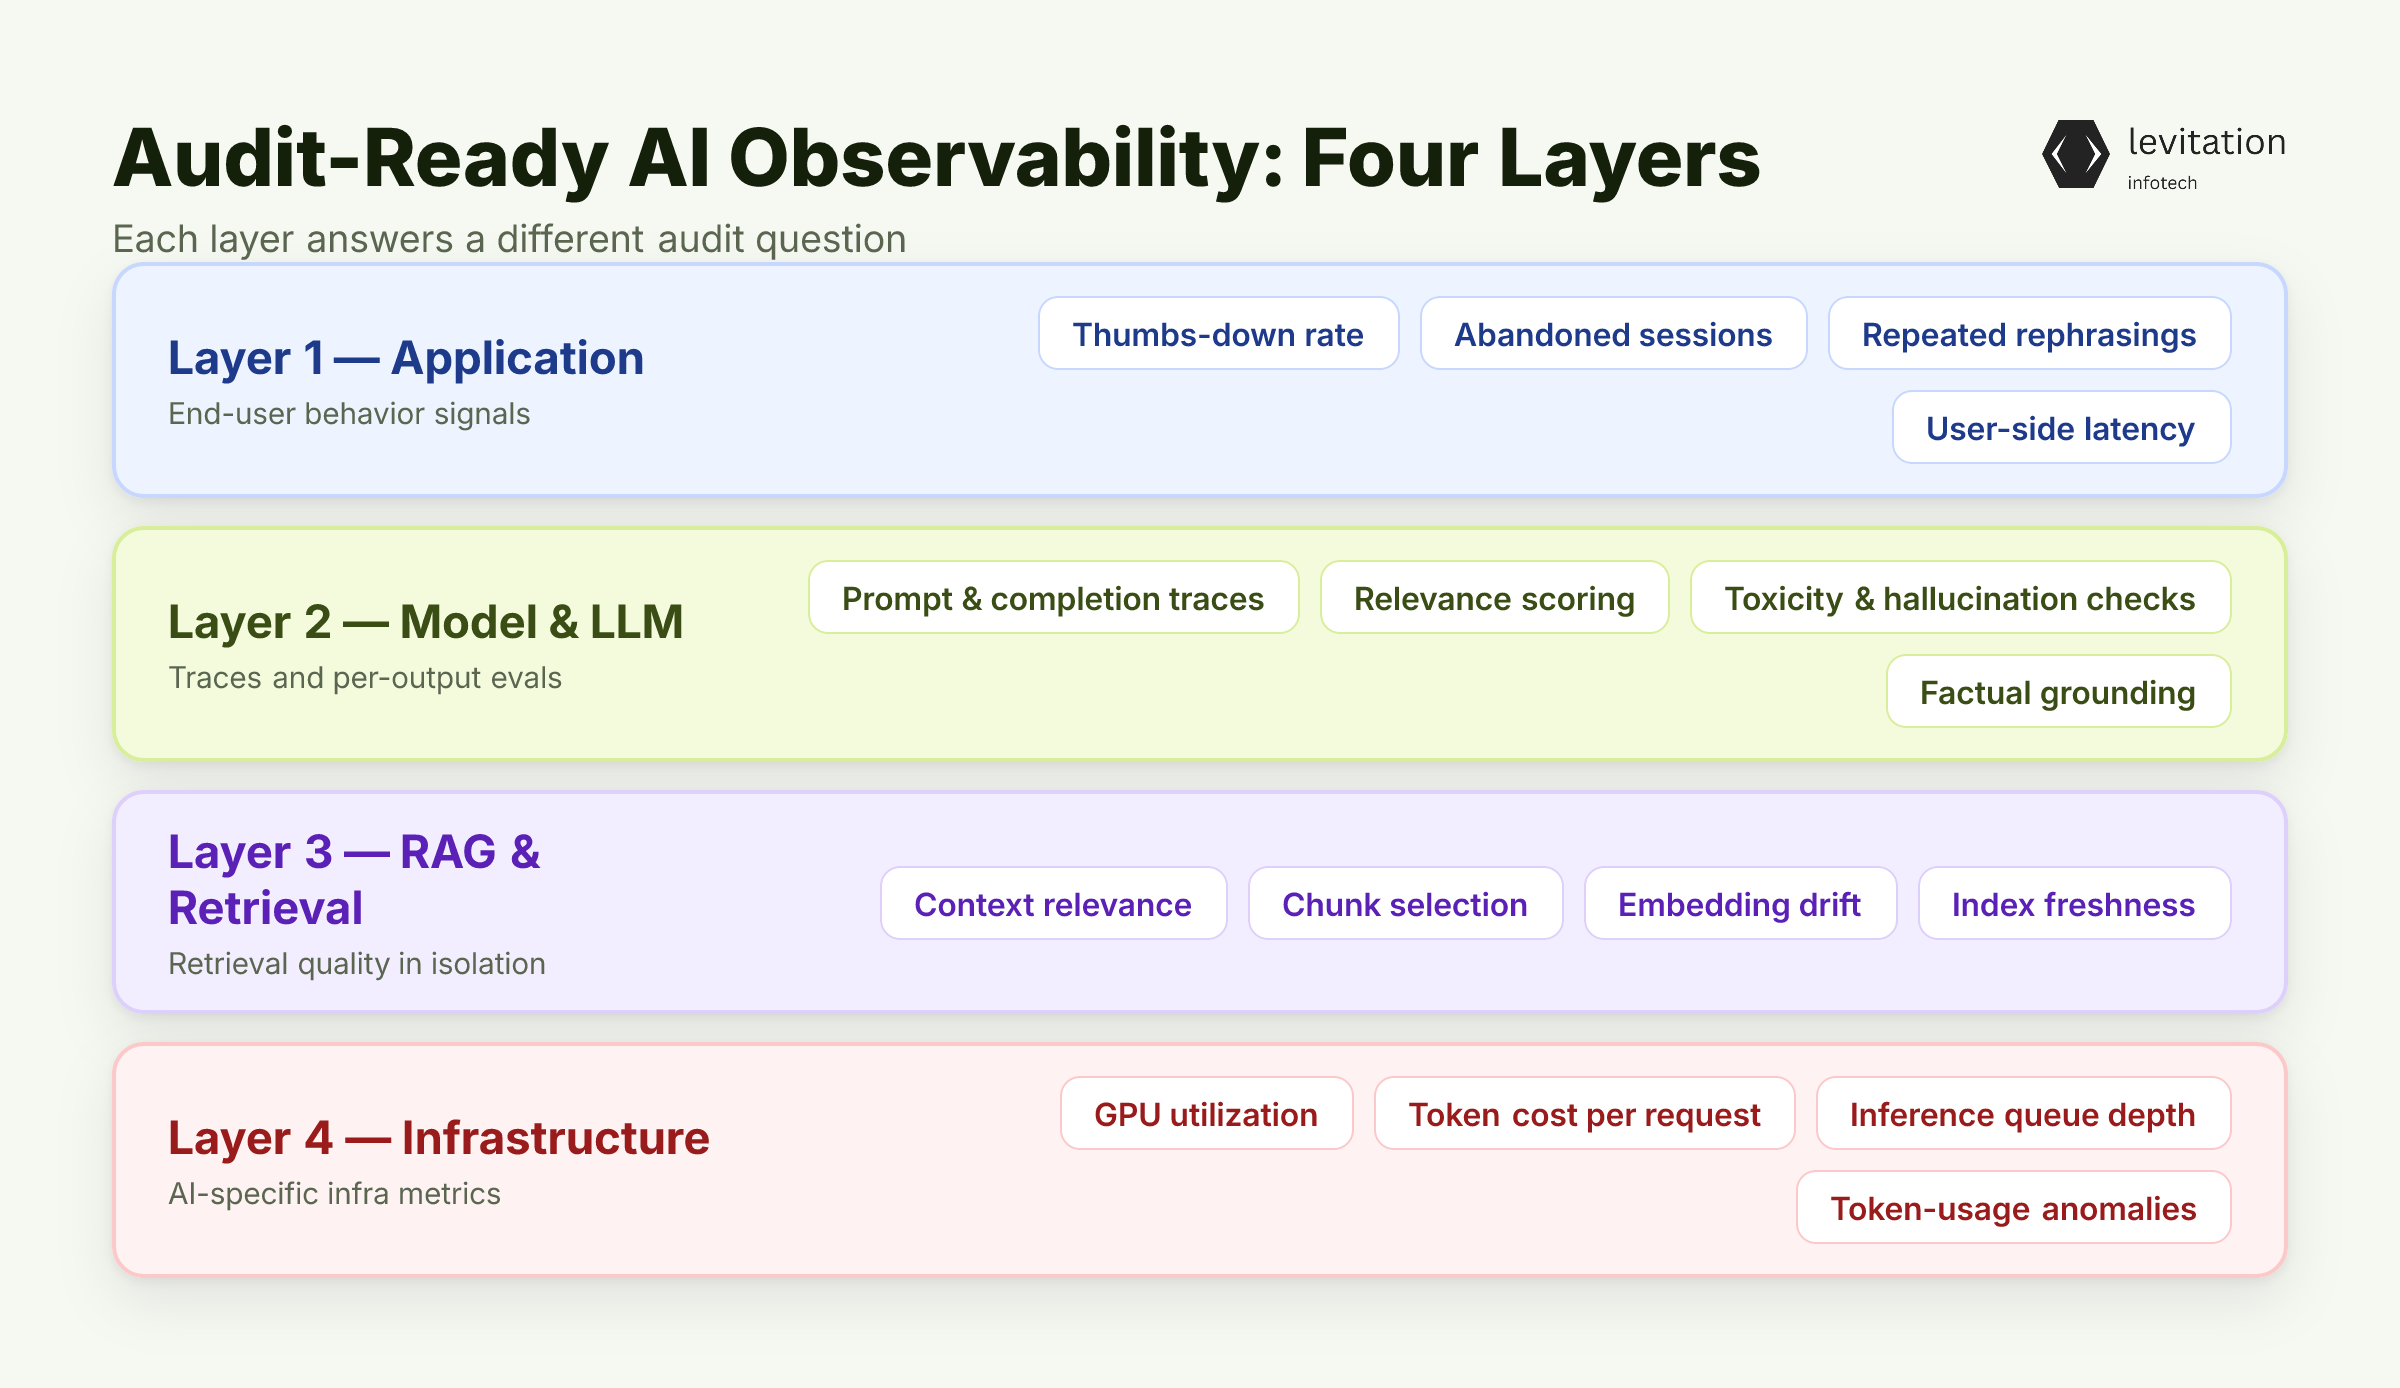
Single-pane dashboards are tempting and almost always wrong. AI observability lives across four distinct layers, and each one feeds a different audit question.
Layer 1 - Application layer. Instrument user interaction patterns, feedback loops, and UI-triggered anomalies. This is where you detect whether end users are experiencing degraded AI behavior in real time. Signals: thumbs-down rate, abandoned sessions, repeated rephrasings, latency from the user's perspective.
Layer 2 - Model and LLM layer. Capture traces across prompt construction, model invocation, and response generation. Add evaluation hooks that score every output for relevance, toxicity, hallucination risk, and factual grounding. This is the layer auditors examine most closely. A working OpenTelemetry integration looks like:
1from opentelemetry import trace2from opentelemetry.instrumentation.openai import OpenAIInstrumentor34OpenAIInstrumentor().instrument()56tracer = trace.get_tracer("ai.llm")78with tracer.start_as_current_span("llm.completion") as span:9 span.set_attribute("llm.model", "gpt-4o")10 span.set_attribute("llm.prompt_tokens", 312)11 span.set_attribute("llm.completion_tokens", 148)12 span.set_attribute("eval.relevance_score", 0.87)13 span.set_attribute("eval.hallucination_risk", 0.04)14 response = client.chat.completions.create(...)
Layer 3 - RAG and retrieval layer. Monitor retrieval quality independently of the model. Track context relevance, chunk selection, embedding similarity drift, and index freshness. A model hallucinating because retrieval is broken is still a model failure in the auditor's eyes. The drift mechanics are covered in detail in our piece on AI drift in Indian enterprises.
Layer 4 - Infrastructure layer. Apply AI-specific metrics on top of standard cloud security solutions monitoring. Track GPU utilization patterns, token cost per request, queue depth on inference endpoints, and token-usage anomaly detection. Standard cloud monitoring will not flag an anomalous token-usage spike if the request still returns 200 OK.
Each layer feeds a unified dashboard. The goal is a single pane that an auditor can open. It should immediately answer: what models are running, what data they touch, how they behave, and how failures are detected.
Teams building this from scratch in-house underestimate the evaluation and RAG-pipeline instrumentation layers, which is where timelines balloon. The full control mapping is documented in our AI compliance reference architecture.
Instrumentation alone is passive. To get ahead of audits, you need the telemetry to actively drive development decisions. That shift is where evaluation-driven development changes the equation.
From Monitoring to Evaluation-Driven Development
Traditional monitoring answers: is it running? Evaluation-driven development answers: is it correct? Both questions are necessary, but only the second maps to what an AI compliance audit actually tests.
The pattern is concrete:
- Production traces feed evaluation metrics continuously
- Evaluation metrics feed regression tests in CI/CD
- Regression tests feed deployment gates
- Failed gates block the release
Drift, false responses, and excessive token usage are caught in CI/CD, not in the audit room. This pattern mirrors what mature DevOps teams do with service-level objectives, applied to model quality. It also integrates cleanly with existing MLOps compliance pipelines and k8s-native observability stacks.
The technical work is concrete and well-understood. The harder question is what it buys you beyond a clean audit report. The answer is more material than most CTOs expect.
What Clean Audits Actually Unlock
Clean audits are not the end state. They are the baseline that unlocks three downstream advantages most engineering leaders don't price in.
Speed. Teams that build AI observability as a structured practice avoid the underestimation trap that delays in-house builds cobbled from open-source tools. The difference compounds across every model deployment that follows.
Longevity. Systems architected with layered observability and evaluation-driven development remain stable in production for years. Drift and degradation are detected and corrected continuously, not catastrophically. The instrumentation catches drift before users do.
Organizational trust. A clean audit record compounds. It shortens procurement cycles, accelerates regulatory approvals, and turns regulatory compliance into a byproduct of engineering practice rather than a parallel workstream. Buyers stop asking for evidence. They start asking for delivery timelines.
The blind spot auditors find first is not a failure of effort. It's a failure of instrumentation architecture. Closing it once, at the structural level, pays dividends across every future audit and every model deployment that follows.
The pattern is well-trodden. It includes four layers of telemetry, an evaluation feedback loop wired into CI/CD, and a model treated as an opaque external dependency. Teams looking to accelerate this work can map their stack against a reference architecture like Levitation to shorten the path to an audit-ready system.
Frequently Asked Questions
Q: What do auditors look for first in an AI compliance audit?
A: Auditors start with discovery: they inventory every AI system in your environment, map data flows, and check for undocumented models, unsanctioned API keys, and unmanaged endpoints. The first finding in most audits is not a model defect. It's a visibility gap. Teams without a centralized AI observability layer cannot answer basic inventory questions in real time.
Q: How is AI observability different from traditional application monitoring?
A: Traditional monitoring tracks deterministic system behavior: request rates, error codes, latency. AI observability tracks probabilistic behavior: output quality, hallucination rates, retrieval relevance, model drift, and token-level anomalies. Both layers are necessary, but traditional monitoring alone produces no signal about whether your AI system is performing correctly.
Q: Can you achieve AI stack visibility for managed platforms like OpenAI, Bedrock, or Vertex AI?
A: Yes, but not from inside the model. You instrument at the boundary you control: capture every prompt, response, retrieval context, evaluation score, latency, and cost. Treat the model as an opaque external service, similar to a third-party API in a zero trust architecture, and apply the same observability rigor to its inputs and outputs.
Sources
Research and references cited in this article:
- The AI Blindspot for Compliance
- The Blind Spot AI Agents Opened in Your Security Stack
- AI Blind Spots: How Enterprises Detect Hidden Model Failures
- Compliance Blind Spot: How Agentic AI Supports Financial ...
- Top 7 industries with stringent AI compliance needs in 2026
- AI observability: Why traditional monitoring isn't enough - Articles - Braintrust
- Why traditional monitoring will no longer be enough in 2026
- Gaps and Opportunities in AI Audit Tooling
- Drata finds most firms lack visibility into AI tools
- Inadequate Monitoring and Logging | AI Risk Guide
- What is the meaning of 'how' and how can I explain it?
- How? Vs What? : r/ENGLISH
About the author
Mayank Singh is a software developer at Levitation Infotech, where he builds web and AI-powered applications across the company’s fintech, healthcare, and enterprise projects.