


TL;DR: The gap between platform output and platform cost is a measurement failure, not a strategy failure. CTOs who separate funded output from funded outcomes capture the 2.8x productivity gain without the 1.9x budget bleed.
Key Takeaways: - Platform output and platform cost measure different populations. That is why the two numbers look contradictory but are actually consistent. - The 1.9x cost hides in tooling sprawl, idle cloud capacity, on-call inflation, and shadow platforms. These rarely show up on a single budget line. - The build-versus-buy threshold and the in-house timeline change the math for most teams at smaller engineering org sizes. - A three-layer ROI model (developer time, infrastructure cost, incident cost) filters real signal from feature throughput. - Mature platform engineering cuts incident cost measurably, which is the line item that justifies the 1.9x spend.
The 2.8x Productivity Trap Nobody Talks About
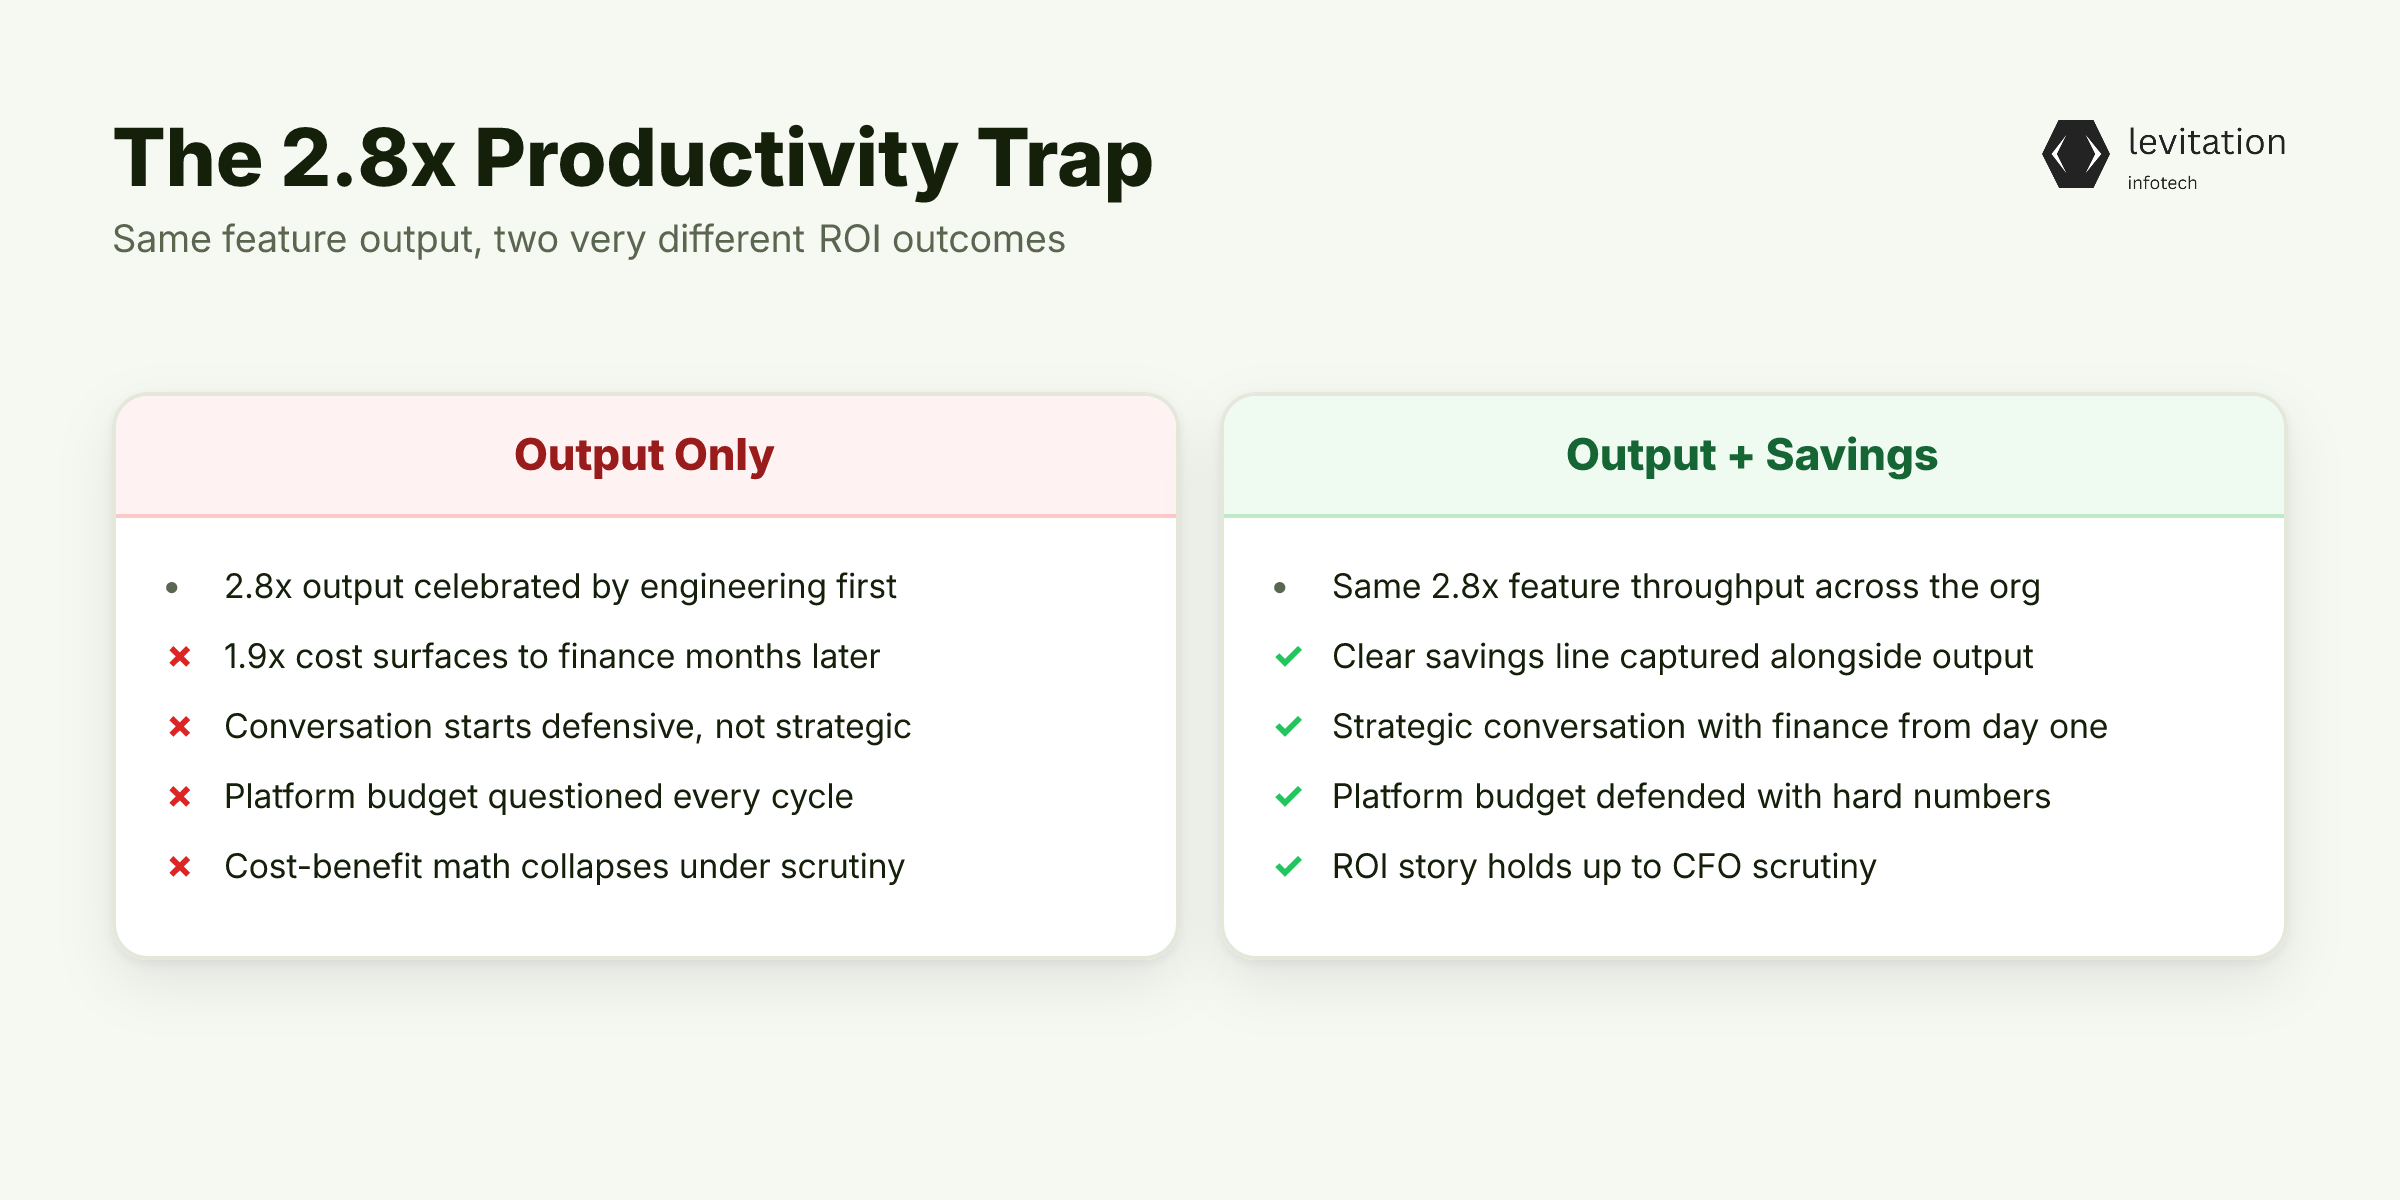
Your platform team shipped twice as many features last quarter. Your CFO also asked why the infrastructure bill doubled. Both statements are true, and the gap between them is where platform engineering ROI lives or dies.
Here is the trap. A 2.8x output number and a 1.9x cost number are not contradictions. They are the same metric viewed from two different directions. Output counts every feature your platform enables across the whole engineering org. Cost counts what the platform team itself consumes: headcount, tooling, cloud, and the maintenance burden of every abstraction it owns.
The two populations overlap at the platform team and diverge at every downstream user. Most CTOs see the velocity number first. Engineering leadership celebrates, dashboards turn green, and the postmortem slides look clean.
Finance sees the cost number second, often months later. By then the platform team has already hired two more people. The conversation starts defensive instead of strategic, which is the worst position to negotiate from.
The contrast that matters is between the team that captures the productivity number alongside clear savings and the team that hits output without the savings line. Output is identical in both cases, but the cost-benefit math collapses in the second. The platform budget becomes the line item finance questions every cycle. Our analysis of why most platform teams should stop building internal developer platforms reaches a similar conclusion from a different angle.
Productivity gains are real. So is the spend. The question is which line item is eating the difference.
Where the 1.9x Budget Burn Actually Hides
The 1.9x budget number almost never shows up as one clean line. It fragments across categories that the finance team tracks separately and the engineering team rarely reconciles.
Four buckets drive most of it. First, platform team headcount, including the engineers, the product manager, and the on-call rotation that grows with every new service. Second, third-party tooling sprawl, where observability, secret management, CI runners, and policy engines each carry their own license and integration tax.
Third, idle cloud capacity, because platform layers tend to over-provision to avoid becoming the bottleneck. Fourth, the maintenance tax on everything built, which compounds silently after the initial launch sprint and rarely gets its own roadmap.
Mature platform engineering improves resource utilization measurably when properly tuned. The catch is the word mature. Untuned platforms leak capacity, and the leak is invisible until you instrument it. Most teams discover the leak only when a FinOps tool starts counting actual AI workloads instead of just VMs. The line items then separate into things finance can explain and things they cannot.
The hidden piece is worse. Contractor hours show up under a different cost center. On-call rotation inflation sits in the SRE budget, not the platform budget. Shadow platforms that spring up when the official one is too slow quietly duplicate everything the main team built.
A 1.9x budget often includes these phantom costs, which is why the official line item never matches the actuals. The cost itself is not the problem. The invisibility is.
If the cost is structural, the fix is structural too. It starts with the build-versus-buy decision nobody wants to revisit.
The Build vs Buy Equation
The headline math on building a custom developer platform is severe. It includes team salary, tooling, and the opportunity cost of delayed developer productivity. The opportunity cost is the number that rarely makes it onto the CFO's slide.
The timeline is the part that hurts. A proven platform product deploys in months, not years. An in-house build runs much longer before any developer outside the platform team sees a self-service workflow.
During that time, every product team is still doing the manual provisioning, the hand-rolled pipelines, and the snowflake clusters. These are the exact problems the platform was supposed to eliminate. The cost of not having a platform is rarely on the same slide as the cost of building one. That is why the comparison almost always favors the build.
The lesson that holds at small scale is the same one that holds at large scale. The threshold question matters more than the framework question. We have written more on this in why most platform teams should stop building internal developer platforms, and the conclusion holds at almost every smaller engineering org size.
This is not an argument for never building. It is an argument for knowing the threshold. Build makes sense at a larger engineering scale with a domain-specific workload that off-the-shelf platforms do not cover. It also makes sense where regulatory constraints force full ownership of the stack.
Below that line, the default is buy. Above it, the build cost becomes a one-time capital outlay rather than a recurring budget surprise. Choosing buy or build only matters if you can prove the outcome. Most platform teams cannot, and that is the next problem.
The ROI Framework That Filters Signal From Throughput
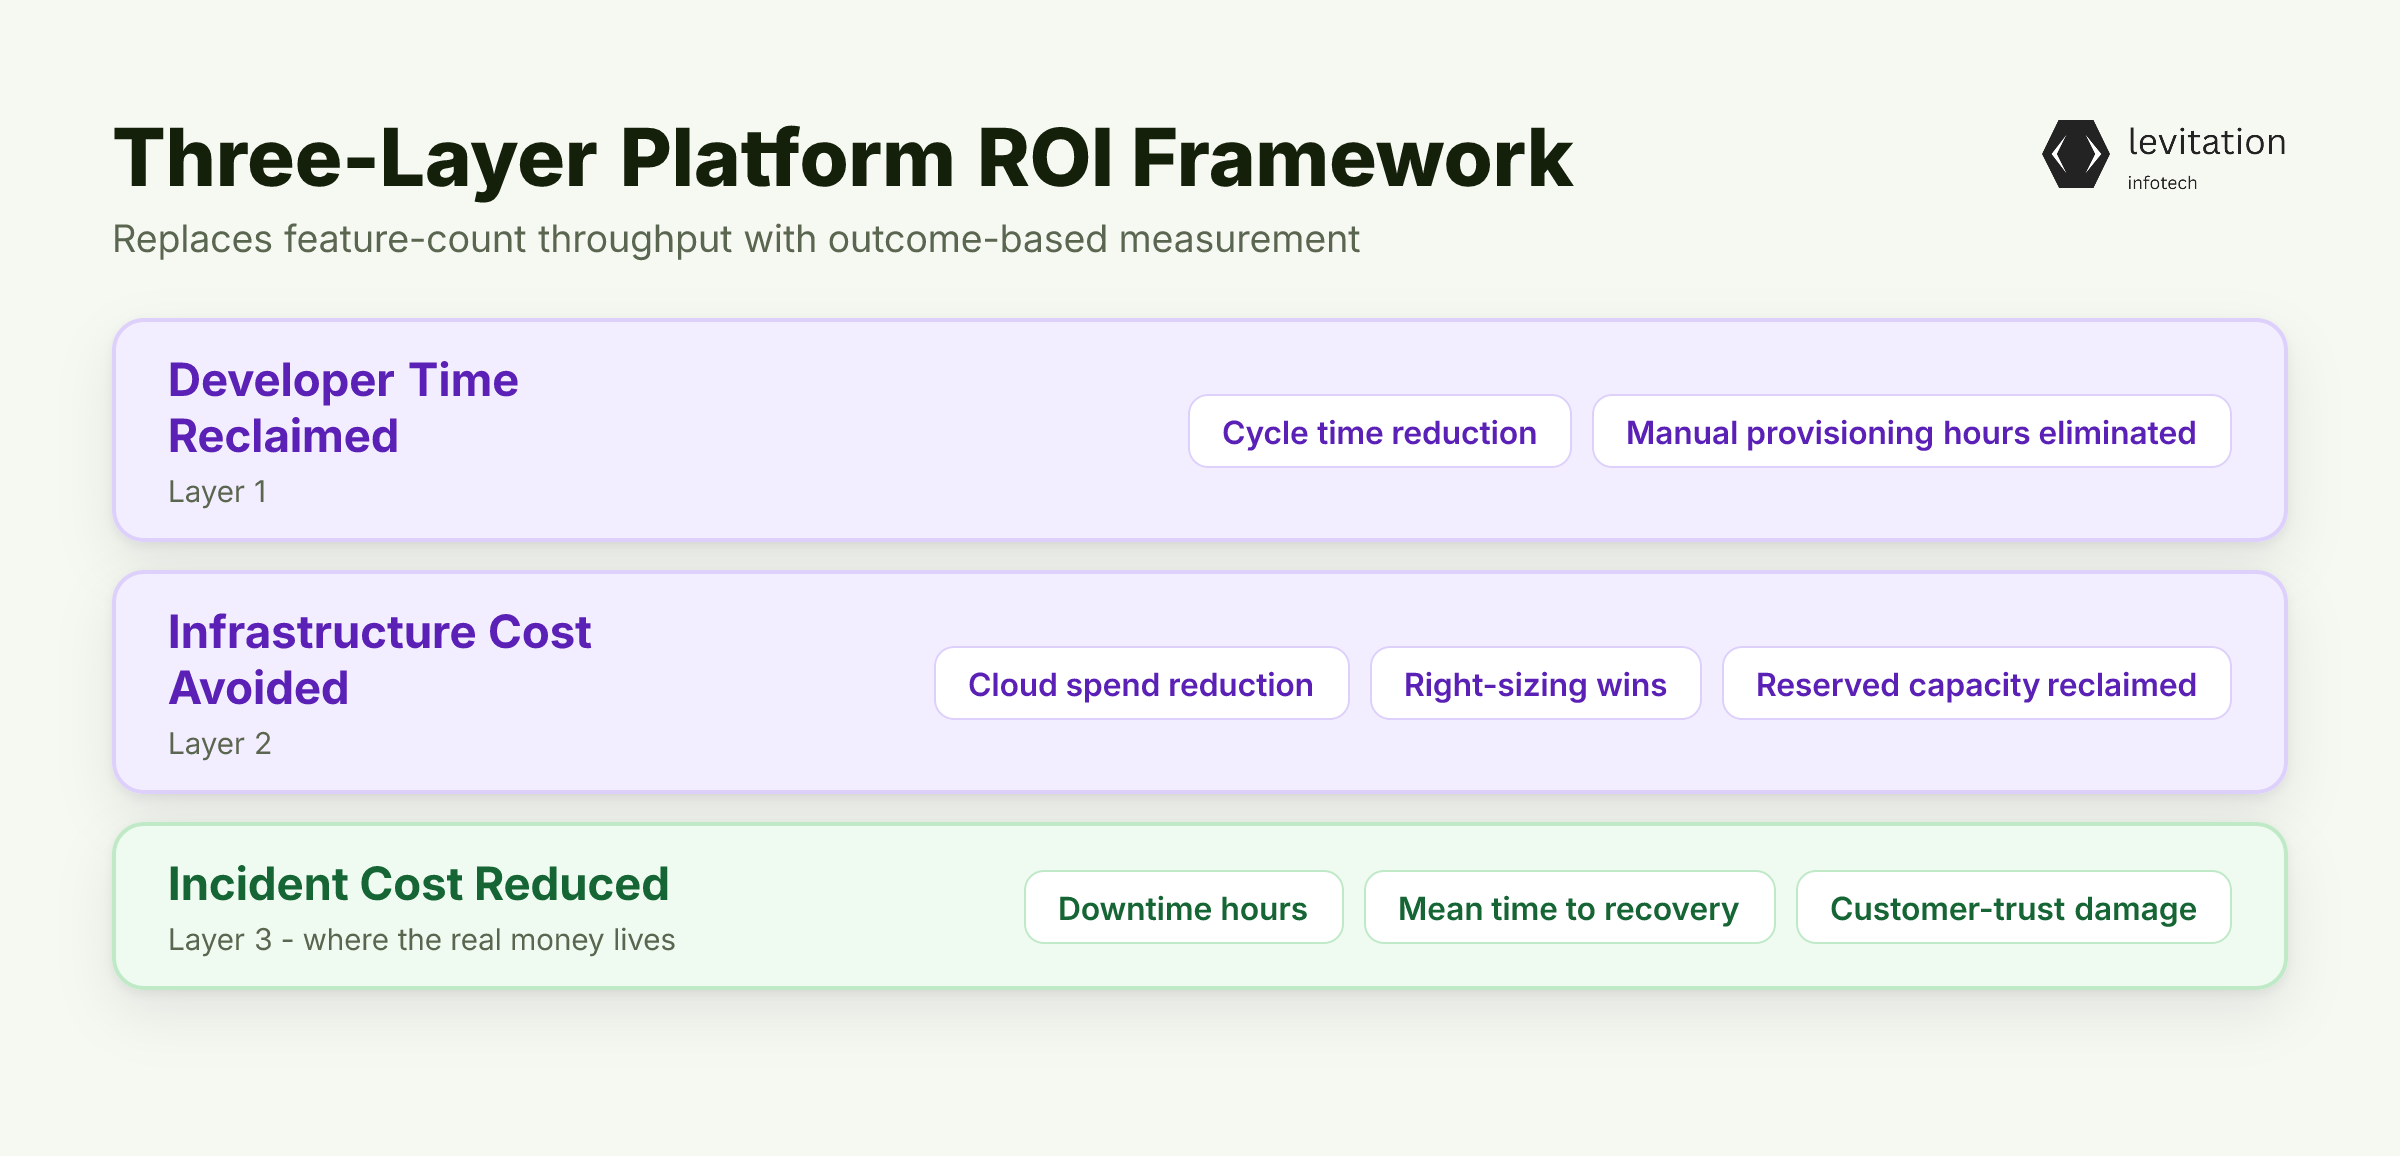
Feature count is the wrong metric. It rewards throughput, not outcomes, and it is why most platform ROI reports look unconvincing to a CFO who has seen three quarters of inflated numbers already.
Replace it with a three-layer model. Layer one is developer time reclaimed. Measure it through cycle time reduction and manual provisioning hours eliminated across the engineering org. Layer two is infrastructure cost avoided. Measure it through cloud spend reduction, right-sizing wins, and reserved capacity reclaimed across regions.
Layer three is incident cost reduced. Measure it through downtime hours, mean time to recovery, and the customer-trust damage that follows a major outage. Each layer maps to a dollar value independently, so they cannot be stacked to inflate the total. This is the same separation principle we apply in 70% can't prove AI ROI - here's what to measure instead, translated to platform work.
The third layer is where the real money lives. Downtime that stretches into hours creates a revenue loss. It also creates a customer-trust impact that dwarfs the platform team cost by orders of magnitude. This silences the budget conversation permanently.
Cloud spend reductions paired with performance improvements are the kind of two-sided wins CFOs remember. The savings show up on the same line as the speed gains. They don't trade one for the other.
Measurement cadence matters as much as the metrics. Baseline the three layers before the platform ships a single internal tool, because post-hoc numbers always look self-serving. Track developer productivity monthly. Measure platform adoption across teams every quarter, not just usage but active service ownership and self-service dependency. Track reliability weekly, because incident cost is the layer that justifies the spend when finance starts asking questions.
The cadence difference between the three layers is intentional. Developer productivity moves slowly. Adoption moves in quarters. Reliability can shift in a single bad week.
Frameworks are theory. The real question is what this looks like when a CTO actually runs the numbers.
What Real Platform ROI Looks Like in Practice
The common pattern across successful platform investments is consistent. The platform team is small relative to the engineering org it serves. Savings come from standardization rather than headcount reduction. The timeline to first measurable result is weeks for an MVP, not quarters of committee review.
IDP ROI is positive when measured across security, cycle time, overhead, and developer experience, not just cost. The numbers work at both ends of the org-size spectrum. The longevity math is what separates a real platform from a glorified internal tool. The cost discipline that makes this work is the same discipline that keeps observability costs from outpacing the cloud bill.
The platform team that gets the math right builds systems still running in production years after deployment. That longevity is the part of the story nobody puts in the slide deck, but it is the compounding return that justifies the original investment. The platform team that gets the math wrong ships a tool, watches adoption stall, and spends the next two years rewriting it.
The numbers work. But the reason most CTOs never see them is that they stop measuring the moment the platform team ships its first internal tool.
What Changes When You Fund Outcomes Instead of Output
Here is the reframe. The CTO's job is to fund the 2.8x productivity gain and capture it. The budget conversation should be tied to cloud savings and downtime reduction, not the number of YAML templates the platform team published last quarter.
Track developer productivity, time-to-delivery, platform adoption, and reliability as a connected dashboard. The four numbers move together when the platform is healthy, and diverge when it is not. A quarterly review that shows all four trending up is defensible to any CFO.
A review that shows only adoption trending up is a one-on-one waiting to happen. Outage cost reduction is the line that does the heavy lifting. Mature platform engineering reduces outage-related costs measurably, which is the budget line that justifies the 1.9x spend that feature counts never can.
Most CTOs underweight this because outages feel episodic. Annualized, the cost frequently exceeds the entire platform team payroll. This is the line item that turns a cost conversation into an investment conversation, because the CFO can map a dollar figure to a percentage of annual revenue rather than to a feature backlog.
This is where engineering quality matters most. When platform systems still run in production years after deployment, the longevity math replaces the quarterly ROI debate entirely. The infrastructure equivalent of compounding returns is the system that keeps paying for itself without a rewrite.
The platforms that survive budget reviews are the ones whose spend no longer needs defending.
Frequently Asked Questions
Q: How long does it take to see measurable ROI from platform engineering?
Platform productivity improvements typically emerge within weeks of MVP deployment. A complete ROI picture requires months of adoption data across multiple teams and workflows. Lightweight implementations at small scale can show ROI milestones in weeks. Broader organizational value takes longer to surface. The difference between the two is usually a question of scope, not speed.
Q: What is the real cost of building a platform team in-house?
Building a custom developer platform costs a lot when you factor in team salary, tooling, and the opportunity cost of delayed developer productivity. A typical in-house build takes much longer before any internal user sees a self-service workflow, compared to months for a deployed solution. The gap between those two timelines is where most of the hidden cost lives.
Q: How do you measure platform engineering ROI without double-counting productivity gains?
Separate three measurement layers. Layer one: infrastructure cost avoided, including cloud spend reduction and right-sizing. Layer two: developer time reclaimed, covering cycle time and manual provisioning hours eliminated. Layer three: incident cost reduced, tracked through downtime hours and mean time to recovery.
Each layer should map to a dollar value independently so they cannot be stacked to inflate the total. Attribution between layers should be auditable, not narrative.
Q: Why does the same platform team ship more features and burn more budget at the same time?
The 2.8x output figure counts what the platform enables across the entire engineering org. Every team that uses a golden path, every self-service deployment, every templated service. The 1.9x budget figure counts what the platform team itself consumes. Headcount, tooling licenses, cloud resources for the platform layer, and the maintenance burden of internal abstractions.
The two metrics measure different populations. They look contradictory but are consistent. The reconciliation is usually a single chart that shows both populations side by side.
Q: When does building a platform in-house actually make sense?
Build makes sense when you have a domain-specific workload that off-the-shelf platforms do not cover. It also makes sense when your engineering org exceeds a headcount threshold. At that point, the customization tax of a vendor product exceeds the build cost. Regulatory requirements that mandate owning the entire stack are another valid reason.
Below that threshold, the annual cost and multi-year timeline make buy the default. The math stays the same whether you run the build internally or hire a consulting partner.
Run the three-layer model against your last quarter and the real number will surface on its own.
About the author
Mayank Singh is a software developer at Levitation Infotech, where he builds web and AI-powered applications across the company’s fintech, healthcare, and enterprise projects.