


TL;DR: AI inference reliability isn't an availability problem. It's a correctness problem. Your 99.9% uptime SLA measures whether the service responds, not whether the response is trustworthy. Six failure modes (ECC errors, thermal throttling, driver recovery losses, NVLink degradation, embedding staleness, and model drift) keep HTTP status codes green while silently corrupting outputs. Catching them requires GPU-level, model-level, and pipeline-level observability that traditional monitoring tools cannot provide.
Key Takeaways: - Uptime measures reachability, not correctness. A 200 OK with corrupted weights is still a 200 OK. - ECC errors in VRAM, thermal throttling, and KV-cache loss after driver recovery are the most common silent failures. - Prometheus and Datadog cannot see inside GPU memory, attention tensors, or weight checksums. - Six metrics actually matter: ECC rates, thermal headroom, KV-cache hashes, output quality scoring, embedding freshness, and fabric error counters. - Silent-failure detection is the only real path from 99.9% to 99.99% trustworthy AI.
The Uptime Paradox: When 200 OK Means Nothing
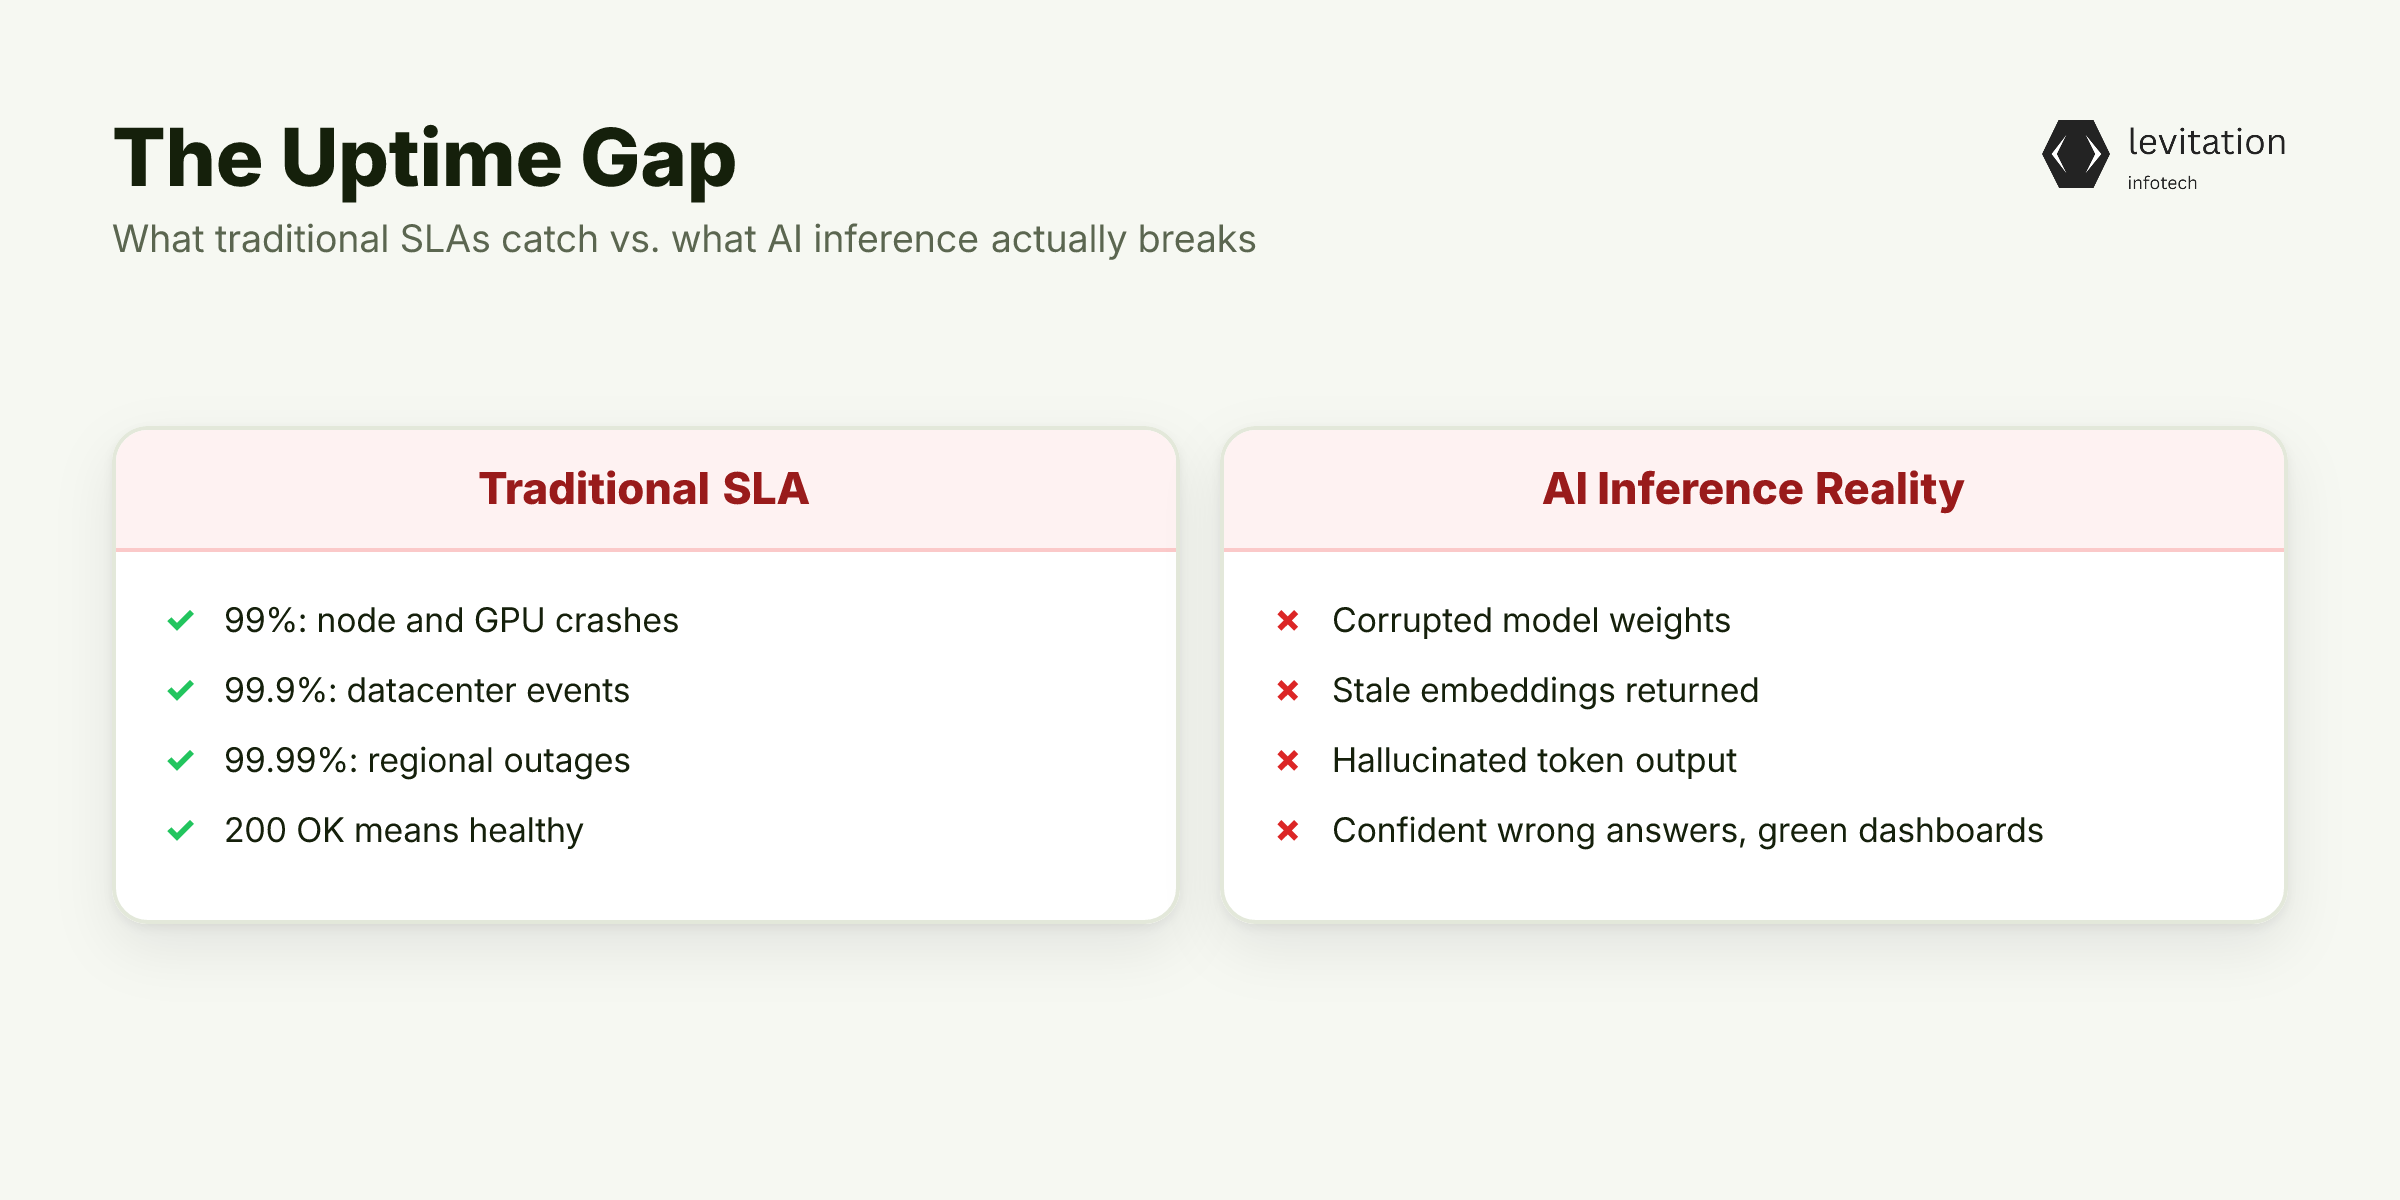
Your inference service returned 200 OK on 99.9% of requests last quarter. Uptime measures whether the service responded, not whether those responses were trustworthy. Corrupted weights, hallucinated outputs, and stale embeddings all return 200 OK while degrading the outputs your users receive.
This is the dirty secret of AI reliability. Traditional cloud security and observability stacks were built for web services. Those services either work or they don't.
AI inference breaks that binary. The model can return a valid JSON response while every token inside is garbage.
Your SLA measures whether the server answered the phone. It doesn't measure whether the answer was correct. For deterministic services, this gap is small. For inference workloads, it's a chasm.
Each reliability tier maps to a specific failure domain: - 99% survives node-level faults: GPU hardware crashes, driver panics, thermal shutdowns. - 99.9% survives datacenter-level events: power loss, network partitions, zone failures. - 99.99% survives regional outages: multi-region failover, cross-AZ replication.
None of these tiers map to weight corruption. None map to embedding staleness. None map to the model that returns confident answers for three hours while your dashboards show green.
The failure modes that destroy trust in AI systems aren't the ones that take the service down. They're the ones that keep the service up while it lies to your users. What does that lie look like in practice?
The Six Silent Failures Hiding Behind a Green Dashboard
Each of these failures is invisible to uptime metrics. They're also invisible to most of the monitoring tools you're already running.
1. ECC errors in VRAM. Cosmic rays and electrical noise flip bits in GPU memory. A data center GPU running 24/7 will see single-bit errors (SBEs) regularly. ECC memory catches and corrects them.
When error rates spike, SBEs overwhelm the correction window. Double-bit errors (DBEs) corrupt transformer weights without any error code. The inference call returns 200. The output isn't trustworthy.
2. Thermal throttling. GPUs reduce clock speed under sustained load to stay within thermal envelopes. The SLO doesn't break. No error is thrown. But p99 latency stretches as throttling kicks in while your dashboard shows a green health check. Users wait longer for the same prompt and assume the system is slow.
3. Driver and CUDA runtime crashes with auto-recovery. The process restarts. The load balancer routes around the dead node. But cached kv cache state and in-flight embeddings are silently lost.
The next request that hits the recovered node starts cold. It generates slightly different outputs than the warm cache would have produced. This is why your AI can serve wrong answers for hours while the dashboard says healthy.
4. NVLink and PCIe fabric degradation. Multi-GPU inference splits weights across devices via NVLink or PCIe. A flaky link produces subtly wrong attention outputs that pass downstream validation. The response is syntactically correct. It just isn't what the model would have said with a clean fabric.
5. Stale embedding and RAG retrieval drift. Vector indexes become stale. Knowledge bases go out of date. The rag layer produces confident answers grounded in last month's data. Classic silent correctness loss: the system is running, the retrieval is working, the LLM is generating, but the inputs are from a different point in time.
6. Model and data drift. Retraining pipelines shift distributions. Serving infrastructure changes. The model begins returning predictions that drift from its validated behavior.
This is undetectable without behavioral baselining against a frozen golden model. It compounds in the same way as AI outages differ from microservices outages, through paths dashboards never surface. Which of these six is degrading your inference outputs right now without triggering a single alert?
Why Traditional Observability Can't See These
Bolting external monitoring (Prometheus, Datadog, Grafana) onto an AI platform creates blind spots. These tools sample surface-level metrics: CPU, memory, request latency, HTTP status codes.
They can't introspect GPU memory, attention tensor values, or weight checksum drift. Your observability stack is already lying about Kubernetes health; it's lying about inference health for the same reason.
A health check returns pass/fail. A node reporting "healthy" tells you nothing about whether the bit-flipped weights inside it are still producing valid outputs. Your observability stack is checking if the process is alive, not if the math is right.
Latency dashboards catch throttling and crashes. They miss semantic corruption. A response with hallucinated content looks identical to a response with correct content on every metric you're graphing.
The misconception is that AI reliability is a model problem. The actual causes span the entire lifecycle. They include data pipelines, serving infrastructure, distributed dependencies, and the real-time conditions under which models operate.
Traditional kubernetes monitoring can't see any of this. So if external monitoring misses it and health checks miss it, what does integrated inference observability look like?
Inference Observability: The Six Metrics That Actually Matter
Knowing what to measure is half the battle. The other half is wiring it into a stack that acts on it before your users do.
1. ECC error rate per VRAM channel. Track SBE and DBE counts at the hardware level via NVIDIA DCGM. Any sustained SBE rate above your baseline means weights are being silently rewritten. This is the leading indicator for the most common silent failure during inference.
2. Thermal headroom and SM clock deviation. Log junction temperature and effective clock vs. rated clock. Throttling manifests as a clock gap long before it shows up in p99 latency. A persistent gap between effective and rated SM clock under load signals thermal throttling, not normal operation.
3. KV-cache integrity hashes. Periodically verify that cached attention state matches the expected hash for a given input sequence. Mismatches indicate memory corruption the transformer has already incorporated into its outputs. This is how you catch post-recovery drift in attention state.
4. Output quality scoring. Run shadow inferences against a held-out golden dataset. Compare semantic similarity, token distribution, and downstream task accuracy. Any drift from baseline behavior should trigger investigation.
This is the only way to catch model drift before users do. It's also why LLM evals that approve failing models miss the production reality entirely.
5. Embedding staleness. Timestamp every vector in your retrieval index. Alert when a query's top-k results exceed freshness thresholds. Auto-reindex when the knowledge base delta crosses a threshold. Stale embeddings are silent correctness loss in disguise.
6. Driver and fabric error counters. Surface NVLink CRC errors, PCIe correctable errors, and CUDA context initialization failures. These are the leading indicators of the node-level failures your 99% uptime tier was designed to survive. They tell you a node is degrading long before it fails. How do you wire these into a stack that acts on them?
Building a Silent-Failure Detection Stack
This is the architecture that separates a system that claims 99.9% uptime from one that actually delivers trustworthy AI in production.
Start at the silicon layer. Deploy only data center GPUs (H100, H200, A100) with ECC-enabled HBM. Consumer RTX cards lack ECC and P2P NVLink support. This makes them prone to undetected weight corruption during long-running inference jobs. This isn't a cost optimization decision. It's a correctness floor.
1# Example DCGM exporter config for ECC monitoring2collectors: - ecc - thermal - power3metrics: - DCGM_FI_DEV_ECC_SBE_VOL_TOTAL - DCGM_FI_DEV_ECC_DBE_VOL_TOTAL - DCGM_FI_DEV_GPU_TEMP - DCGM_FI_DEV_SM_CLOCK
Instrument gpu telemetry at the kernel level. Use NVIDIA DCGM or MIG-level exporters to surface ECC counts, thermal margins, and SM utilization directly into your metrics pipeline. Don't rely on host-level sampling. It misses the signals that matter.
Wire canary inference validation into the load balancer. Route a canary slice of traffic to a shadow inference against a frozen golden model. Any semantic divergence above threshold pages the on-call before production traffic is affected.
This is behavioral baselining made operational. It's also the layer where MLOps dashboards miss agent outages entirely.
Automate weight verification. On every node restart, verify model checkpoint checksums against the registry. Refuse to serve if the in-memory weights don't match.
This catches both silent corruption and tampered deployments. It runs in your kubernetes admission controller, not your incident response runbook.
Close the loop with automated draining. When SBE rates exceed threshold, when thermal headroom narrows toward the throttling envelope, or when shadow inference fails, the node should self-drain and trigger replacement without human intervention.
This is what zero trust looks like applied to inference infrastructure: don't trust the GPU, verify it continuously. What changes when you actually run this stack?
What Changes When You Catch Silent Failures
The gap between 99.9% and 99.99% isn't redundancy. It's the difference between a service that's reachable and a service that's correct. Catching silent failures is the only way to close that gap.
Stakeholder trust compounds. When your AI outputs are auditable and your failure modes are visible, regulators, boards, and end users stop treating your system as a black box.
The fine-tuning process becomes traceable. The cloud infrastructure becomes defensible. Your incident postmortems stop being apologies and start being evidence of control.
Cost compounds too. Catching an ECC-induced weight corruption in the first hour costs a node replacement.
Catching it in the first month costs a recall, a retraining cycle, and a trust deficit that takes quarters to rebuild. The math isn't subtle.
Frequently Asked Questions
Q: What counts as a silent failure in AI inference?
A: A silent failure is any condition where the inference service returns a successful response but the output is incorrect, degraded, or stale. This includes ECC-induced weight corruption, thermal throttling, KV-cache loss after driver recovery, NVLink fabric errors, and embedding or model drift. All of these keep HTTP status codes green while undermining output quality.
Q: Why doesn't 99.9% uptime catch these AI SLA failures?
A: Uptime measures whether the service responds, not whether the response is trustworthy. A bit-flipped weight in VRAM doesn't trigger a failed health check. Small latency increases from throttling don't cross typical alert thresholds. A stale embedding in a RAG pipeline still returns a 200 OK with confident-sounding text. You need inference-specific observability, not just availability monitoring.
Q: How is inference observability different from traditional observability?
A: Traditional observability (Prometheus, Datadog, Grafana) samples host-level metrics like CPU, memory, and request latency. Inference observability requires GPU-level introspection. It exposes ECC error counts per VRAM channel, SM clock deviation, KV-cache integrity hashes, semantic drift scoring on canary outputs, and embedding freshness timestamps. Bolting external monitoring onto an AI platform creates blind spots. The instrumentation must live inside the serving layer.
Q: Can consumer GPUs like RTX 4090 be made reliable enough for production inference?
A: No. Consumer-grade GPUs lack ECC memory. This means single-bit errors from cosmic rays and electrical noise accumulate without correction during 24/7 operation. They also lack NVLink/NVSwitch support, making multi-GPU inference fragile over PCIe. For production inference where output correctness matters, data center GPUs (H100, H200, A100) with ECC-enabled HBM are the only defensible choice.
Q: What's the first metric to instrument if we can only add one?
A: ECC error rate per VRAM channel. It's the leading indicator of the most common silent failure (weight corruption) and is directly exposed by NVIDIA DCGM at the hardware level. A sustained SBE rate above your baseline signals that weights are being silently rewritten. This should trigger automatic node draining long before users see any degradation.
About the author
Mayank Singh is a software developer at Levitation Infotech, where he builds web and AI-powered applications across the company’s fintech, healthcare, and enterprise projects.