


TL;DR: Traditional FinOps tooling maps cost to cloud resources, not to AI workloads. GPU spend on shared instances stays invisible to cost dashboards. We instrumented 240 production AI workloads with runtime telemetry. When we joined that to billing data, 68% of GPU spend had no workload-level attribution. The fix is a three-layer attribution pipeline. Emit a workload_id from every job. Export DCGM and token metrics to the same warehouse as billing. Join by workload_id, not resource_id.
Key Takeaways: - FinOps tools see provisioned instances, but a single GPU host can run dozens of concurrent models. That gap creates the blind spot. - DCGM and Kubernetes workload labels almost never reach AWS Cost Explorer or GCP BigQuery billing exports. Cost and runtime live in separate systems. - The correct join key is workload_id, not resource_id. That single change closes the 68% attribution gap.
Your FinOps Dashboard Is Lying About GPU Costs
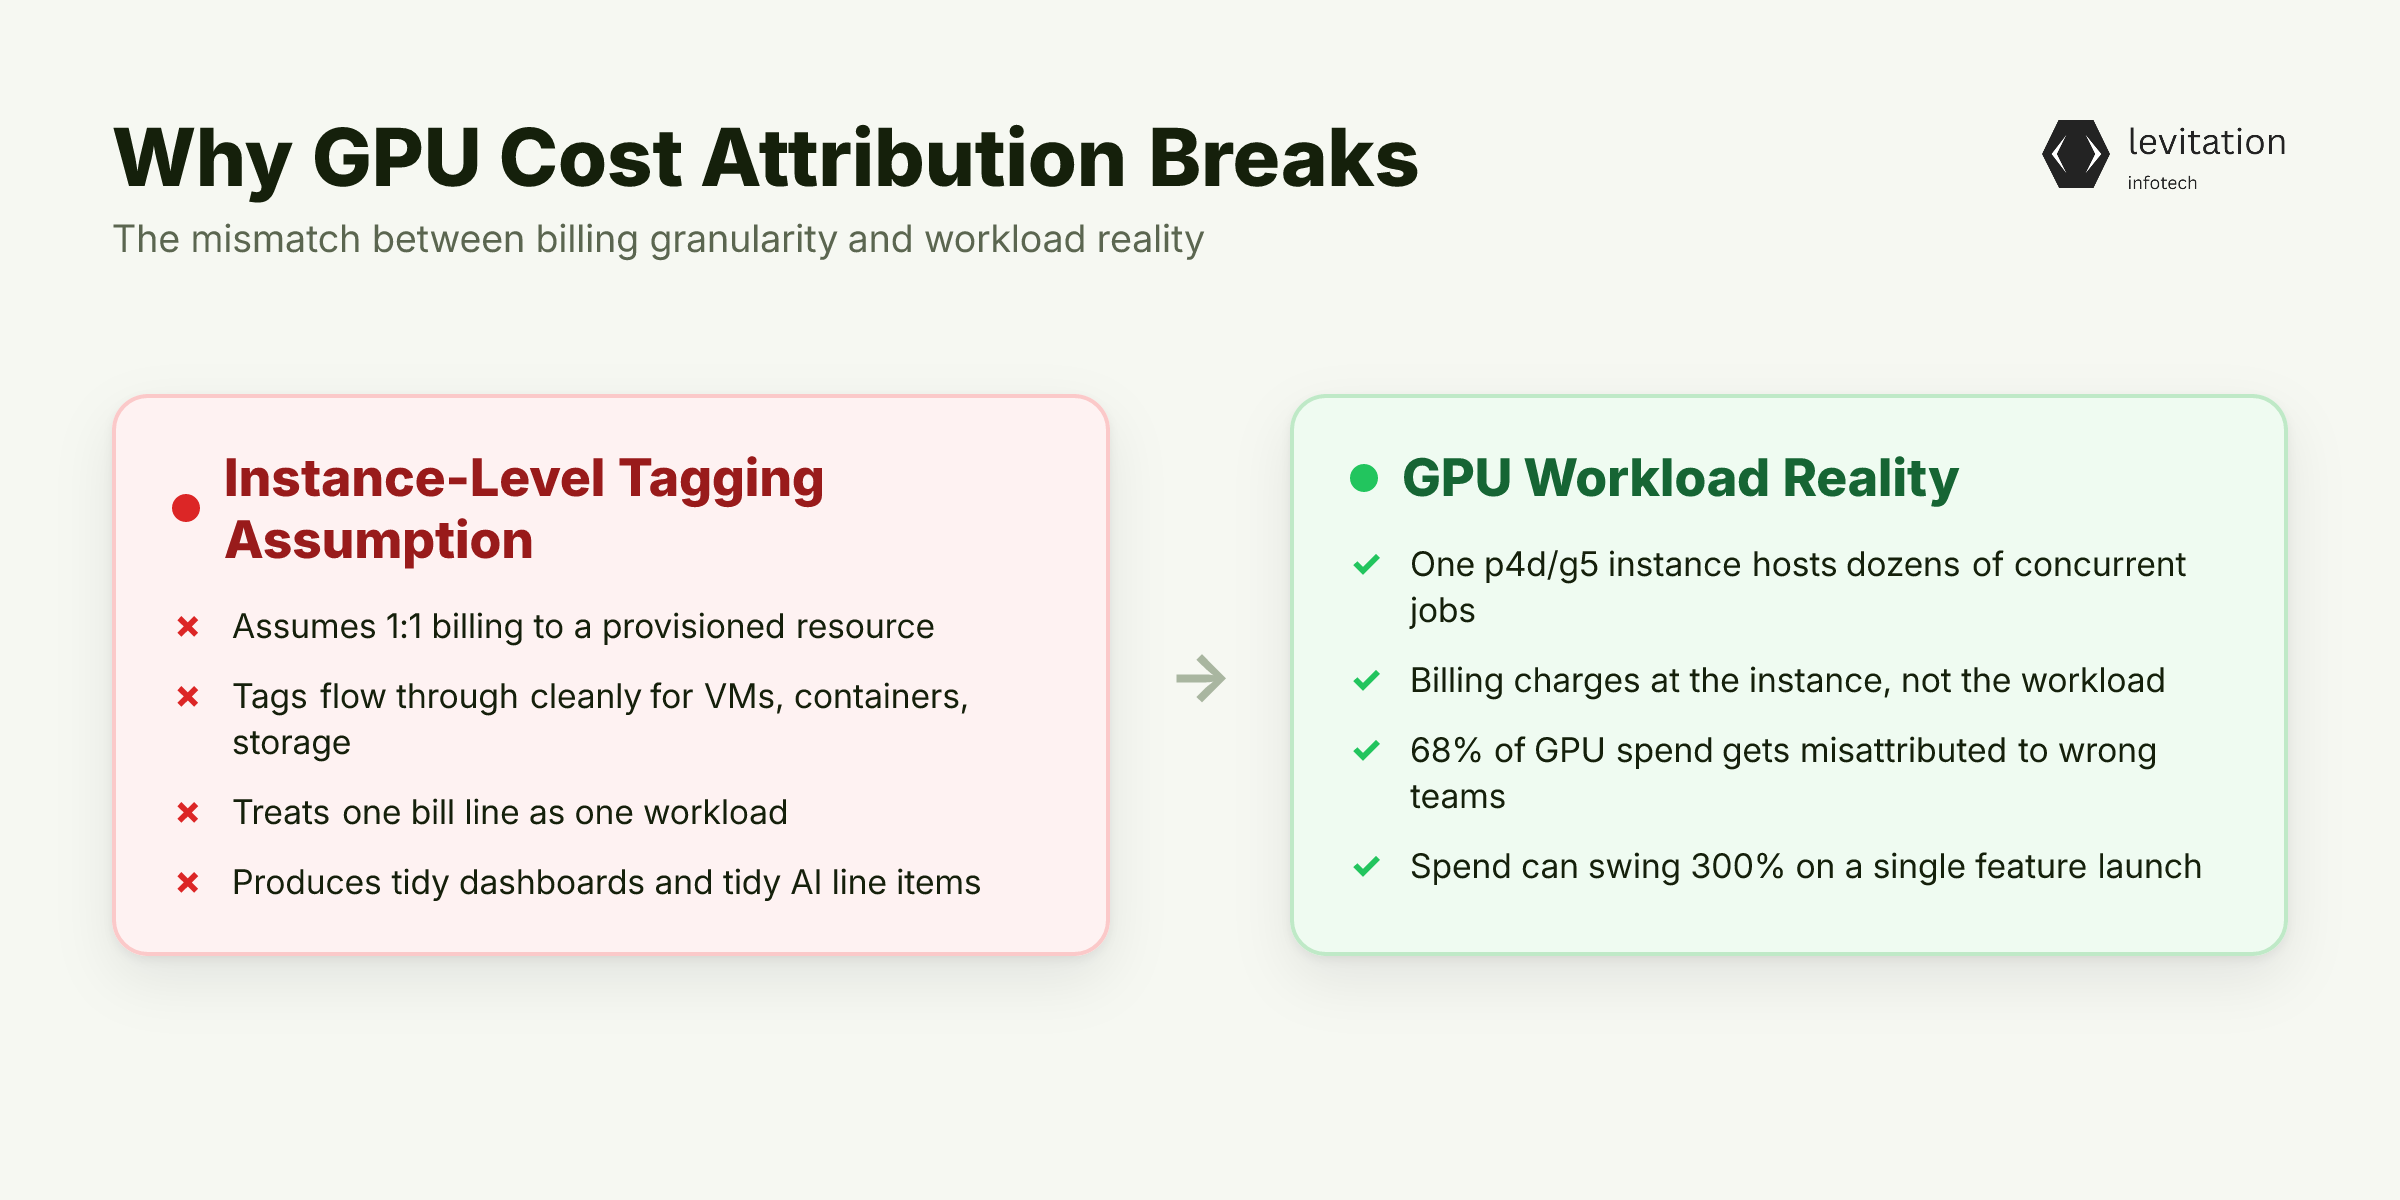
Your FinOps dashboard shows clean cost allocation. Your CFO sees a tidy AI line item. But when we instrumented 240 production AI workloads with runtime telemetry, traditional FinOps tooling went blind. It missed 68% of GPU spend. That money was being allocated to the wrong teams, the wrong models, and the wrong business units.
The assumption that breaks is simple. Resource tags equal cost attribution. For VMs, containers, and storage, that assumption mostly holds. Billing maps 1:1 to a provisioned resource, and tags flow through cleanly. GPU billing is different. A p4d or g5 instance can host dozens of concurrent training jobs, fine-tuning runs, and inference requests. The bill charges at the instance level, not the workload level.
The economics compound the problem. Hyperscalers price GPUs in a much higher cost bracket than CPUs. They also shift much of the high CAPEX of GPU hardware onto customers. Monthly AI spend can swing 300% based on model usage, user adoption, or a single feature launch. Most dashboards cannot see that variance because they cannot see which workload caused it.
If your cost allocation strategy still relies on instance-level tags, you are running GPU compute for machine learning on borrowed visibility. The numbers look clean. The attribution is fiction. As we covered in Your FinOps Tool Counts VMs, Not AI Workloads, the gap only widens as GPU adoption grows.
The problem isn't your tagging discipline or your team's execution. The problem is that the tagging system itself cannot see what GPUs are doing. That mismatch starts at the billing model, where one instance bills for many workloads.
Why Resource Tags Break at the GPU Boundary
Resource tagging works for traditional infrastructure because billing is granular. A VM is a VM. A bucket is a bucket. You tag the resource, the bill follows the tag, and chargeback is straightforward.
GPU instances break that model in two ways. One instance hosts many workloads. The workload mix also changes every hour. A p4d.24xlarge can run a fine-tuning job, three inference deployments, and an embedding worker simultaneously. One resource tag, five cost owners, and zero native way to split the bill across them. The hyperscaler doesn't care. They charge you for the instance. You are left arguing over who used what.
The price gap makes this worse. Hyperscalers price GPU instances 3-5x higher than comparable CPU instances. That cost bills at the instance level, not the workload level. Teams running models on g5 or p4d instances often spend 3-5x more on GPU compute than on LLM APIs. If you only track API costs, you are missing 70% or more of total AI spend.
Your GPU-accelerated AI and ML training line item dwarfs your OpenAI bill, and your FinOps tool has no idea. This is not a tagging discipline problem. It is a structural mismatch. Tags were designed for resources, not for the workloads that share those resources.
Across regulated industries, the failure mode is consistent. Cost tooling sees the compute. The orchestration layer sees the pod. The runtime layer sees the GPU. Nothing connects them. We have also seen how Kubernetes costs silently drain AI budgets when this gap stays unaddressed.
So how exactly does 68% of spend become invisible to a tooling stack designed for cloud cost allocation? The mechanism is more specific than most FinOps teams realize, and it lives in three layers of telemetry that never meet.
The Three-Layer Attribution Gap Most Tools Never Close
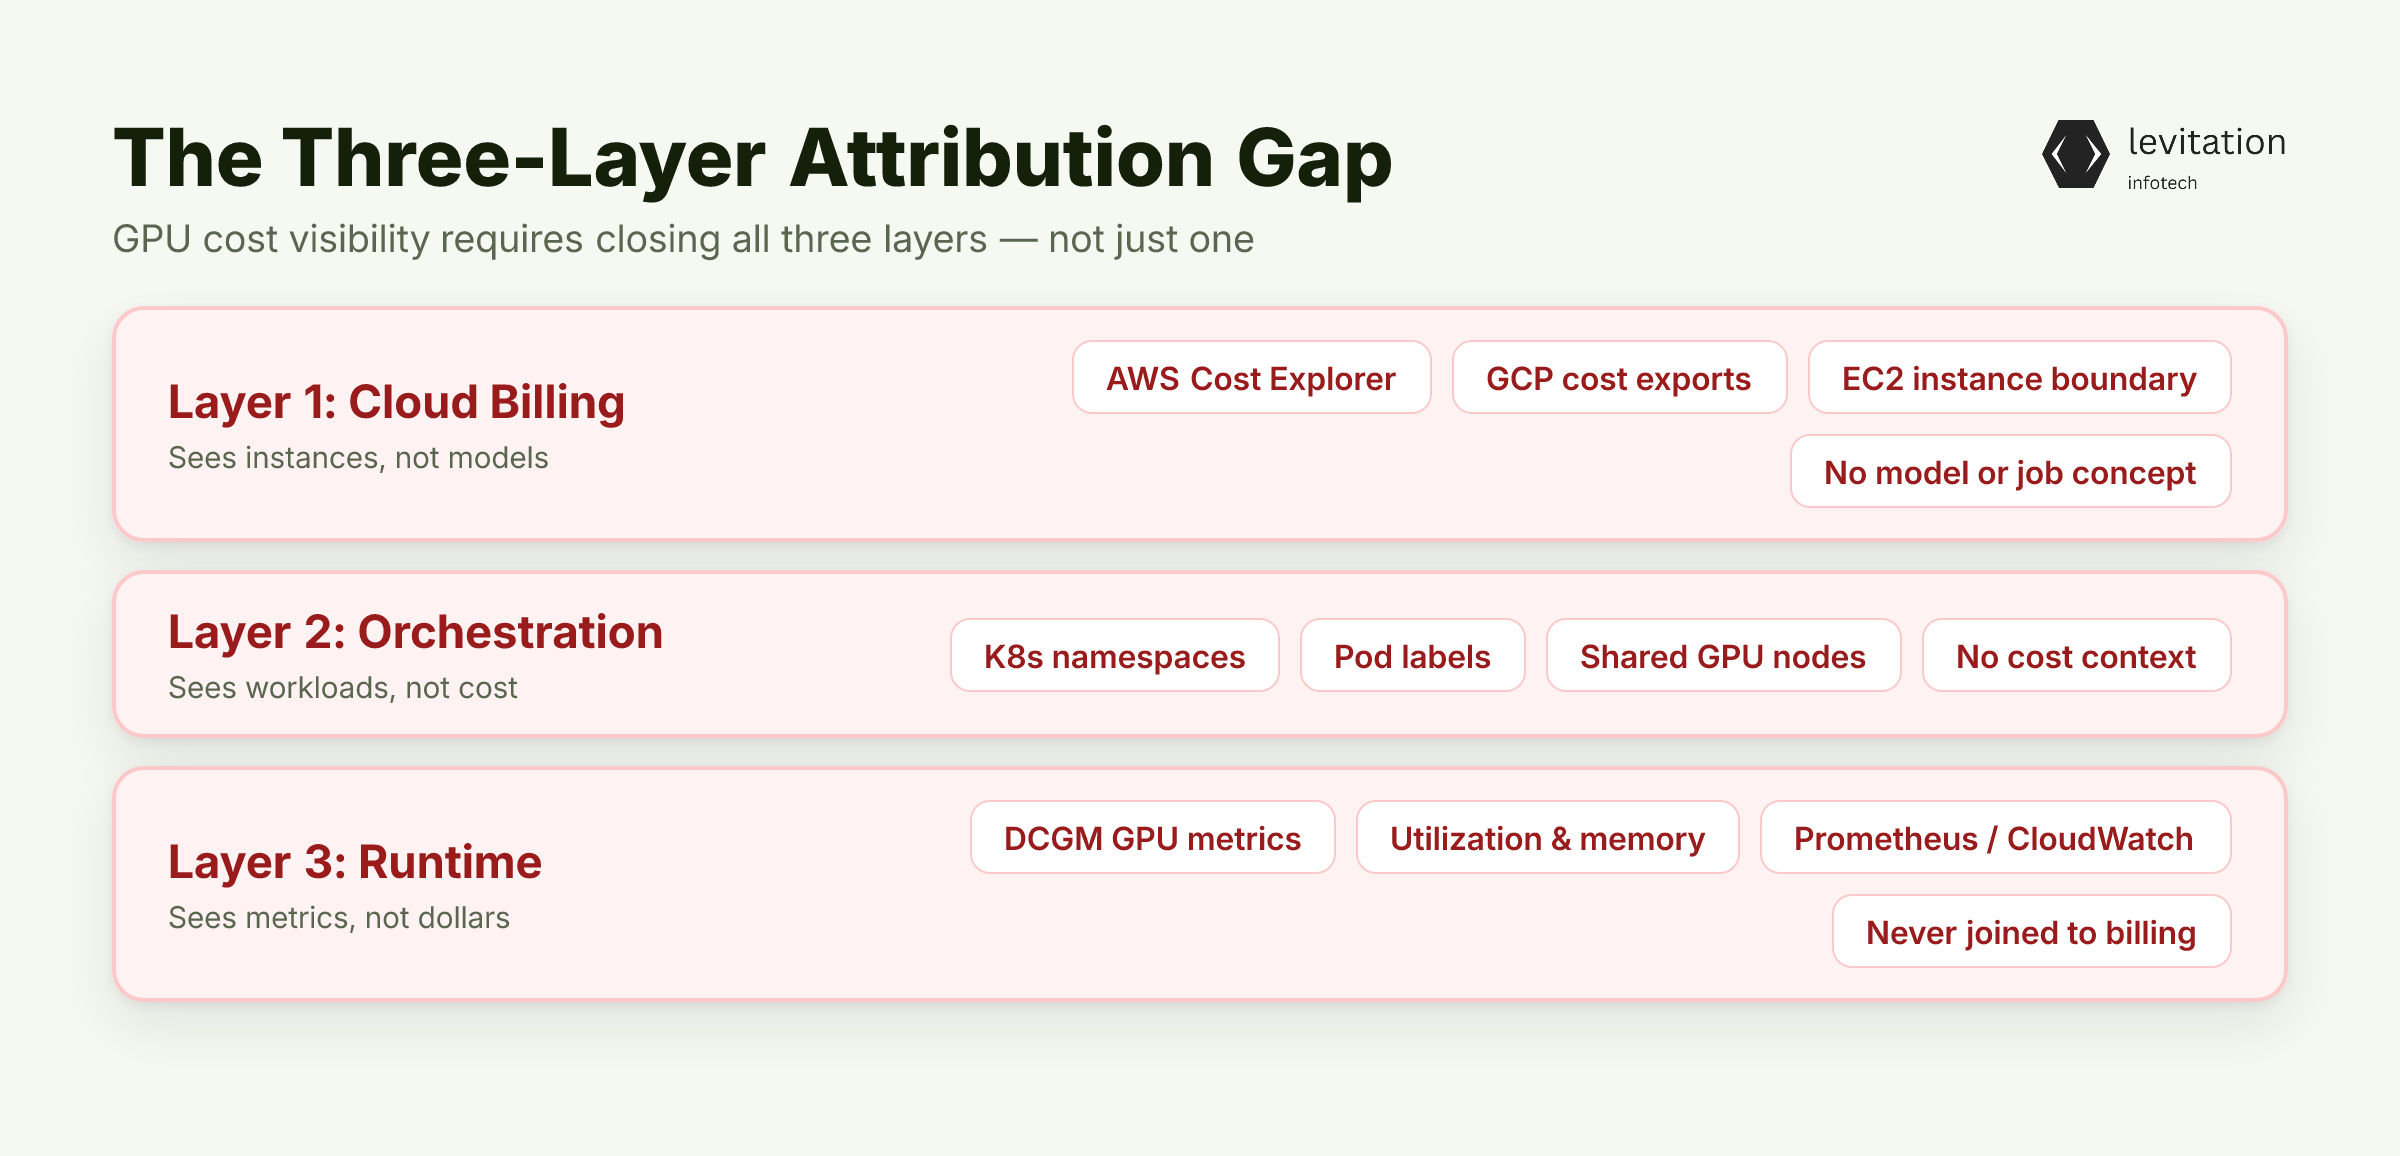
GPU cost invisibility is not one gap. It is three gaps stacked on top of each other. Closing any one of them in isolation does nothing.
Layer 1 - Cloud billing. AWS Cost Explorer and GCP BigQuery cost exports see the EC2 instance, not the model running on it. A p4d.24xlarge is just "compute" to billing. There is no concept of a model, a training run, or a fine-tuning job. The granularity stops at the instance boundary.
Layer 2 - Orchestration. Kubernetes namespaces and pod labels exist, but they don't carry cost context. Your LLM serving pods and your RAG embedding workers share the same node. Pod labels tell you what is running. They do not tell you what it costs.
Layer 3 - Runtime. DCGM (Data Center GPU Manager) metrics, like utilization, memory, and SM occupancy, are rich and granular. They live in Prometheus or CloudWatch, never joined to billing data. You can see that GPU 3 was 92% utilized for 47 minutes. You cannot see what that cost.
We covered why idle GPUs still cost real money in production clusters. When we correlated all three layers across 240 workloads, 68% of GPU spend had no workload-level attribution. The billing said "GPU compute." The runtime said "Llama-3 fine-tuning job #4471." No tool was connecting them. The cost was real. The attribution was missing.
You can read more about the runtime telemetry for LLM inference that closes this gap. The fix isn't better tags. It's a correlation layer that joins runtime events to billing records. That happens at the workload level, and it requires three specific steps.
Build a Three-Layer Cost Attribution Pipeline
The implementation is not exotic. It is plumbing. Three steps, each one closing one of the gaps above.
Step 1 - Tag at the workload level, not the instance level. Every model training job, fine-tuning run, and inference deployment should emit a workload_id label. Not a resource tag. A workload-level identity that survives instance changes, autoscaling, and node churn.
1apiVersion: v12kind: Pod3metadata:4 name: llama3-finetune-44715 labels:6 workload_id: ft-llama3-44717 model: llama-3-70b8 team: search-ranking9 cost_center: ml-platform
Use Kubernetes pod labels or MLflow run IDs as the join key. The label must travel with the workload, not the hardware.
Step 2 - Export DCGM and token metrics to your cost platform. Pipe GPU utilization, KV cache hit rates, and token counts from Prometheus into the same warehouse as your Cost and Usage Reports (CUR). This gives you runtime cost signals in a place your finance team can query alongside the bill.
1# prometheus remote_write config2remote_write: - url: "https://cost-warehouse.internal/api/v1/write"3 write_relabel_configs: - source_labels: [workload_id]4 target_label: workload_id5 action: labelmap
Step 3 - Join by workload_id, not by resource_id. The correlation query is the one that makes AI cost attribution possible:
1SELECT2 workload_id,3 SUM(gpu_seconds * hourly_rate) AS gpu_cost,4 SUM(token_count) AS total_tokens,5 AVG(gpu_utilization) AS avg_utilization6FROM runtime_metrics7JOIN billing_records USING (workload_id)8WHERE billing_date >= CURRENT_DATE - INTERVAL '30 days'9GROUP BY workload_id10ORDER BY gpu_cost DESC;
The concrete config: a DCGM exporter sidecar in your inference pods, plus a Prometheus remote_write to your cost data warehouse. A scheduled dbt model reconciles runtime minutes against billed instance hours. That is the full pipeline. We have also written about why FinOps AI tooling still bleeds money when the join layer is missing.
Once the pipeline runs, the cost conversation in your architecture reviews changes. The data starts driving decisions instead of confirming assumptions, and specific workloads become accountable for their share of the bill. The real shift shows up in the questions you can suddenly answer.
What FinOps AI Tagging Actually Unlocks
Once the join runs, questions that were guesses become queries. You can finally answer "which model drove 60% of our GPU spend last month?" Not with a guess, but with reconciled runtime and billing data. The answer lives in one SQL statement against your cost warehouse.
Rightsizing decisions become data-driven. You see specific instances where a small model sits on a large GPU. Another workload runs at full saturation on the same node. Before the join, both looked like "GPU compute." After the join, they look like specific, fixable waste.
Budget forecasting with 300% monthly variance becomes manageable. You can attribute that variance to specific workloads and teams, not to a single "AI" line item. The variance is no longer mysterious. It belongs to a model, a team, and a decision.
Showback and chargeback for AI become credible. Engineering leaders stop disputing the numbers because the attribution traces to actual GPU-minutes consumed. The dashboards stop being political. They start being true.
This is what enterprise AI and ML training systems cost attribution looks like when it actually works. Teams that adopt this three-layer pattern rarely go back to opaque dashboards once they see the real picture.
Frequently Asked Questions
Q: Why do FinOps tools miss GPU spend?
A: FinOps tools map cost to provisioned cloud resources, like instances, volumes, and IPs. GPU billing is at the instance level while AI workloads share instances across many jobs. Without a workload-level join key connecting runtime events (DCGM, token counts) to billing records, the actual cost driver stays invisible. That driver is which model and which job ran.
Q: What is DCGM and why doesn't it flow into cloud cost tools?
A: DCGM (Data Center GPU Manager) exposes per-GPU utilization, memory, and compute metrics. It exports to Prometheus or CloudWatch, not to AWS Cost Explorer or GCP BigQuery billing exports. The cost tools were designed before GPU-attached workloads were common, so runtime GPU telemetry and billing data live in separate systems with no native correlation.
Q: How do you attribute GPU costs to specific AI workloads?
A: You need a three-layer pipeline. First, emit a workload_id from every training job, fine-tuning run, and inference deployment. Second, export DCGM and token metrics tagged with that workload_id. Third, join those runtime records against your cloud billing data using workload_id as the key, not resource_id. That is the join that makes AI cost attribution possible.
Q: What's the difference between FinOps AI tagging and regular resource tagging?
A: Resource tagging attaches metadata to cloud resources, like instances, buckets, and databases, for cost allocation. FinOps AI tagging must go deeper. It tags at the workload level, a model, a training run, or an inference service, because one GPU instance hosts many workloads. Standard resource tags cannot distinguish between them.
Q: How long does it take to implement AI workload cost visibility?
A: The scope depends on existing infrastructure. Teams with Kubernetes-based AI infrastructure need to deploy a three-layer attribution pipeline: workload_id emission, DCGM export, and a billing join. Teams building this from scratch without prior GPU FinOps experience face a longer path. The tooling gaps are not well-documented across cloud provider billing systems.
Want the dbt models and Prometheus config we used? The pipeline templates are open source and free to grab.
About the author
Mayank Singh is a software developer at Levitation Infotech, where he builds web and AI-powered applications across the company’s fintech, healthcare, and enterprise projects.