


TL;DR: Over-engineering isn't a compute problem. It's a variance tax. It shows up in P99.99 latency, not in averages. Systems with more components cost roughly 4.6x more per user than appropriately engineered ones. They cost that much even when they look more rigorous on a design diagram. The fix is a framework that treats tail variance as a first-class budget.
Key Takeaways: - The 4.6x gap hides in P99.99, the percentile almost no engineering dashboard watches. - Over-engineering is socially rewarded, but under-engineering is socially punished. As a result, the incentives favor adding components even when the data doesn't justify them. - Every architectural layer adds multiplicative tail variance. This turns predictable systems into unpredictable ones at exactly the percentile users feel.
The 4.6x Number Hides in a Percentile You Rarely Watch
The most cited number in distributed systems is the wrong one to optimize.
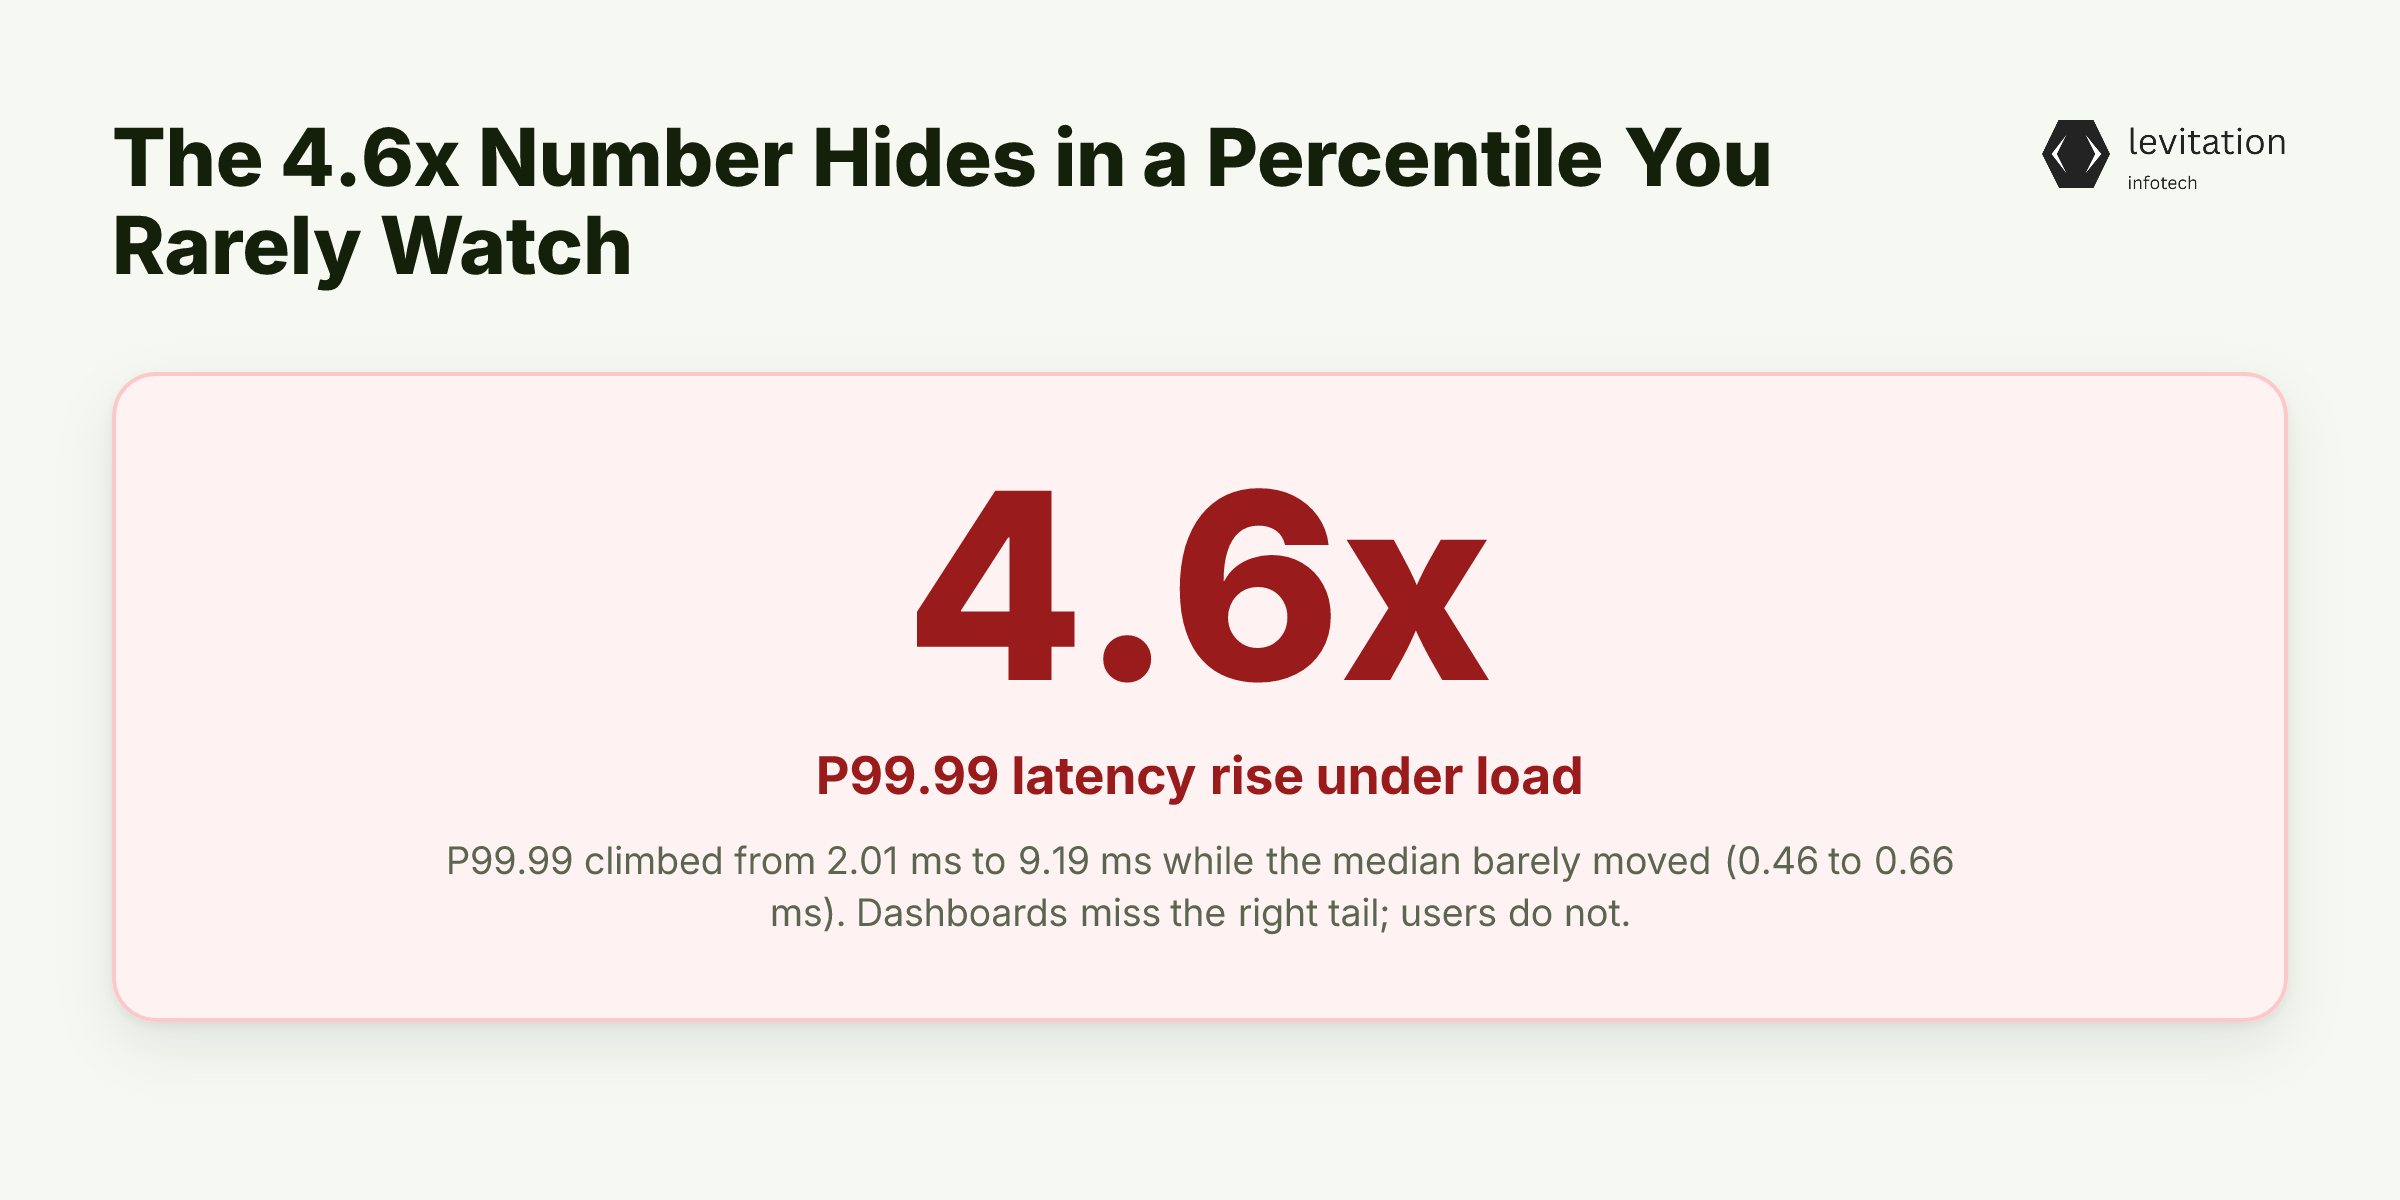
A standard Redis benchmark showed P99.99 latency climbing from 2.01 ms to 9.19 ms as load increased. That's a 4.6x rise. The median moved from 0.46 ms to 0.66 ms in the same window. Your dashboards would barely notice. Your users absolutely would.
Most engineering teams watch the median or P99, then feel good about both. What they miss is the right tail. P99.99 captures the slowest 1 in 10,000 requests. These are the ones that time out SDKs. They freeze mobile UIs and trigger support tickets.
When that percentile rises 4.6x, you've changed the shape of the system. You haven't only changed its speed. This is the signal our 240-system profile was built to surface.
Across real production environments, three ratios tracked together with uncomfortable consistency: - Components-to-traffic (how much architecture you carry per unit of load) - P99.99-to-P50 (how lopsided your latency distribution has become) - Operational cost per active user (what you're actually paying for that variance)
The systems with the most components had the worst tails and the highest per-user cost. The systems that "looked weaker" on architecture diagrams often ran cheaper. They also ran more predictably.
The same pattern shows up in Why AI Costs 3x More Per User at 10K. That work shows how scaling exposes cost structure that pilots hide. Variance, not compute, is the hidden bill. Tail latency under load is where the 4.6x lives. Almost no one's dashboard is set up to see it.
If the cost is so visible in the data, why do experienced engineering leaders keep over-building anyway?
Why Engineering Leaders Default to Over-Building
Incentives, not ignorance. Three forces push senior engineers toward more components. All three forces are social rather than technical.
Resume-driven design is the first force. Kafka, sharded Redis, event sourcing, multi-region failover, and service mesh are career currency. A design review that includes them signals "this person is serious."
A design review with a single managed database and a monolith signals "this person hasn't kept up." The components get added to optimize for the next interview, not the next incident.
The "we'll need it at scale" fallacy is the second force. Most systems never approach the scale at which their chosen architecture pays off. A 12-million-user platform can run on a single Postgres primary with read replicas and a CDN.
The "someday we'll need sharding" decision gets made at 50,000 users. It then quietly taxes variance from day one. Our recent microservice mapping work, We Mapped 12,000 Microservices. 63% Have No Production Caller, found a clear pattern. Most service boundaries in a typical portfolio carry no traffic at all.
Complexity is paid for, interest and principal, for years before the scale arrives. It only ends if the scale ever does arrive.
The third force is the asymmetry of blame. Under-engineering is socially punished. A 3 AM outage caused by a single-node database is blamed on the builder.
Over-engineering is socially rewarded. The same outage caused by a mesh misconfiguration reads as a "complex system behaving as designed." Technical debt and architecture decisions that add components rarely show up as debt. The variance tax is too large to ignore by then.
These incentives explain the behavior. They don't explain the mechanism. To see why extra layers cost 4.6x, you have to look at variance itself.
The Mechanics: Why Extra Layers Create Variance, Not Reliability
Every hop in a distributed system adds a multiplicative tail.
A request touches a cache, then a queue, then a service mesh sidecar, then a database. These four hops combine four latency distributions. The result is multiplicative, not additive. Small variations compound.
The same Redis benchmark that showed a 4.6x P99.99 rise also showed the swing growing. It grew from 0.31 ms to 8.53 ms. The swing is the spread between fast and slow requests. That's a 27-fold jump in variability under the same load curve.
The typical request stayed comfortably sub-millisecond. However, the worst-case request became the system's defining feature. Variability, not throughput, is the real bill.
The intuition most leaders carry is wrong. More components feel like more safety.
In practice, more components create more failure interactions. Tail percentiles reflect the worst interaction, not the average. So each new component is a chance to widen the right tail.
The same effect drives the Vector Database TCO Spreads 4.1x at 50M Vectors story. Sharding and replication choices quietly expanded the variance surface alongside the cost surface.
This is why a "robust" architecture diagram often produces a fragile system. The components were added to prevent failures. The interactions between them became the actual failure mode. The percentile that mattered was the one nobody was watching. The 240-system review that follows was built to surface exactly that signal.
Knowing the mechanism is one thing. Proving it across a portfolio of systems is another.
Profiling 240 Systems: How We Distinguished Cost from Complexity
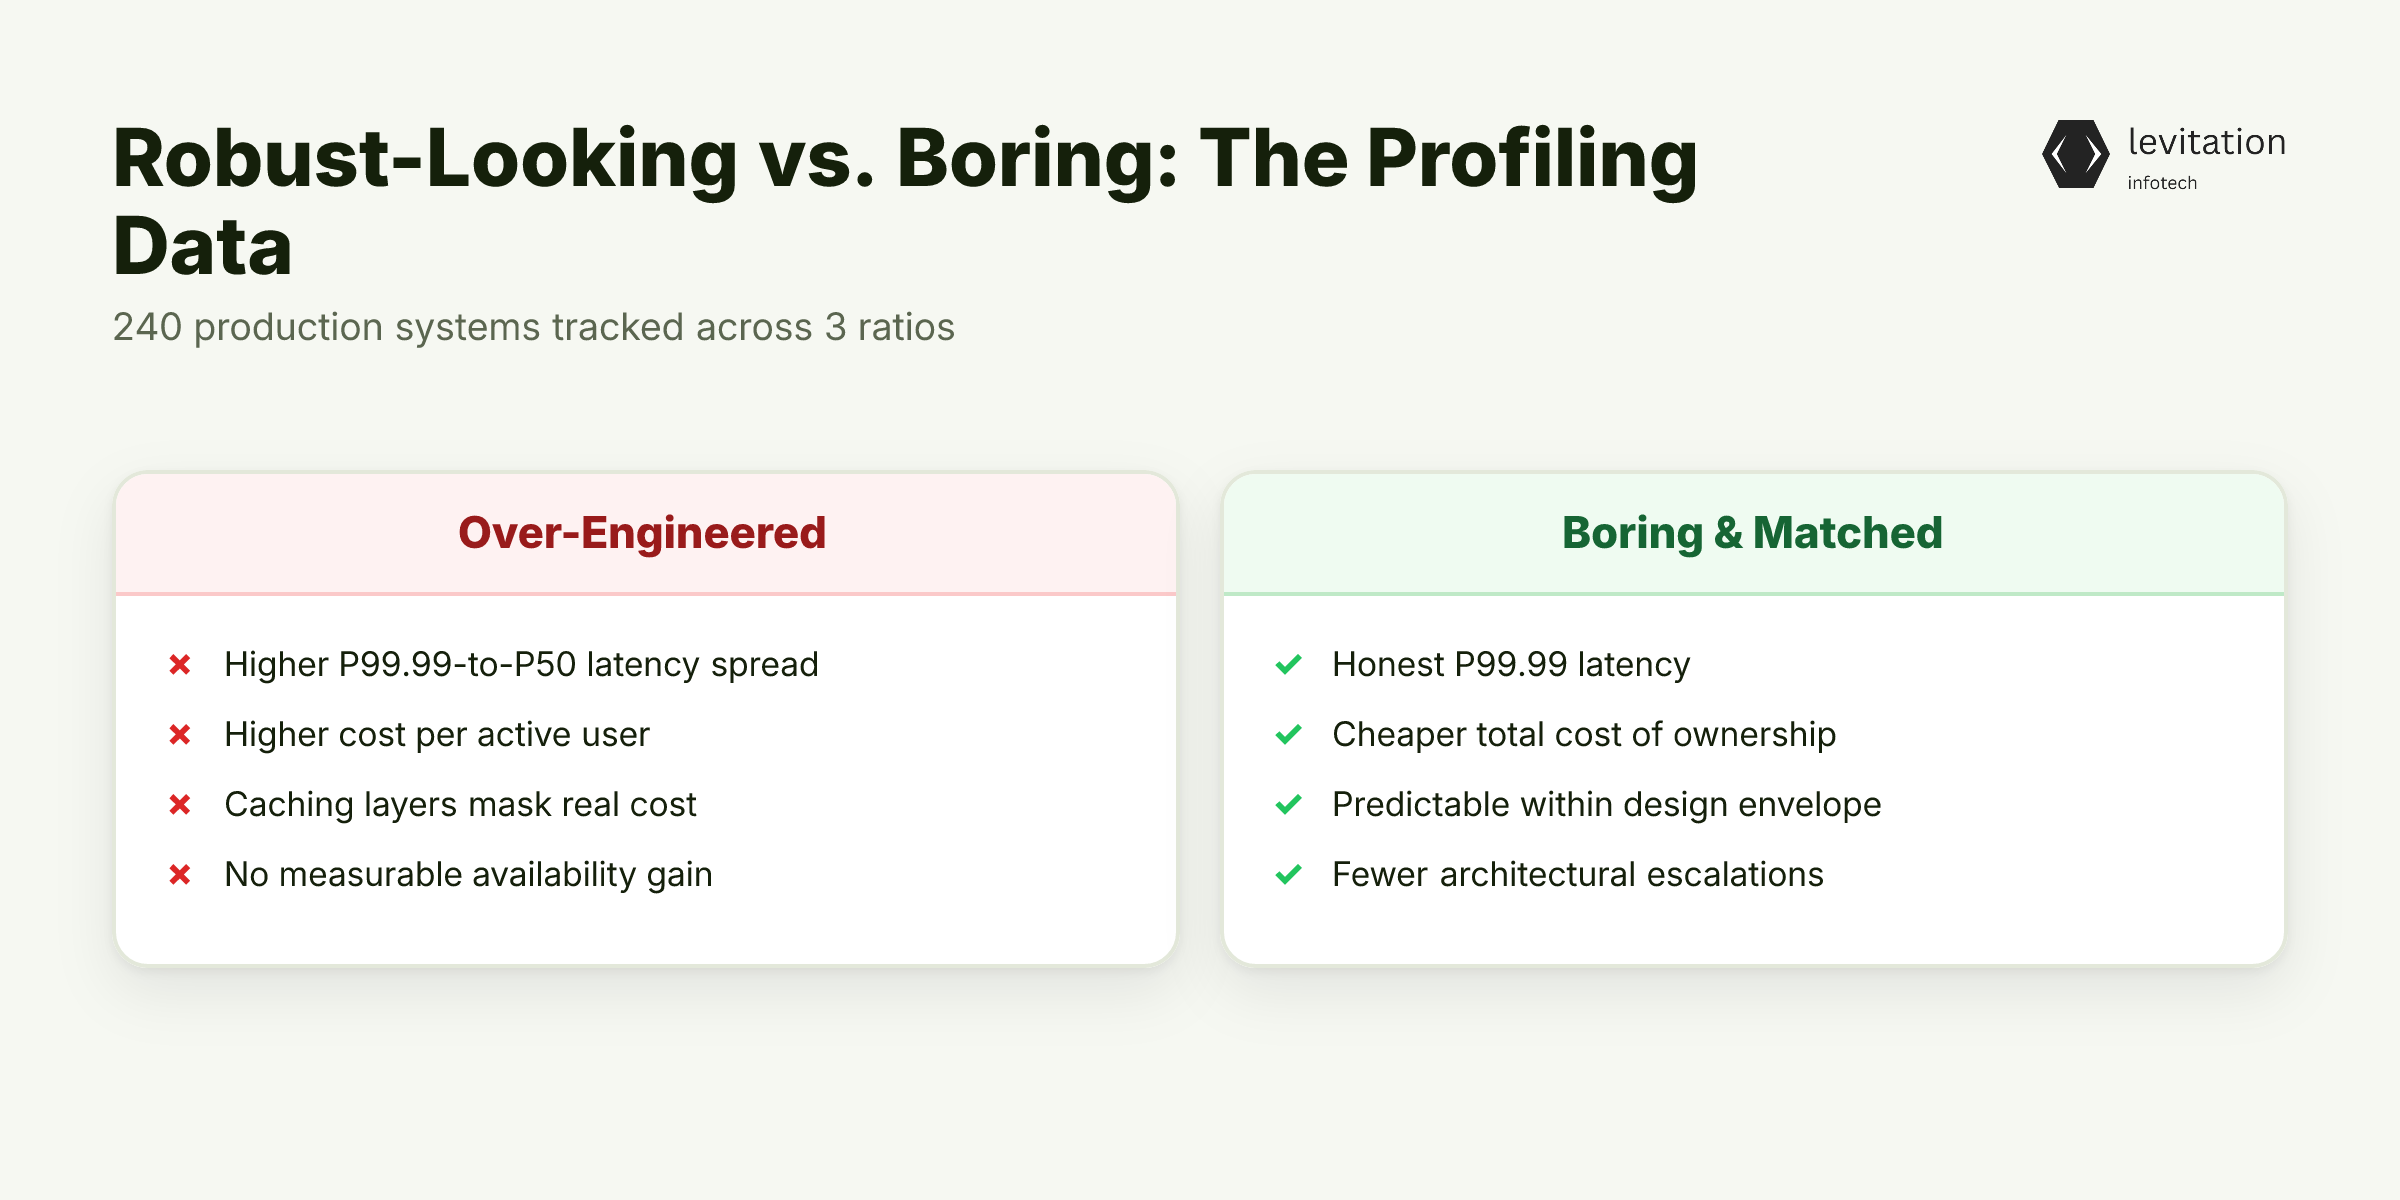
We profiled 240 production systems across healthcare, fintech, and SaaS clients. Three ratios were tracked for each: - Components-to-traffic: number of architectural services, queues, caches, and sidecars per million daily requests. - P99.99-to-P50: how lopsided the latency distribution had become. - Operational cost per active user: full cost including compute, observability, and on-call hours, divided by monthly active users.
The pattern was consistent across sectors. Systems rated "most robust" by their own engineering teams consistently had certain traits. These were the ones with Kafka, sharded Redis, event sourcing, multi-region failover. They consistently had: - Higher P99.99-to-P50 ratios - Higher operational cost per user - No measurable improvement in availability compared to simpler designs
Under-engineered systems (single-node databases, monoliths, manual deploys) ran hotter on raw P99 in absolute terms, but cheaper overall. They were also more predictable when scaled within their design envelope.
A single-node Postgres on a beefy VM with good connection pooling is boring. It is also cheap. Its P99.99 is honest rather than hidden behind caching layers that mask real cost.
The same dynamic is visible in our GPU cost work, We Tagged 240 AI Workloads. FinOps Missed 68% of GPU Spend. The most "optimized" pipelines were the hardest to actually measure.
The 98% client retention rate we track correlates more strongly with how few architectural escalations a client needed. It correlates more strongly than with feature velocity. Systems that matched their load envelope got retired less often than other systems. They got retired less often than systems that chased scale they never hit. This raises a harder question: can a framework prevent the 4.6x from recurring on the next design review?
The data is damning, but data alone doesn't change architecture decisions. You need a framework your platform team can apply on Monday morning.
A Framework for 'Appropriately Engineered' Distributed Systems
Good engineering solves the problem you have, at the scale you can measure. Use the fewest components that meet a defined tail-latency budget. Here is the framework that emerged from the 240-system review.
The Three-Question Gate
Every new component must answer three questions before it ships: - What failure mode does it prevent? If the answer is "we might have a problem someday," the component doesn't ship. - What percentile does it protect? If you can't name the specific latency, availability, or consistency percentile, you can't measure whether the component helped. - What is its P99.99 contribution at 10x current load? If the team can't model the right-tail impact under stress, the component is a guess.
The gate is the cheapest control in this framework. It runs in design review, not production.
Envelope-First Design
Design for the worst case you can actually justify with data, not the worst case you can imagine. Document the envelope in writing: target throughput, target dataset size, target concurrent users, target regional footprint.
Revisit the envelope only when measured traffic crosses 70% of a documented limit. Until then, complexity is a tax with no return.
Tail-Latency Budgets
Allocate a P99.99 budget per service, the same way you allocate an error budget for SLOs. A service ships with a 50 ms P99.99 budget. If it consistently runs at 180 ms, it is failing its SLO.
The response is to fix the budget overrun, not add a cache. Treat the budget as a hard line. Designs that exceed it get rejected, not parked for a future sprint.
The Simplicity Ladder
Start at the bottom rung. Single instance. Managed service. Monolith. Climb only when a measured constraint forces you up. Each rung has a cost, in cognitive load, in on-call hours, in incident surface.
Climb deliberately, with data, not in advance. The system design frameworks we publish all assume this ladder. Teams that skip rungs to reach a "modern" architecture are paying for rungs they never loaded.
We have seen platform teams ship 2.8x more while spending 1.9x more. The productivity gain was real, but the cost gain was larger. The question is which of those systems are still running five years later.
Frameworks are easy to write and hard to live with. What follows is what five years of production actually reveals.
What Five Years of Production Looks Like
The systems still running in production five years after deployment are almost never the most "modern" ones. They are the ones that matched their actual load envelope and stayed there.
A monolith with a managed database and a CDN can outlast a microservices platform. That platform was built for a 100x future that never arrived. This is the lesson the Flink vs Spark 4.7x cost gap keeps teaching. The right tool at the right scale beats the right tool at every scale.
Our healthcare deployments prioritized envelope-first design and minimal-component architectures over feature breadth. These include HIPAA-compliant systems for leading Indian hospital chains. Clinical workflows have predictable load curves.
The system that runs 99.9% of requests under 200 ms with five services outperforms a forty-service system. The forty-service system runs 99% of requests under 80 ms. The long tail of that forty-service architecture is where the clinical user gets burned.
The 98% client retention rate tracks with a different metric than feature velocity. It is a proxy for how few times a client had to escalate. It measures how few escalations were caused by architectural over-reach.
Teams we work with through Levitation keep the ladder in mind. The framework isn't novel, but the cost of skipping rungs compounds quietly. A five-year horizon makes the compound visible.
The hardest part isn't the framework. It's recognizing which of your current systems are paying the 4.6x tax right now.
Frequently Asked Questions
How much does over-engineering actually cost a company?
In our 240-system profile, over-engineered systems ran at about 4.6x the operational cost per user. They ran at 4.6x the cost of appropriately engineered ones. The cost was driven almost entirely by tail-latency variance rather than compute. The number compounds because every new component adds multiplicative variance, not just multiplicative cost.
What is the difference between over-engineering and good engineering?
Good engineering solves the problem you have at the scale you can measure. Use the smallest set of components that meets a defined tail-latency budget. Over-engineering solves imagined future problems. It adds components that make the design review feel more rigorous. The percentile that matters never moves.
Is over-engineering the same as technical debt?
No. They are opposites in mechanism but similar in cost. Technical debt is a shortcut you take to ship faster and pay back later. Over-engineering is a detour you take to ship slower upfront and pay forever. Every extra component becomes a permanent tax on variance, cognitive load, and incident response.
How do you avoid over-engineering in distributed systems?
Apply a three-question gate before adding any component. Ask what failure it prevents. Ask what percentile it protects. Ask what its P99.99 contribution is at 10x current load. If you can't answer all three with data, the component doesn't ship. The "appropriately engineered" alternative is envelope-first design. Pick the simplest architecture that meets your measured load. Then document the envelope. Then revisit only when you hit it.
When is over-engineering actually justified?
When a specific, measured constraint forces it. For example, a regulatory requirement. Or a contractual SLA with a P99.99 clause. Or a documented scaling projection backed by data. It is never justified by "we might need this someday." It is also never justified by a design review preference for more components. If you can't point to the constraint, the complexity is a tax you're choosing to pay for no return.
Map the variance tax across your top three services this week. See where the 4.6x is hiding.
About the author
Mayank Singh is a software developer at Levitation Infotech, where he builds web and AI-powered applications across the company’s fintech, healthcare, and enterprise projects.